Close
0%
0%

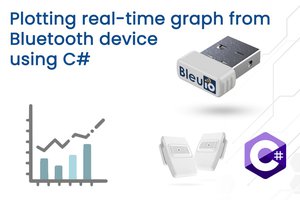
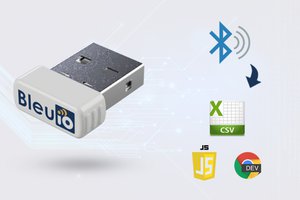
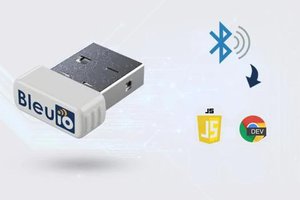
Plotting real-time graph from Bluetooth 5.0 device

In this project I tried to plot a real-time graph of values to Google Chrome from Bluetooth device data.

Public Chat
Similar projects worth following
  • Description
  • Details
  • Files 0
  • Components 0
  • Logs 0
  • Instructions 0
  • Discussion 0
Starting from
$19.99
axelh has 13 orders / 0reviews
Ships from Sweden
For this project, I am using Bluetooth Low Energy USB dongle called BlueIO, which will act as a central device to retrieve data. Hibou Air Quality Monitor which will serve as a peripheral device to transmit the data. The script is simple to use and can be used for other purposes such as showing real-time air quality data; temperate, humidity, pressure, particle matters etc.The data could be later stored on a cloud service of choice.
Things we need:
Google chrome version 78 or later (windows)
BleuIO — Bluetooth Low Energy Adapter
Hibou Air Quality Monitor sensor device

Details Instruction is available at
https://www.bleuio.com/blog/details.php?id=942&title=Plotting-real-time-graph-from-Bluetooth-5.0-device-to-Google-ChromeProject

Read more at Instructables.

Enjoy this project?

Share

Discussions

Similar Projects

Does this project spark your interest?

Become a member to follow this project and never miss any updates