 Phil Malone
Requirements
To begin my journey, I decided on my primary requirements:
- The VE should employ a Display Strategy that uses all possible visual cues. This includes LED a) Position, b) Color and c) Intensity.
- I want the VE to respond to ambient sounds, so I need to use a microphone.
- The VE should respond to the full human audio spectrum, so I need a high quality microphone with a flat response over as wide a range as possible.
- In order to discriminate specific sounds, I want a LOT of visible frequency Bands. If you consider the keys of a piano as discrete notes, then to be able to perceive a piano tune, you would need 88 spectral bands (covering 9 octaves).
- To be able to perceive rhythms as well as melodies, the sound-to-vision response time must be very short. I want the VE to be able to show a fast percussive beat, like a drum roll. However, at some point our eye’s “Persistence of Vision” will mask rapid visual changes, so I’d like to get as responsive as possible without going overboard.
- Since sounds levels vary wildly (many orders or magnitude) the user should be able to adjust the visual “gain” (intensity) of the display. Some means of automatic gain control may be possible and desirable.
Requirement 1: Display Strategy
To keep things simple to begin, I decided that I would utilize a single RGB LED Strip with high LED density for the display.
The LED strip would represent the human-audible spectrum range, and each LED would display one frequency band. Each LED frequency band will have a “Center Frequency” (CF) and each CF will be a constant multiplier of the previous band’s CF. This approach provides a very popular logarithmic frequency display.
Since not all LEDs would be on at any one time, the color of each LED will reinforce its position in the spectrum. The lowest frequency would be Red, and the highest frequency would be Violet. The classic rainbow ROYGBIV color spectrum would be spread across the audio spectrum.
The actual strength of each frequency band will be indicated by the brightness of the LED.
Requirement 2: The Microphone.
I’m not a big fan of analog circuitry, and I know that to get a good audio input for Analog to Digital conversion you need to make sure your pre-amplification circuitry is well designed. So to avoid that problem I researched some available digital microphones (the type you might find in a good phone). I discovered that there were two basic interface types: Inter-IC-Sound (I2S) and Pulse Density Modulation (PDM).
I2S is a serial data stream that sends a series of bits that make up a binary words that represent instantaneous sound levels. PDM is also a digital stream, but it’s more like a Pulse Width Modulation (PWM) strategy where the changing duty cycle of the stream indicates the sound level. Both methods are best performed by a processor that has a native device interface that it can use.
I found an example of each microphone type at Adafruit.com. Both were mounted on a basic breakout board for easier prototyping.
I2S: Adafruit I2S MEMS Microphone Breakout - SPH0645LM4H (PRODUCT ID: 3421)
PDM: Adafruit PDM MEMS Microphone Breakout – SPK0415HM4H (PRODUCT ID: 3492)
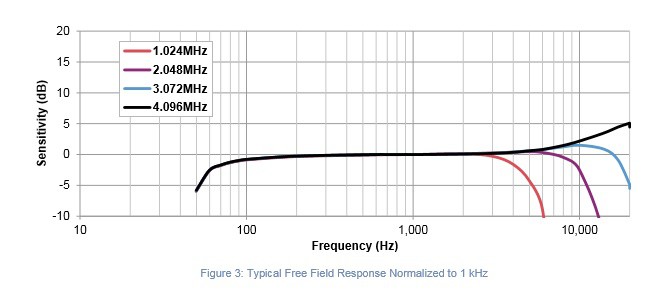
Requirement 3: Flat Spectral Response
Both of the previously identified microphones show a relatively flat response (+/- 2dB) from 100Hz to 10Khz, with degraded response continuing to the 50-16kHz range. Until it’s demonstrated otherwise, these microphones will be suitable for prototype testing.
 I2S: - SPH0645LM4H
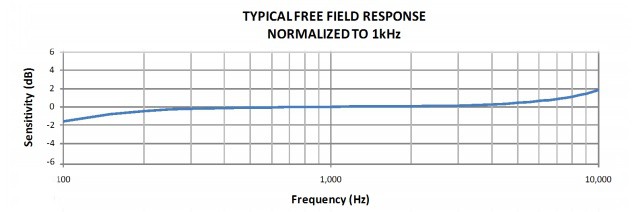
PDM: – SPK0415HM4H
Requirement 4: Many Frequency Bands
To have lots of display bands, we need a way to split the incoming audio spectrum into frequency ranges that correspond to each of the Bands. The most common numerical method for splitting an analog signal into frequency Bands is called a Fourier Transform. Since this is computationally intensive, there is a simplified method called the Fast Fourier Transform, or FFT.
The first step for performing an FFT is to sample the input waveform to produce an array of amplitude values. The number of samples in this array MUST be a whole power of 2, as in “2 raised to the power of N” where N is an integer. (for example 2 ^ 10 = 1024 samples.) These samples must be taken at a constant rate at a known “Sample Frequency”.
Once the FFT has been performed on the input set, the output will be an array of frequency “Bins” with half as many values as the original sample set. Each bin will correspond to a small range of frequencies, and the full set of Bins will span from 0 Hertz, to half the Sample Frequency.
Example: Assume a value of N = 11, and a Sample Frequency of 44 kHz. This requires 2048 samples to be collected and passed to the FFT. (This will take 46.5 mSec.) The FFT will then generate an output of 1024 frequency Bins that range from 0 Hz to 22 kHz. Since there are 1024 Bins, each bin corresponds to a fixed frequency span of 21.48 Hz (ie: 20,000 / 1024)
Unfortunately, these frequency Bins are not the same as the Bands we want the Visual Ear to display. Since display Bands increase logarithmically in frequency, they get wider and consume more of the FFT frequency Bins along the way. In fact, each octave of Bands consumes twice as many Bins as the previous octave. So if the VE display spans 9 octaves like a piano, and has 8 Bands per octave we are going to need at least 2048 frequency Bins to distribute across. And even this is an absolute theoretical minimum.
Requirement 5: Fast response times.
In order to visually perceive rapid frequency and amplitude changes, the VE needs to be able to perform three actions in quick succession. These are a) Collect the required audio samples from the microphone b) Perform the FFT processing to form frequency Bins. c) Convert Bins into Bands and display them on the LED string.
If these tree steps are performed in a classic linear fashion, then the delay (or latency) from the moment a sound occurs, to when it is finally displayed, is the sum of the processing times for a), b) and c).
As an initial starting requirement, the system should be able to display a moderate “drumroll”, which constitutes approximately 10 strikes per second. This means that the system must be able to provide at least 20 updates per second to be able to show a high and low LED brightness for each drum hit.
So, the end to end latency of the system should be 50 milliseconds (mSec) or less.
Note: Given that in the initial FFT example we calculated it would take 46 mSec to JUST sample the audio, this will present a challenge.
Discussions
Become a Hackaday.io Member
Create an account to leave a comment. Already have an account? Log In.