 Marius Taciuc
Well, we have to consider that the components are not perfect. The manufacturer says that the thermistor is having a 1% tolerance. Judging by the piece of code I posted at the first project log, the following parameters are influencing the final result: input voltage, tolerance of the fixed voltage divider resistance and the tolerance of the thermistor. In reality there will be other factors like: the tolerance of the oscillator of the microcontroller, the voltage dropout on the traces, the temperature drift of other components, tolerances of the internal ADC converter inside the controller, etc. If everything else was perfect and I would only have to deal with the tolerance of the thermistor, how much would that influence the final result? I mean, if I have a 1% tolerance thermistor, would the final measurement vary with 1%, more or less?
To find out the answer for 25⁰C (for example) we just go to the online calculator and we input the following parameters:
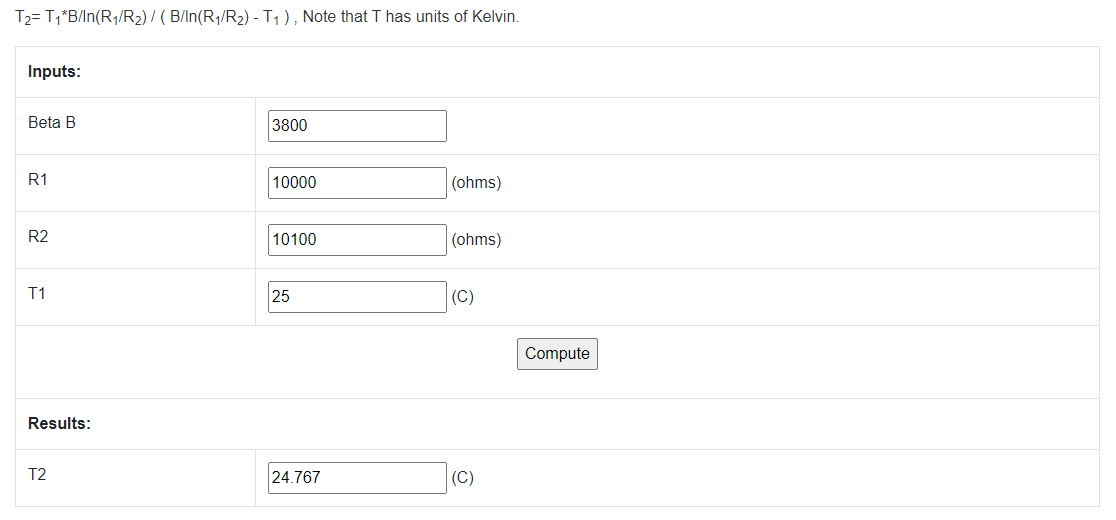
In this case, R1 is what the thermistor should have at 25⁰C and R2 is what the thermistor actually has. I modified R2 at its maximum error. 1% tolerance means that the component can either be 99% or 101% of the total value of 10KΩ at maximum error. The expected result should normally be 25, but instead it is 24.767⁰C. We can apply the law of three here:
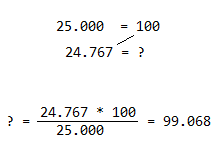
So the total error of the final result based on only the maximum tolerance of the thermistor is less than 1% in this case. Similar to this example, maximum errors can be calculated for each element in the chain I mentioned above. Later on, all of these errors can be summed up together in a single equation:

And of course, all of these formulas can be written in a Mathcad sheet (Matlab or even Excel can be used) in order to be able to elegantly play with the numbers in real time. Of course, the above equation only reveals what happens when all of the errors go one way, but most of the times in a similar chain of errors we also have some that cancel each other. Considering the fact that, for instance, Err.thermistor can take at some point in time any value between 99% and 101%, thus this error can be anything from a min to a max, we could include all of these minimums and maximums into a giant model. A model that would include all the minimums and maximums of all the other errors. So for a better mathematical representation of the total error we can write a matrix that would be something like this:
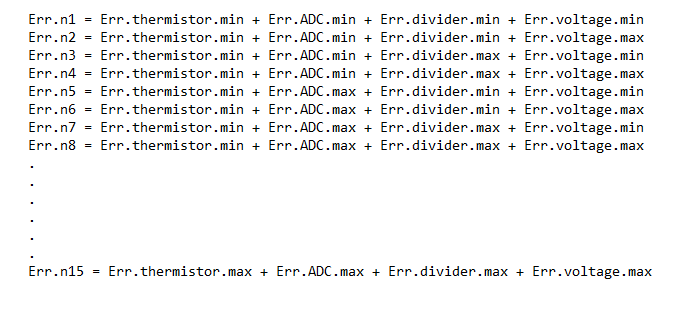
Then we can analyze which is the maximum Err.n and have that reported at the end of the worksheet. Many times, these mathematical models can also reveal what happens with the circuit if one of the components goes bad or out of calibration. A complete worksheet like that is also sometimes called Risk Analysis study, Failure prediction or Component case study. Here is where rocket science starts to happen as this risk analysis study can take on a whole new dimension based on the complexity of the transfer functions of all the components on that board. I mean, in this example it seems simple because I am only dealing with serial resistors and a thermistor, but imagine an electronic module meant to equip vehicles, aircrafts or even space probes. Almost all of the major companies like Tesla, Boeing, Nasa and many others are playing with the transfer functions like that and creating these risk analysis. The higher the required safety level is, the deeper and more complex the math model analysis goes.
That is not all. This thermometer does not limit itself to having a small, predefined error. Maybe you were wondering why I declared Rdiv to be 9950 ohms (instead of 10K) in the C++ software section I posted a few days ago. It is because I have the possibility of measuring these components with a very precise ohmmeter before inserting them into the schematic and that can result in calculating and obtaining even a smaller error than 1%. In order to achieve a very precise thermometer using regular electronic components, I propose two ways of approaching this issue. One of them would be to measure all of the components before soldering them to the motherboard. This method would allow for software corrections that are characteristic to each prototype. The second method would be calibrating the thermometer using a very precise thermal chamber, reading the total error, converting this total error in a “parasitic” transfer function and then subtracting this function, in software, from the initial transfer function. Because I don’t have access to a very fancy and precise climatic chamber at the moment and I cannot do the calibration, I will just stick to the first method of measuring all of the components in a very precise way. This gets rid of some of the errors. A precise resistance measurement can be performed on the thermistor as well. This measurement needs to be performed at 25⁰C sharp and the value of this particular one must be exactly 10000 ohms. Any error can be later on corrected from software.
Judging by the mathematical model sheet I included into the Files area, you can tell that the ADC error could make a very big impact if the datasheet of the microcontroller says that in some temperature conditions, the ADC reading could vary up to 3 lsb, then that is huge. That can impact the measurement with 2⁰C in some cases. So how can this thing be even close to being precise? The answer lies with the average function I built into the software and the multitude of samples I take each second. The ADC is having a 10 bit resolution and that is not enough to measure tenths or even halves of degrees. This is where little noises into the system start to become handy and that is because they make the ADC fluctuate around the real value. The average software function can “see” between these integer ADC values and their fluctuation and find the real floating point value of the temperature. It averages between the latest 20 samples. The result can then be converted into an astonishing 4 - 5 numbers after the decimal point with a total average error of under 0.05% .
The temperature is not being displayed in real time. This is like the Heisenberg’s uncertainty principle. Once you pass a current through that thermistor to read its temperature, you have already influenced the measurement. When you have such a precise tool with a small mass transducer you realize that temperature can vary very fast from the second decimal on. So in order to be able to read it, it is very important to make the changes shift slowly on the display. The whole perceived experience happens in the past. The displayed values are of the temperatures that were present on the transducer 2 or 3 seconds ago and the system will not have a very high resolution on the time axis. This means that it will not perceive narrow spikes and short variations. All these will get filtered by the averaging function.
Discussions
Become a Hackaday.io Member
Create an account to leave a comment. Already have an account? Log In.