 Thornhill!
Overview:
When those summer storms or winter blizzards come rolling in, it can be handy to look at a weather radar to determine their direction and possible intensity. Not wanting to have another open tab on my web browser, I made the Weather Radar as a permeant retro radar viewer for my desk!
Connected to Wifi, the Radar downloads raw NWS radar images, overlays them on a map, creates and then plays looping animations of the 1-hour precipitation layer. With NWS forecasts and OpenWeather data, the Radar also shows current weather conditions and the forecast for the next few days.
A toggle switch and 5-way navigation switch allow switching between modes/pages, while a continuous rotation potentiometer acts as a zoom knob for the map.
Background
Originally the Weather Radar began as a small CircuitPython microcontroller project that quickly got out of hand (as well as available RAM) using static radar images from the old NWS website.
While I upgraded to use a RaspberryPi Zero instead, the NWS upgraded their radar webpage to feature HTML5, an interactive map, and Open Geospatial Consortium (OGC) compliant layers. These layers are especially handy because they can provide us with raw radar images for a particular area via a simple URL request (using Web Map Service WMS or Web Feature Service WFS protocols).
The NWS helpfully provides a page of the OGC compliant layers they offer, including alerts, warnings, and layers for the 200+ weather radar stations).
Methodology:
For a given latitude and longitude in the USA, the Radar:
- Obtains the nearest radar station ID (using the Weather API service)
- Uses the radar station ID (e.g. KJAX) to obtain metadata and times for previous radar layers (e.g. XML GetCapabilities document for the 1 hour precipitation layer for the radar station in Jacksonville).
- Generates a tiled base map using the GeoTiler library (using a given zoom level, map size, and map centre).
- Uses all of this information to make a WMS request and download the last 5 - 10 radar images.
- For each time frame, combines the base map, radar image, and other layers and annotations using the Pillow imaging library.
- Displays the combined image for each time frame, to make a looping animation.
- Uses the latitude and longitude to get OpenWeather and NWS data for some extra forecasting jazz.
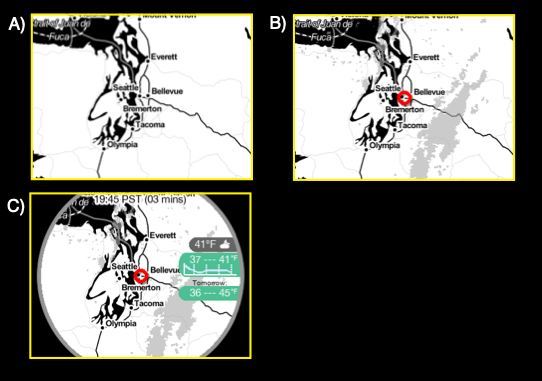
B) Radar image is added on top with slight transparency. Also a marker for our starting lat long position.
C) Now combined with labels, annotation, and weather data. A circle overlay is added to make it blend better with the analog meter case.
Code:
The Weather Radar! is written in Python with Blinka support!
It's also an ongoing project that evolves with the changing of the seasons and with whatever new stuff I learn… which is to say that its code is a muddled hot mess.
Despite this, you can find cleaner example code over on the Weather Radar! github page!
Hardware:
- The Weather Radar! uses a Raspberry Pi Zero W with a 2.4" Adafruit PiTFT HAT. The Pi runs in headless mode, with the HAT as a SPI screen using Blinka and the RGB Display library.
- An Adafruit PCF8591 gives the Pi ADC support to read the analog voltage from a potentiometer mounted on front, while a toggle switch and a 5 way navigation switch connect to the Pi's GPIO pins.
- For an extra bit of jazz, I've also added a Omzlo PiWatcher TB to help monitor the pi and provide the Weather Radar with an on/off switch.
- [2021-06]: A pancake vibration motor and an Adafruit DRV2605L Haptic Motor Controller provide haptic feedback/alerts for severe weather events (Project log: Vibration Alerts!)
Case:
The case is from an old analog meter I found discarded in my shed 5 years ago. I'm not entirely sure what it measured, because the battery...
Read more »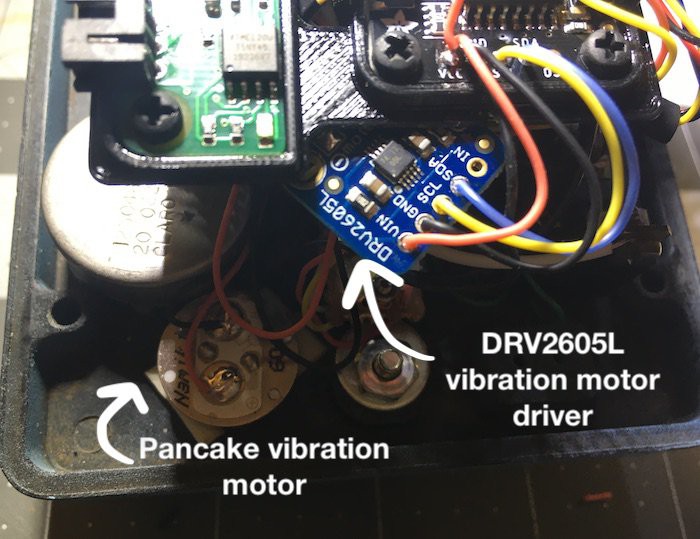


 aerospark
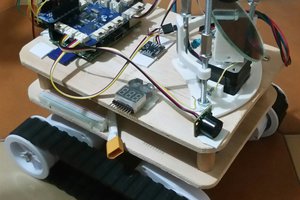
 rlsutton1
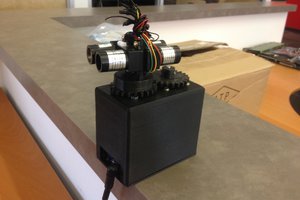
 Jason Wood
This might actually be one of the coolest projects I've seen. Can't wait to get cracking on this one!