 Joseph Eoff
I spent a little time implementing the sensor data plotter this evening. I can now plot the data for single sensors over any time period.
A quick look at the data collected over the last week delivered some surprises.
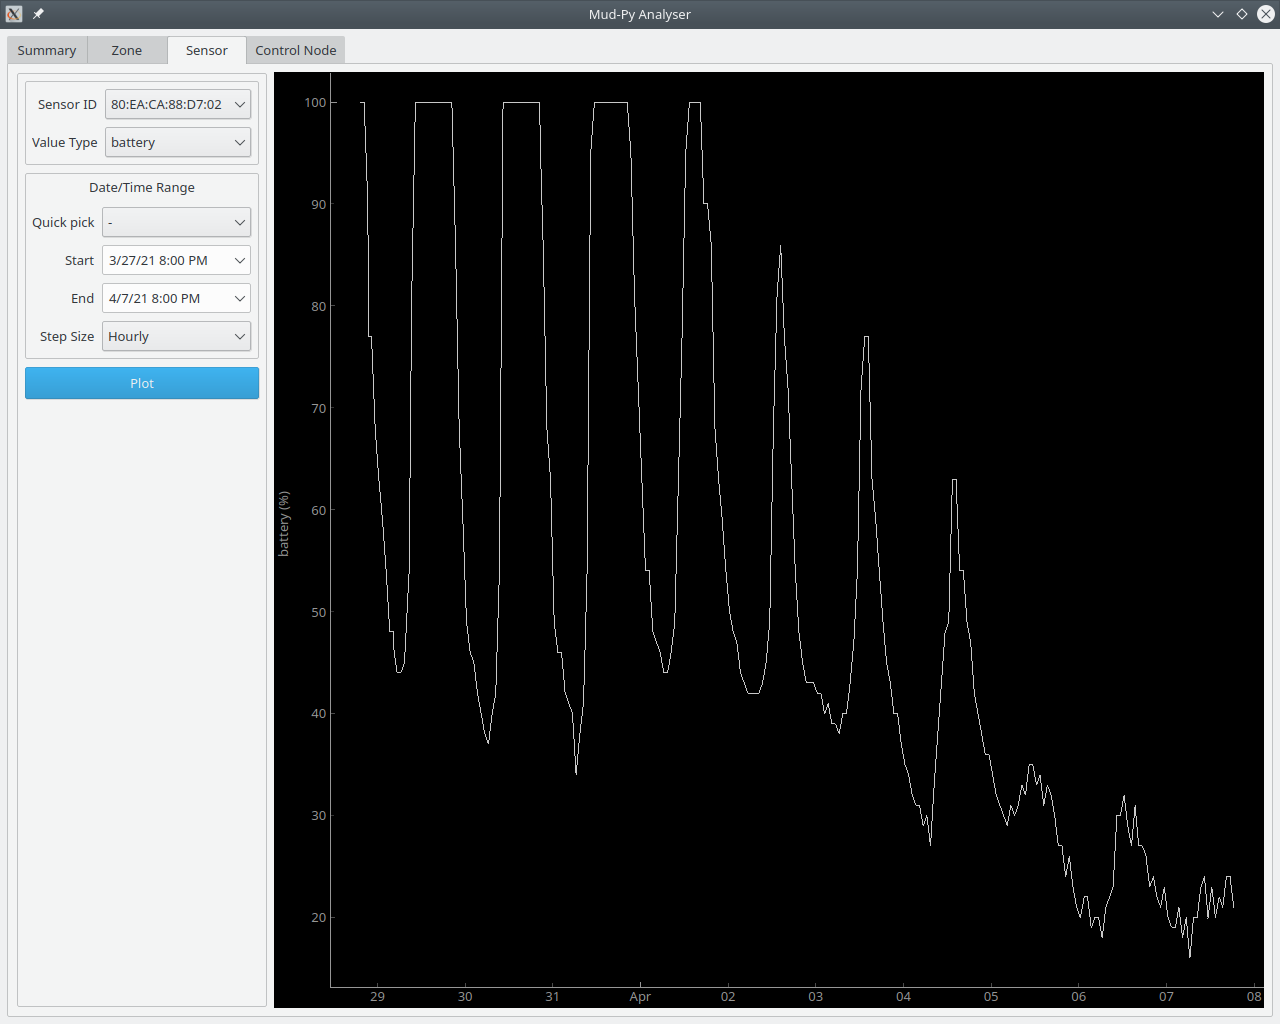
First off, CR2032 coin cells do not like cold weather. The sensors are powered by coin cells, and the sensors report the battery capacity along with the other values.
We had some warm weather when I put the sensors out, with days around 20 to 25 degrees Celsius (mid 70s for Fahrenheit types.) The nights were much cooler, though.
Here's the battery capacity plot of a typical sensor:
 This is the temperature plot for the same sensor:
 The lowest capacity matches the lowest temperatures on each day. The last three days have been cold, with temperatures staying below 10C (50F) all the time. The battery capacity has stayed low, as well. If it doesn't warm up, I may end up having to replace all the sensor batteries.
This is all about the soil moisture, though, so lets have a look.
This is a rather typical sensor:
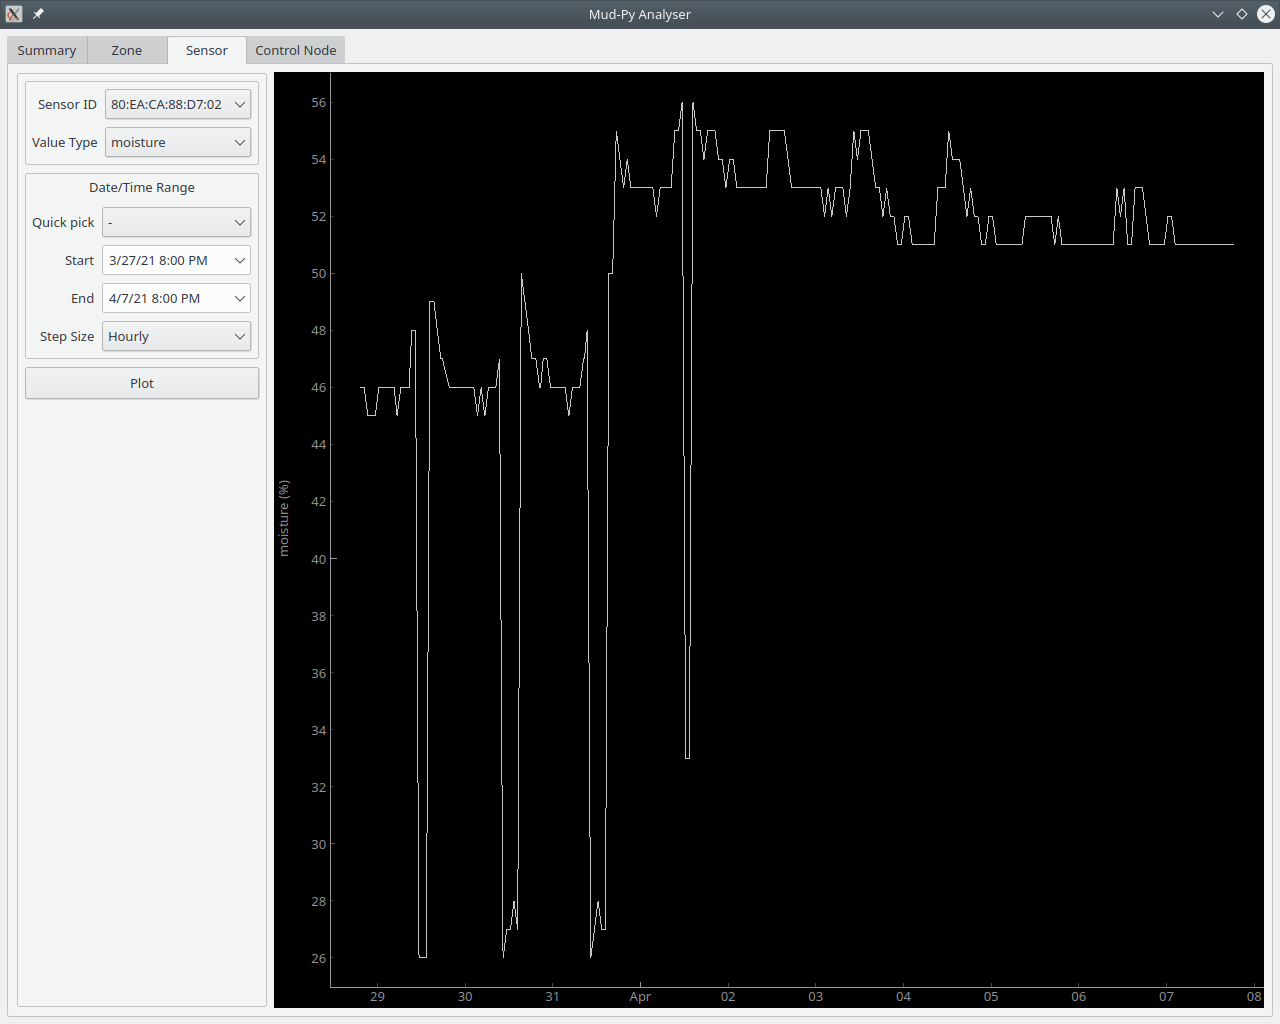 The moisture dropped each day around noon time when it was warm. Since the temperatures have gone down, the moisture has stayed more stable during the day.
This sensor shows rather more concerning data:
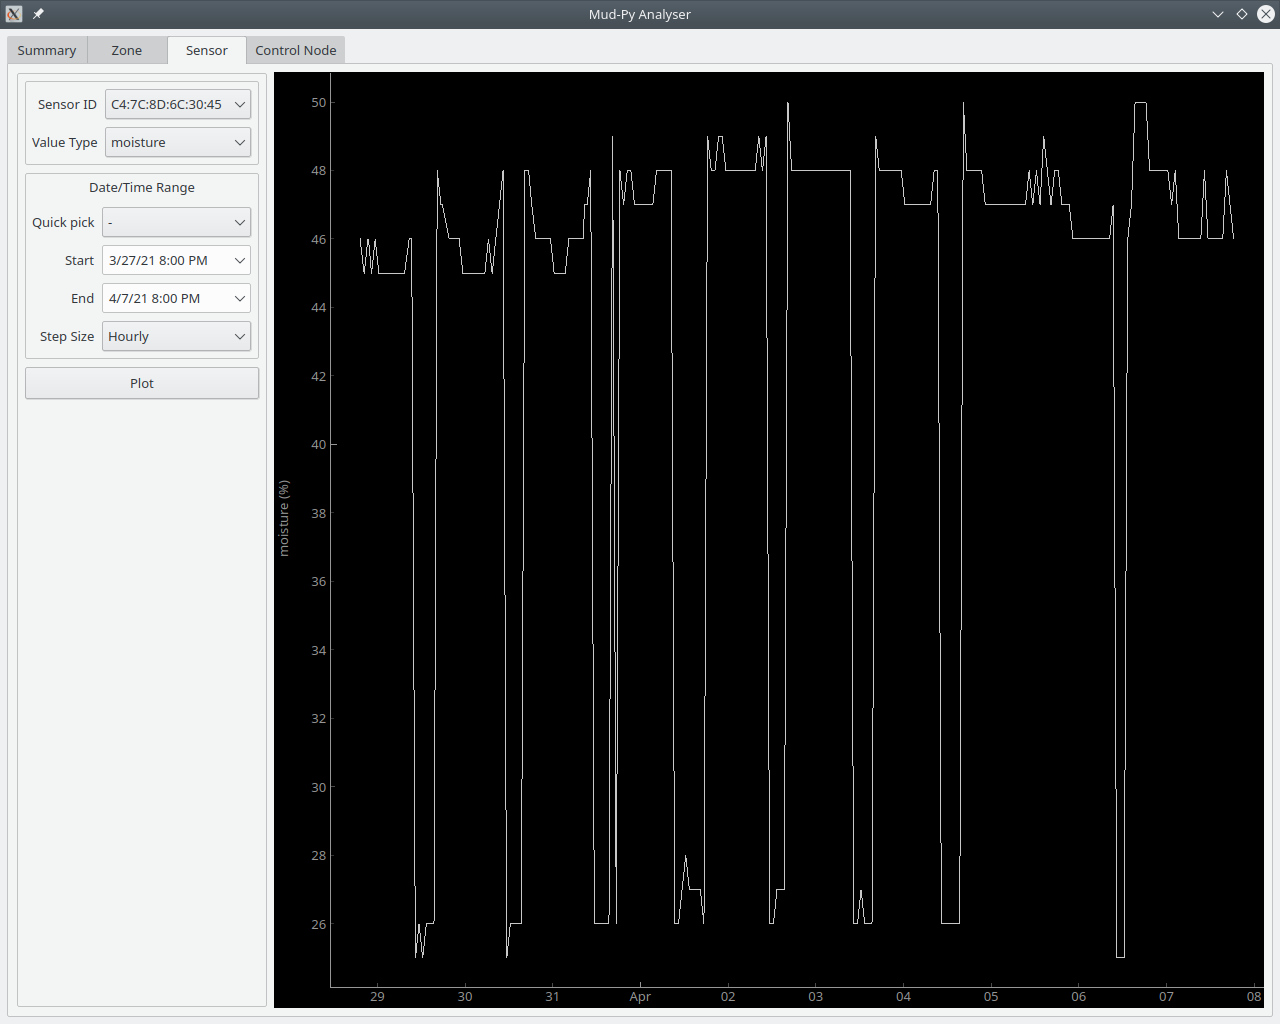 It dropped more drastically during the day, and still had drastic variations after the weather cooled down.
When I implement the "Daily" step size, I'll have to include a maximum, minimum, and average for each day. The average alone isn't much use when you have such variations all the time.
Besides the battery, temperature, and moisture, the sensors also measure soil conductivity and light.
Here's a typical plot of the light:
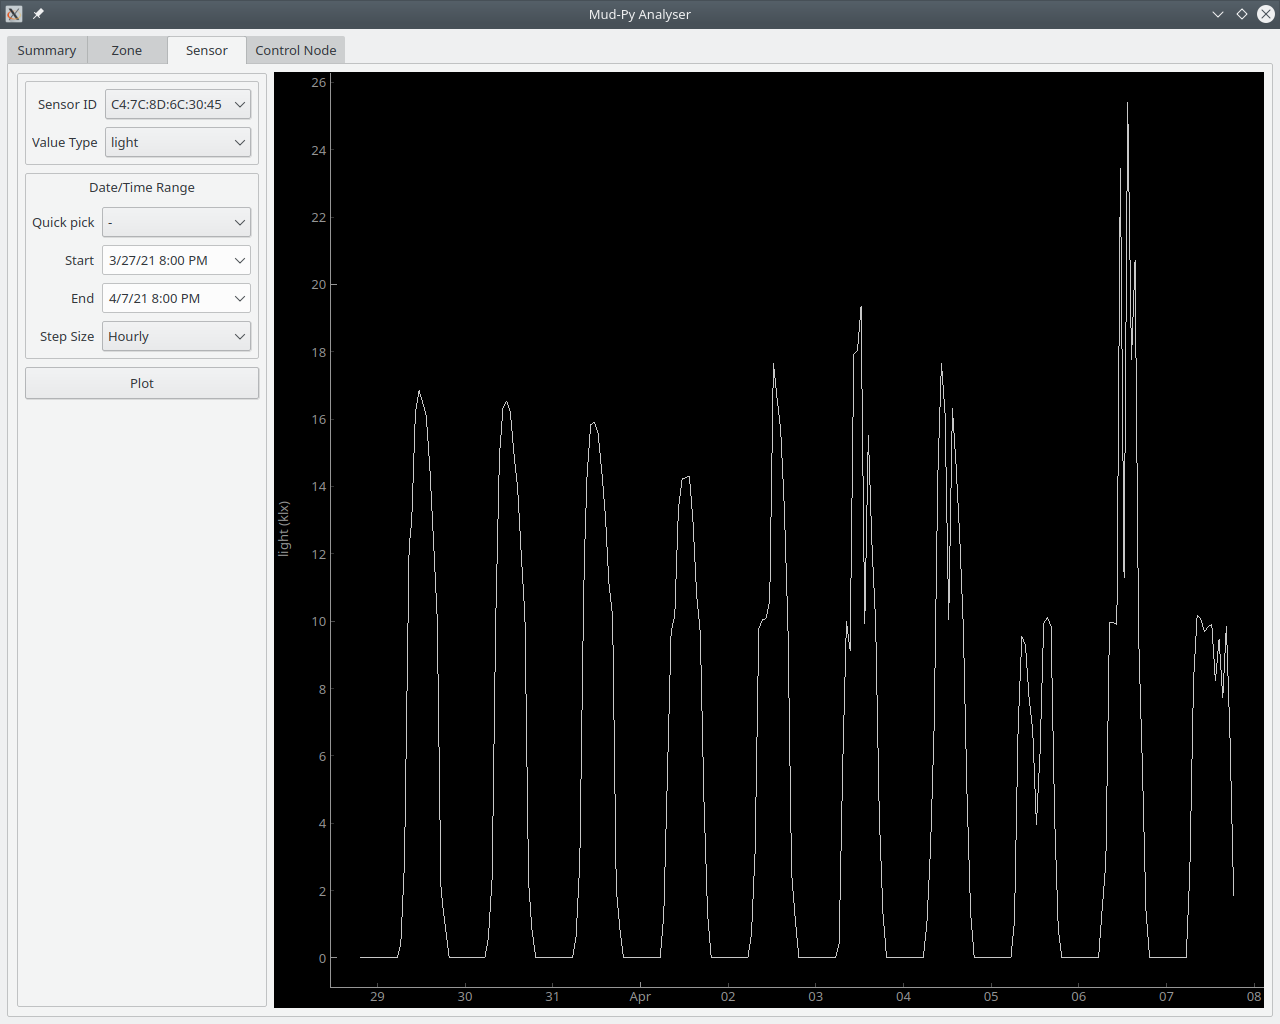 Brightest during the daytime (duh) and zero at night. The street light isn't bright enough to register at night.
Conductivity is a proxy for soil nutrients. More conductivity corresponds to more nutrients in the soil.
 Conductivity also varies with the soil moisture. The nutrients have to be dissolved in water to conduct electricity. When the soil dries out, the conductivity drops. You can see how it varies over the course of the day just like the moisture varies.
I implemented a sort of "pseudo-sensor" when I wrote the software for the control nodes. The control nodes report a "readtries" value for each sensor after reading the data. This value says how many attempts it took to read to sensor data from the sensor. It should ideally be 1 - read correctly on the first try.
I find that the temperature (and therefore battery capacity) has an effect on the readtries - it takes more attempts to read a sensor when it is cold.
Here's the "readtries" plot of one sensor where the battery capacity has dropped to below 30 percent from the last couple of cold days:
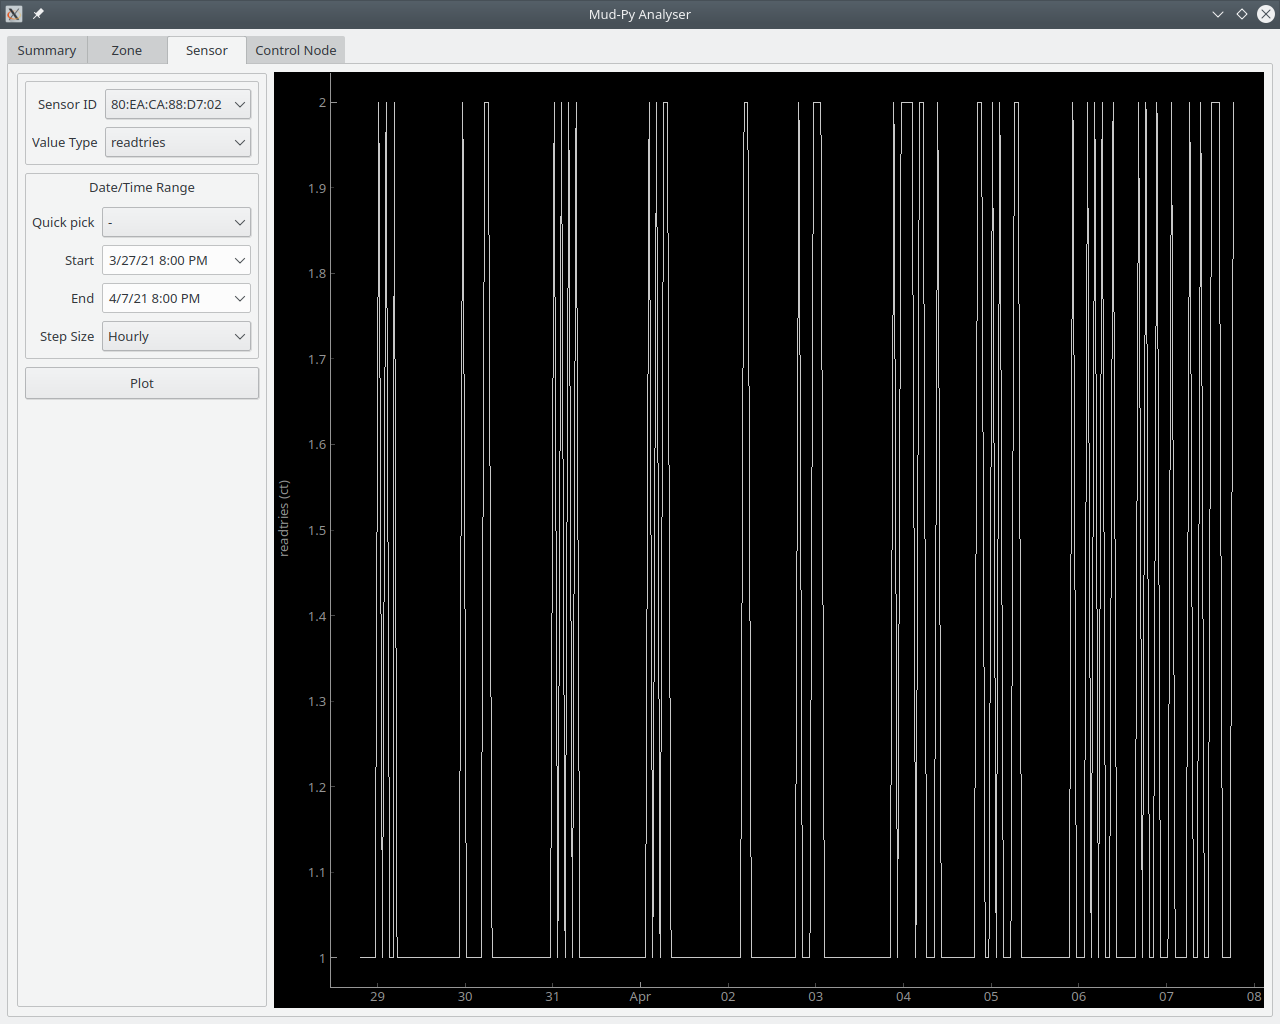 The closely spaced lines over to the right correspond with the battery capacity dropping below 30 percent, and they correspond to the temperature staying below 10C.
Given how much the plots change over the course of the day and how different the measurements are for the individual sensors, I expect the heat map view will be rather lively.
I'll get started on that soon - right after I finish the "Daily" step size for the sensor data plot.
Discussions
Become a Hackaday.io Member
Create an account to leave a comment. Already have an account? Log In.