 Josh Cole
I have entered this project into the data logging contest because of the work I did to analyze and calibrate the HCM5883L magnetometer. It wasn't the whole point of my project, but I think it's a fun look at how visualizations can help understand what's happening.
The ultimate goal of my project is to create a two-wheeled robot which is capable of defeating gravity in a real-time battle against the forces of nature. One of the first major decisions to make: which accelerometer do I use? Having a few HMC5883L sensors lying around, I decided to create a small circuit to collect telemetry and see whether it would be a good candidate for my robot.
RUBBISH
As a sanity check, I wrote a small program to collect the raw sensor readings and then looked at the numbers as I rotated the device about all of its axis. Much to my surprise, the values were all over the place. Rotating along two axis (what I imagined were X and Y) caused all three numbers to change. That's not a good sign, but looking at raw numbers can be a hard thing for humans to make sense of. It's time to open a Jupyter Notebook and plot the data.
IDENTIFYING WHICH AXIS REPRESENT DIRECTIONAL HEADING
The first actual experiment began by mounting my sensor to a large base and then spinning that base like a turn-table. The idea is that if I can isolate the X/Y coordinates and produce a heading, the remaining plane will indicate rotation. With this information, I can apply virtual offsets to the readings to "normalize" the plane.
Collecting this data, I was able to plot it in matplotlib. I used a scatterplot to map two axis at a time. Presumably if I find the dimensions which represent "directional heading" that should appear as a perfect circle.
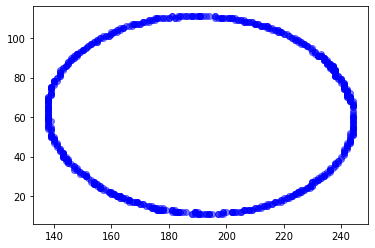
And in fact, I was able to find just that. Here are the visualizations:
X and Z axis are represented by this lovely oval. This would indicate that X and Z are representative of magnetic heading.
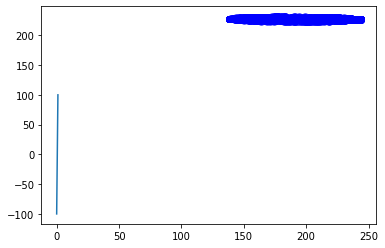
Y and Z are represented by these weird lines. I'm going to assume Y is rotation, and Z is one component of heading. So that means there's variance in the rotation based on which direction the sensor is facing. NOT GOOD!

And lastly, when plotting X and Y we can clearly see there is no correlation whatsoever.
So we now know that X and Z represent directional heading. As we can see by the second graph, the rotation seems to change based on which direction the sensor is facing. An easy win now is to calibrate the rotational axis so it remains flat no matter what the heading is.
CALIBRATING THE SENSOR
Here's some python I came up with to demonstrate how to normalize the rotation value. In pseudo-code, this function loops over each point in the dataset and computes the heading. It then stores a dictionary of values where the key is the heading and the value is the inverse of the actual sensor reading.
If you multiply that value, you will effectively zero out the reading.
def generate_calibration(cal_list_x, cal_list_y, cal_list_z):
    y_factor = {}
    y_factor_count = {}
    for idx in range(0, len(cal_list_y)):
        px = cal_list_x[idx]
        py = cal_list_y[idx]
        pz = cal_list_z[idx]
        h = round(heading(px,py,pz))

        if round(py) == 0:
            factor = 1.0
        else:
            factor = (1 / py)

        if h in y_factor:
            y_factor[h] += factor
            y_factor_count[h] += 1.0
        else:
            y_factor[h] = factor
            y_factor_count[h] = 1.0

    for k in y_factor.keys():
        y_factor[k] /= y_factor_count[k]

    return y_factor
To use the output of this function, you simply ask the robot "what direction am I facing" and then you will get a multiplier that you can apply to the current rotation reading. Any variance detected thereafter should be legitimate.
TESTING OUT THE CALIBRATION
To test out the calibration, it is imperative to isolate the variables as much as possible. I 3D printed a jig which has a 10-degree backwards tilt and then mounted my sensor to this jig. Given a known angle of rotation, it's much easier to collect meaningful data.

So now that my sensor is "calibrated" I went ahead and collected data at this 10 degree tilt. Then I rotated the sensor like a turn-table 360 degrees to the right. Then 360 degrees back to the left. Here is the visualization of the data I collected:
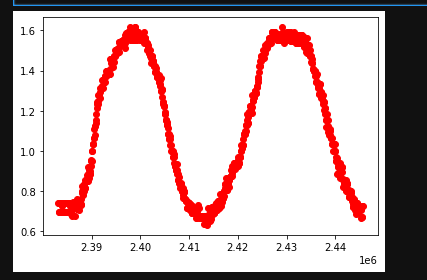
Looking at this chart, it's a little disheartening. The line should be flat if it were calibrated properly, however, the range of values is significantly better. So at least that's something.
INTUITION
I feel it in my soul that it should be possible to determine which orientation the sensor is tilted in (forward or backward) based on the heading we are facing and the sign of the component values. I just need to find the right correlative factors.
It's time to take a step back and plot some of the more nuanced datasets. For this next test, I apply the "turn-table" method while the sensor is rotated 10 degree forward. And then again, while the sensor is rotated 10 degrees backward.
Remember, Y is rotation and Z is a component of directional heading.
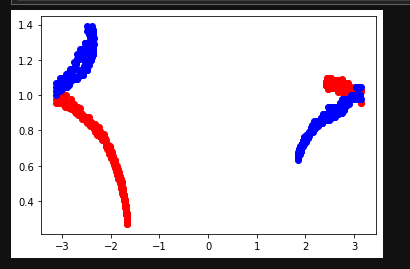
Given that, let's try another scatterplot chart. Since I suspect the sign of the components are relevant, I'm going to use atan2 to compute a sort of angle value. The input to atan2 is going to be Y and Z. This will be used to represent the X axis on the scatterplot. And the Y axis will be represented by how much rotation is being detected.
The atan2 function calculates one unique arc tangent value from two variables y and x, where the signs of both arguments are used to determine the quadrant of the result
If my theory is correct, the graph should be such that a line can be drawn through it which distinguishes the "tilted forward" from the "tilted backward".
In this following chart, the red values represented "tilted backward" while the blue values represent tilted forward.

And holy smokes batman! That actually worked. If you draw a line down the center, you'll get a cleanish partition which divides the readings. Of course there is significant overlap here, but this is finally a positive sign that maybe - just maybe - I can salvage the readings from this sensor!
WE MUST GO DEEPER
Looking at the previous graph in more detail, a "line down the center" would still yield about 50% error rate. Haha. It's funny that I would be celebrating such an awful accuracy.
Holistically looking at the problem, I think it's safe to say the real root cause issue is that the sensors 0,0,0 plane (perfectly flat, not rotated, origin point) must be significantly tilted in a weird way. That means I need to apply some offsets to the X, Y, and Z values in order to "normalize" the plane so that my orientation is what it reads as the tabula rasa state.
Hypothesis: there exists a set of offsets that, when applied, would yield sensor readings that perfectly distinguish between the two datasets used earlier (tilted forward, tilted backward).
The only problem is, how can I find these offsets?
THE MONTE CARLO METHOD
The Monte Carlo Method is a strategy for attempting something randomly over and over until you reach a winning condition. As long as you can tell algorithmically whether a given solution is better or worse than another solution, the Monte Carlo method can be applied.
In this case, I wrote a tiny script which would randomize the sensor reading offsets. I applied this randomization tens of thousands of times until I found the best set of the batch. Given these offsets, the idea is that they will normalize the 0,0,0 plane and improve all other calibration efforts.
The results were fantastic! Like, I seriously can't believe this actually worked.
This chart was generated in the same way as before. X value is rotation, Y value is atan2(rotation, Z). If you were to write two if statements, you could near-perfectly extrapolate which reading was "tilted forward" vs "tilted backward". (which readings were RED or BLUE).
CONCLUSION
By logging telemetry, interpreting it with matplotlib, and applying some rusty trig - I was able to identify a set of multiplication values and offsets which yielded meaningful readings from the HMC5883L magnetometer. The sensor is incredibly sensitive to magnetic fields however, which may preclude me from using it in the final iteration of my project. But I have proven here that it works and learning to dive into the data has been a very rewarding experience.
I'm going to modify my circuit board to include a Sparkfun OpenLog so I can collect more telemetry. Surely that will help once I begin working on the stabilization algorithm.
Discussions
Become a Hackaday.io Member
Create an account to leave a comment. Already have an account? Log In.