 Ringo2k
Capacitor
The capacitor as a component
Math
Impedance of the capacitor in respect to frequency
![]() Test
Test
I used a 4p7 capacitor in series to a square wave generator.
Scope
yellow = CH1 = INPUT
purple = CH2 = OUTPUT
| f | Scope | Comment |
| 1KHz | 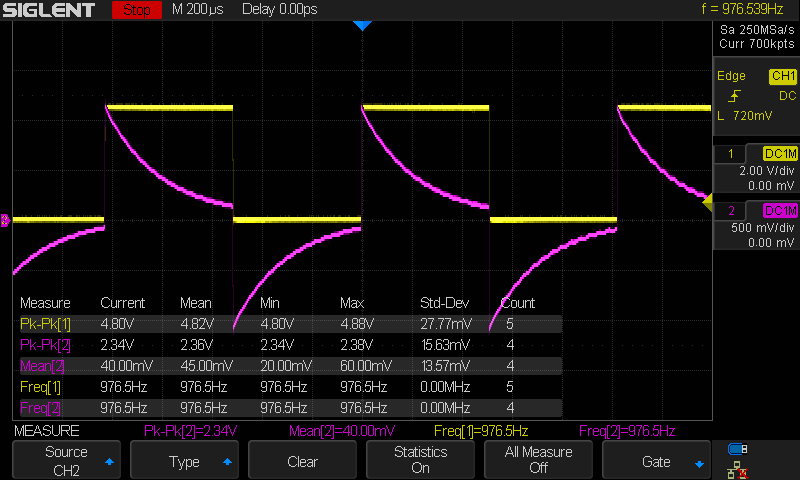 | The capacitor is just passing the high frequency of this low frequency signal, that's why we see the edges. In the "DC-part" of the signal the output signal falls slightly over time. Xc = 33MOhm |
| 15.6KHz | 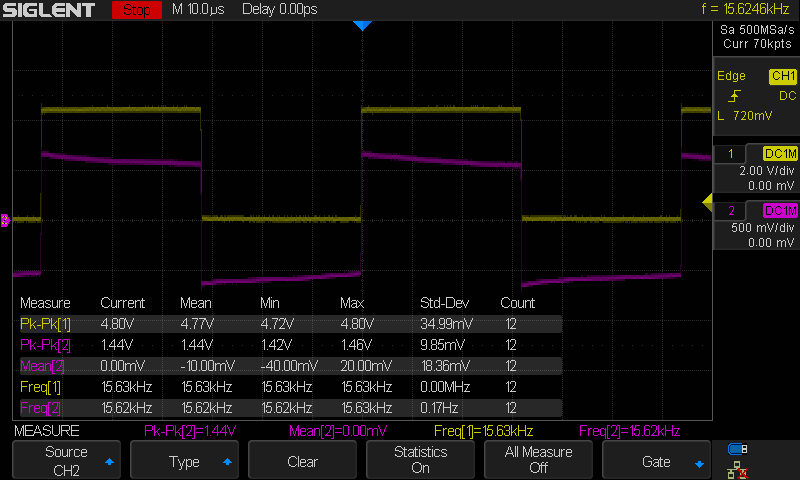 | The signal looks better. We see the mean voltage is around 0V but we have a positive and a negative part of the signal. This effect is used in charge pumps to generate negative voltages (MAX232 for example) Xc = 2MOhm |
| 62.5KHz | 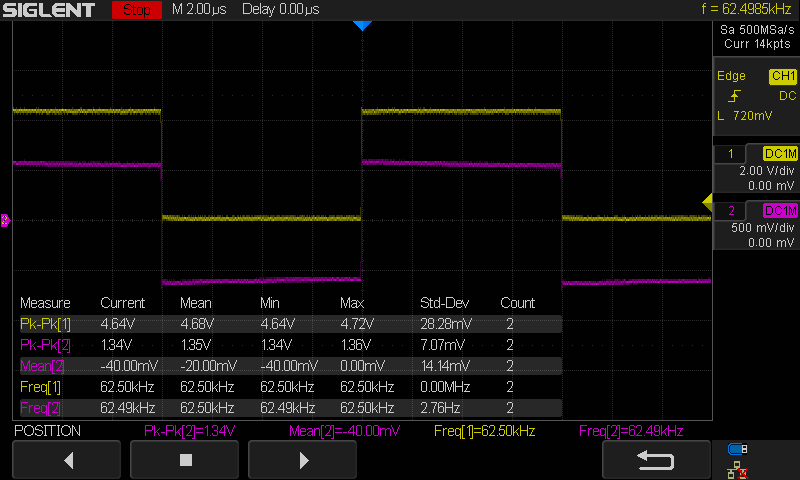 | The signal is now passed nearly without any significant changes. Xc = 500kOhm |
| 1MHz |  | So 1MHz signal is just passing without any problem. Even the distortions are not filtered. Basically just the DC offset of the signal is eliminated. Xc = 31K2Ohm |
| 4MHz |  | Just to have the full range maxed out. |
Inductor
The inductor as a component.
Math
Impedance of the inductor in respect to frequency.
![]() Test
Test
I have a 67uH and a 220uH inductor. So I simply put this inductor in series to a square wave signal.
Scope
yellow = CH1 = INPUT
purple = CH2 = OUTPUT
67uH inductance
I use a PP510 probe with 10-22pF input capacitance (we need this later)
| f | Scope | Comment |
| 488Hz | 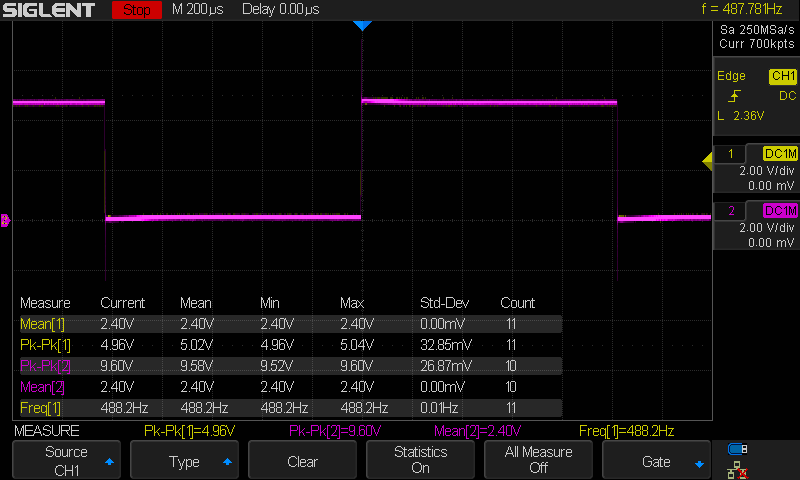 | The signal seems normal but you can see there are spikes on the edges of the signal showing up. |
| 488Hz | 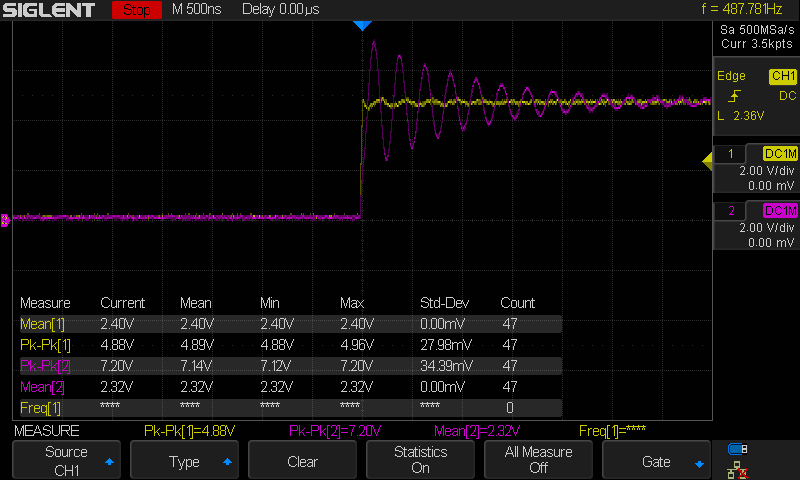 | Zooming in shows the "ringing" of the signal on the edges. Also the 5V signal now went up to 7.2V. Remember inductance inducts voltage :-) |
| 488Hz | 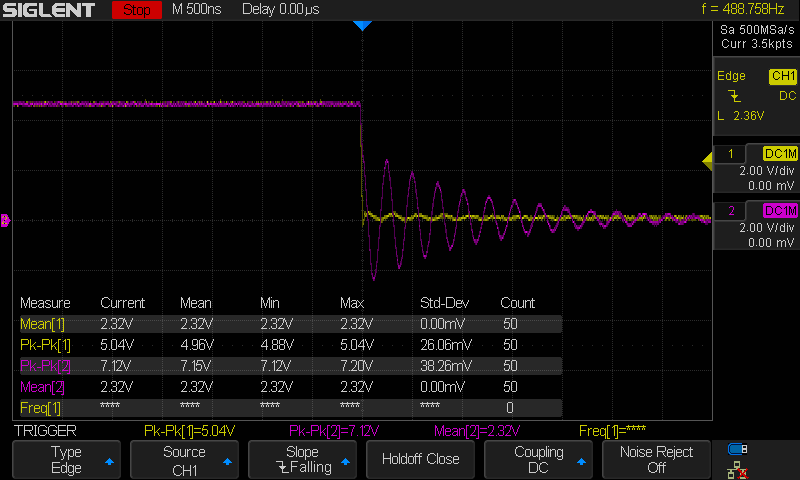 | Inductance reacts on the change of current, so we see the same effect when the signal changes on the falling edge. Note: The ringing also includes a capacitor, which I do not have in the circuit, but my scope probe and my pcb traces have capacitance, so this is not a perfect measurement of a perfect inductor, but that was not the goal. We see the effect. |
| 31.25KHz | 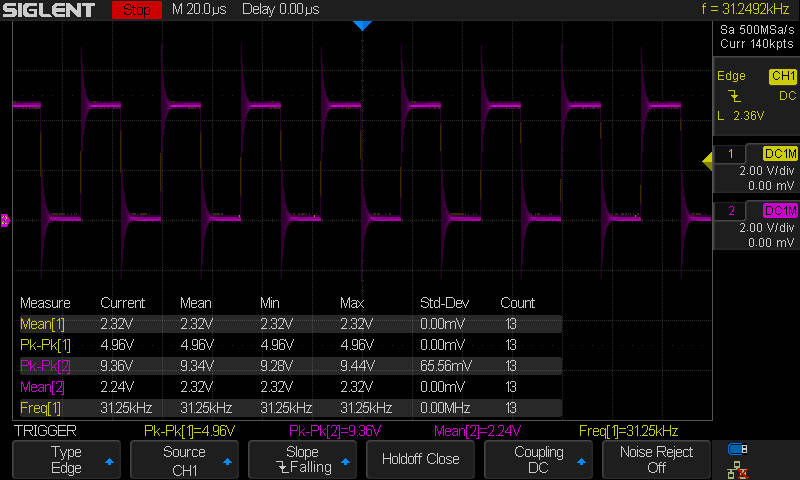 | Increasing the frequency shows the spikes better. We also get a Vpp of 9V! |
| 250KHz | 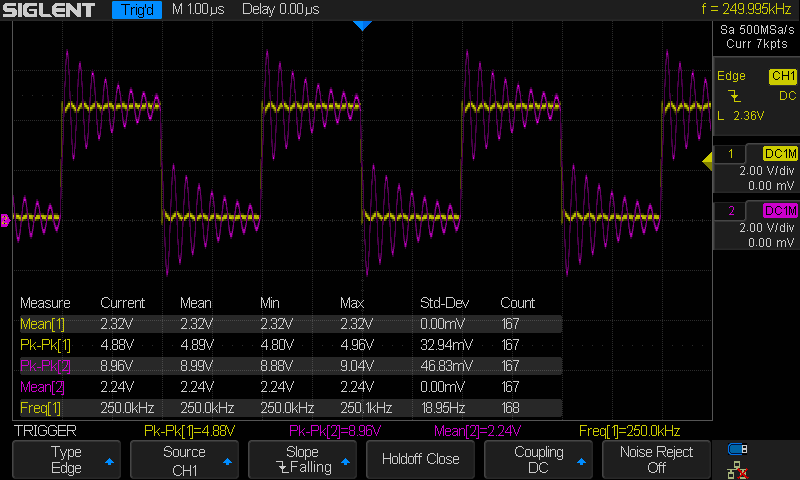 | I like this picture. Just enjoy it, we are getting closer to the target frequency. XL@250kHz = 105Ohm |
| 1MHz | 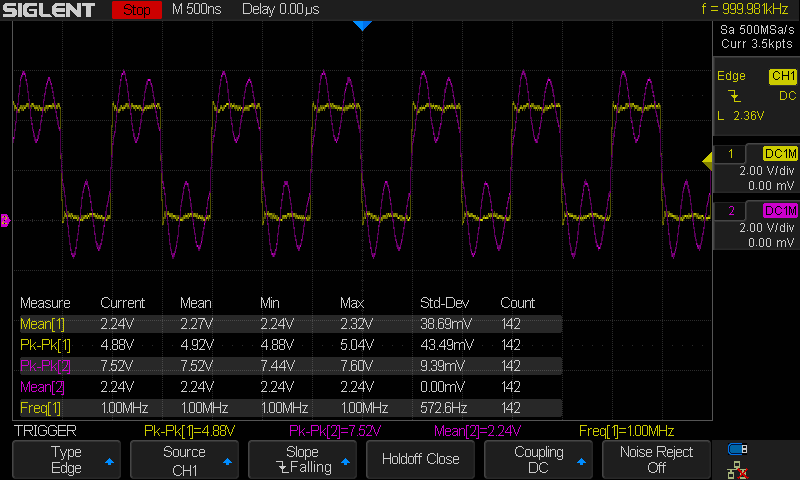 | Ok here we see that the signal is getting filtered heavily. This signal reminds me of measurements of high speed signal on pcb tracks. When your clock looks like this you know what's going on here. The higher frequencies of the signal are filtered, so no sharp edges anymore! |
| 2MHz |  | Ok, we converted the square to a sine wave now. I changed the voltage/div, we have 15.4Vpp here! The sine has basically the 2MHz, so this is a good spot all "higher" frequencies are removed and we see the basic frequency of the signal. XL@2MHz = 842Ohm |
RC Filter
The basic RC low pass filter.
Math
The frequency of the filter can be calculated with the formula:
Test
I used a 3k3 resistor with a 47pF C, this results in
The input signal is a square wave with 4.5Vpp. Also a square wave includes "all frequencies" so I thought this is a good and simple input signal to see the different effects of filters and components.
Scope
yellow = CH1 = INPUT
purple = CH2 = OUTPUT
| f | Scope | Comment |
| 15.62kHz ... |
 Mark Omo
 RoGeorge
 Gintaras Valatka
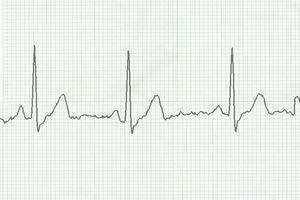
 Nitesh Kadyan