HW rev 0.4
This is the plotted battery voltage data of a sensor (HW rev 0.4) ranging from 2021-03-11 until 2022-08-25: thus showing battery voltage over an almost 1.5 year time frame using an Alkaline 2500 mAh AA battery.

The battery voltage drops from roughly 1.57V to 1.5V after this time.
You can also see that the voltage drop is not linear - it starts fast and then stabilizes around 1.5V.
Please note that this HW rev. 0.4 has a a higher quiescent current than HW rev 0.6 - thus with HW rev 0.6 the battery voltage drop will even be smaller.
The cutoff voltage will be around 0.9V.
HW rev 0.6 / Varta Industrial
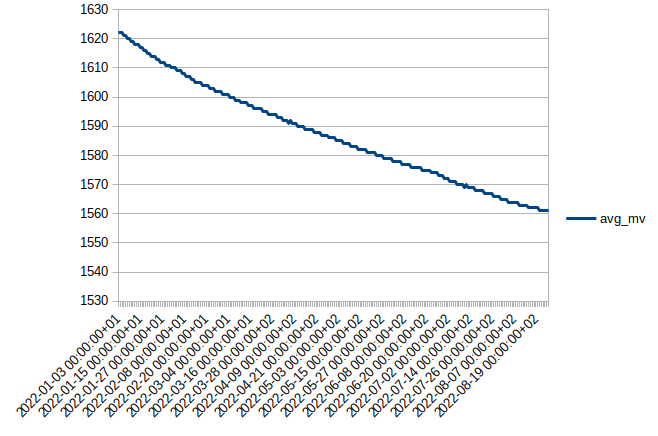
The next chart shows a HW rev 0.6 sensor with a Varta Industrial AA battery over a nearly 9 month time frame.

The battery voltage drops from 1.62V to 1.56V during that time. It has not stabilized yet and will probably do so once the nominal voltage of 1.5V is reached.
We can roughly say that within 9 months the battery voltage has decreased by 60mV. If we assume the decline is linear (which it isn't, the steepness gradually decreases), then we could expect an 80mV loss every year (=12*60/9).
After 8 years the battery voltage would reach 980mV (cutoff ~800-900mV). So even in the worst case we can expect an 8 year battery lifetime here. Note that this is with a linear approach. The battery can last longer because after reaching 1.5V the battery voltage will drop slower than currently. You can even see it in the chart if you look closely: the width of the steps is getting larger and larger. At first there are many tiny steps, and at the end the voltage stays at the same level for a longer time.
Temperature vs Voltage Reference
The reason why the second chart seems much cleaner (voltage dropping like a staircase in steps) than the first chart is probably because the first sensor is mounted outside and affected by big variations in temperature. This influences the internal voltage reference used for measuring the battery voltage. That's why sometimes the first chart has little spikes to the upside.
 canique
Discussions
Become a Hackaday.io Member
Create an account to leave a comment. Already have an account? Log In.