 Kevin Arne
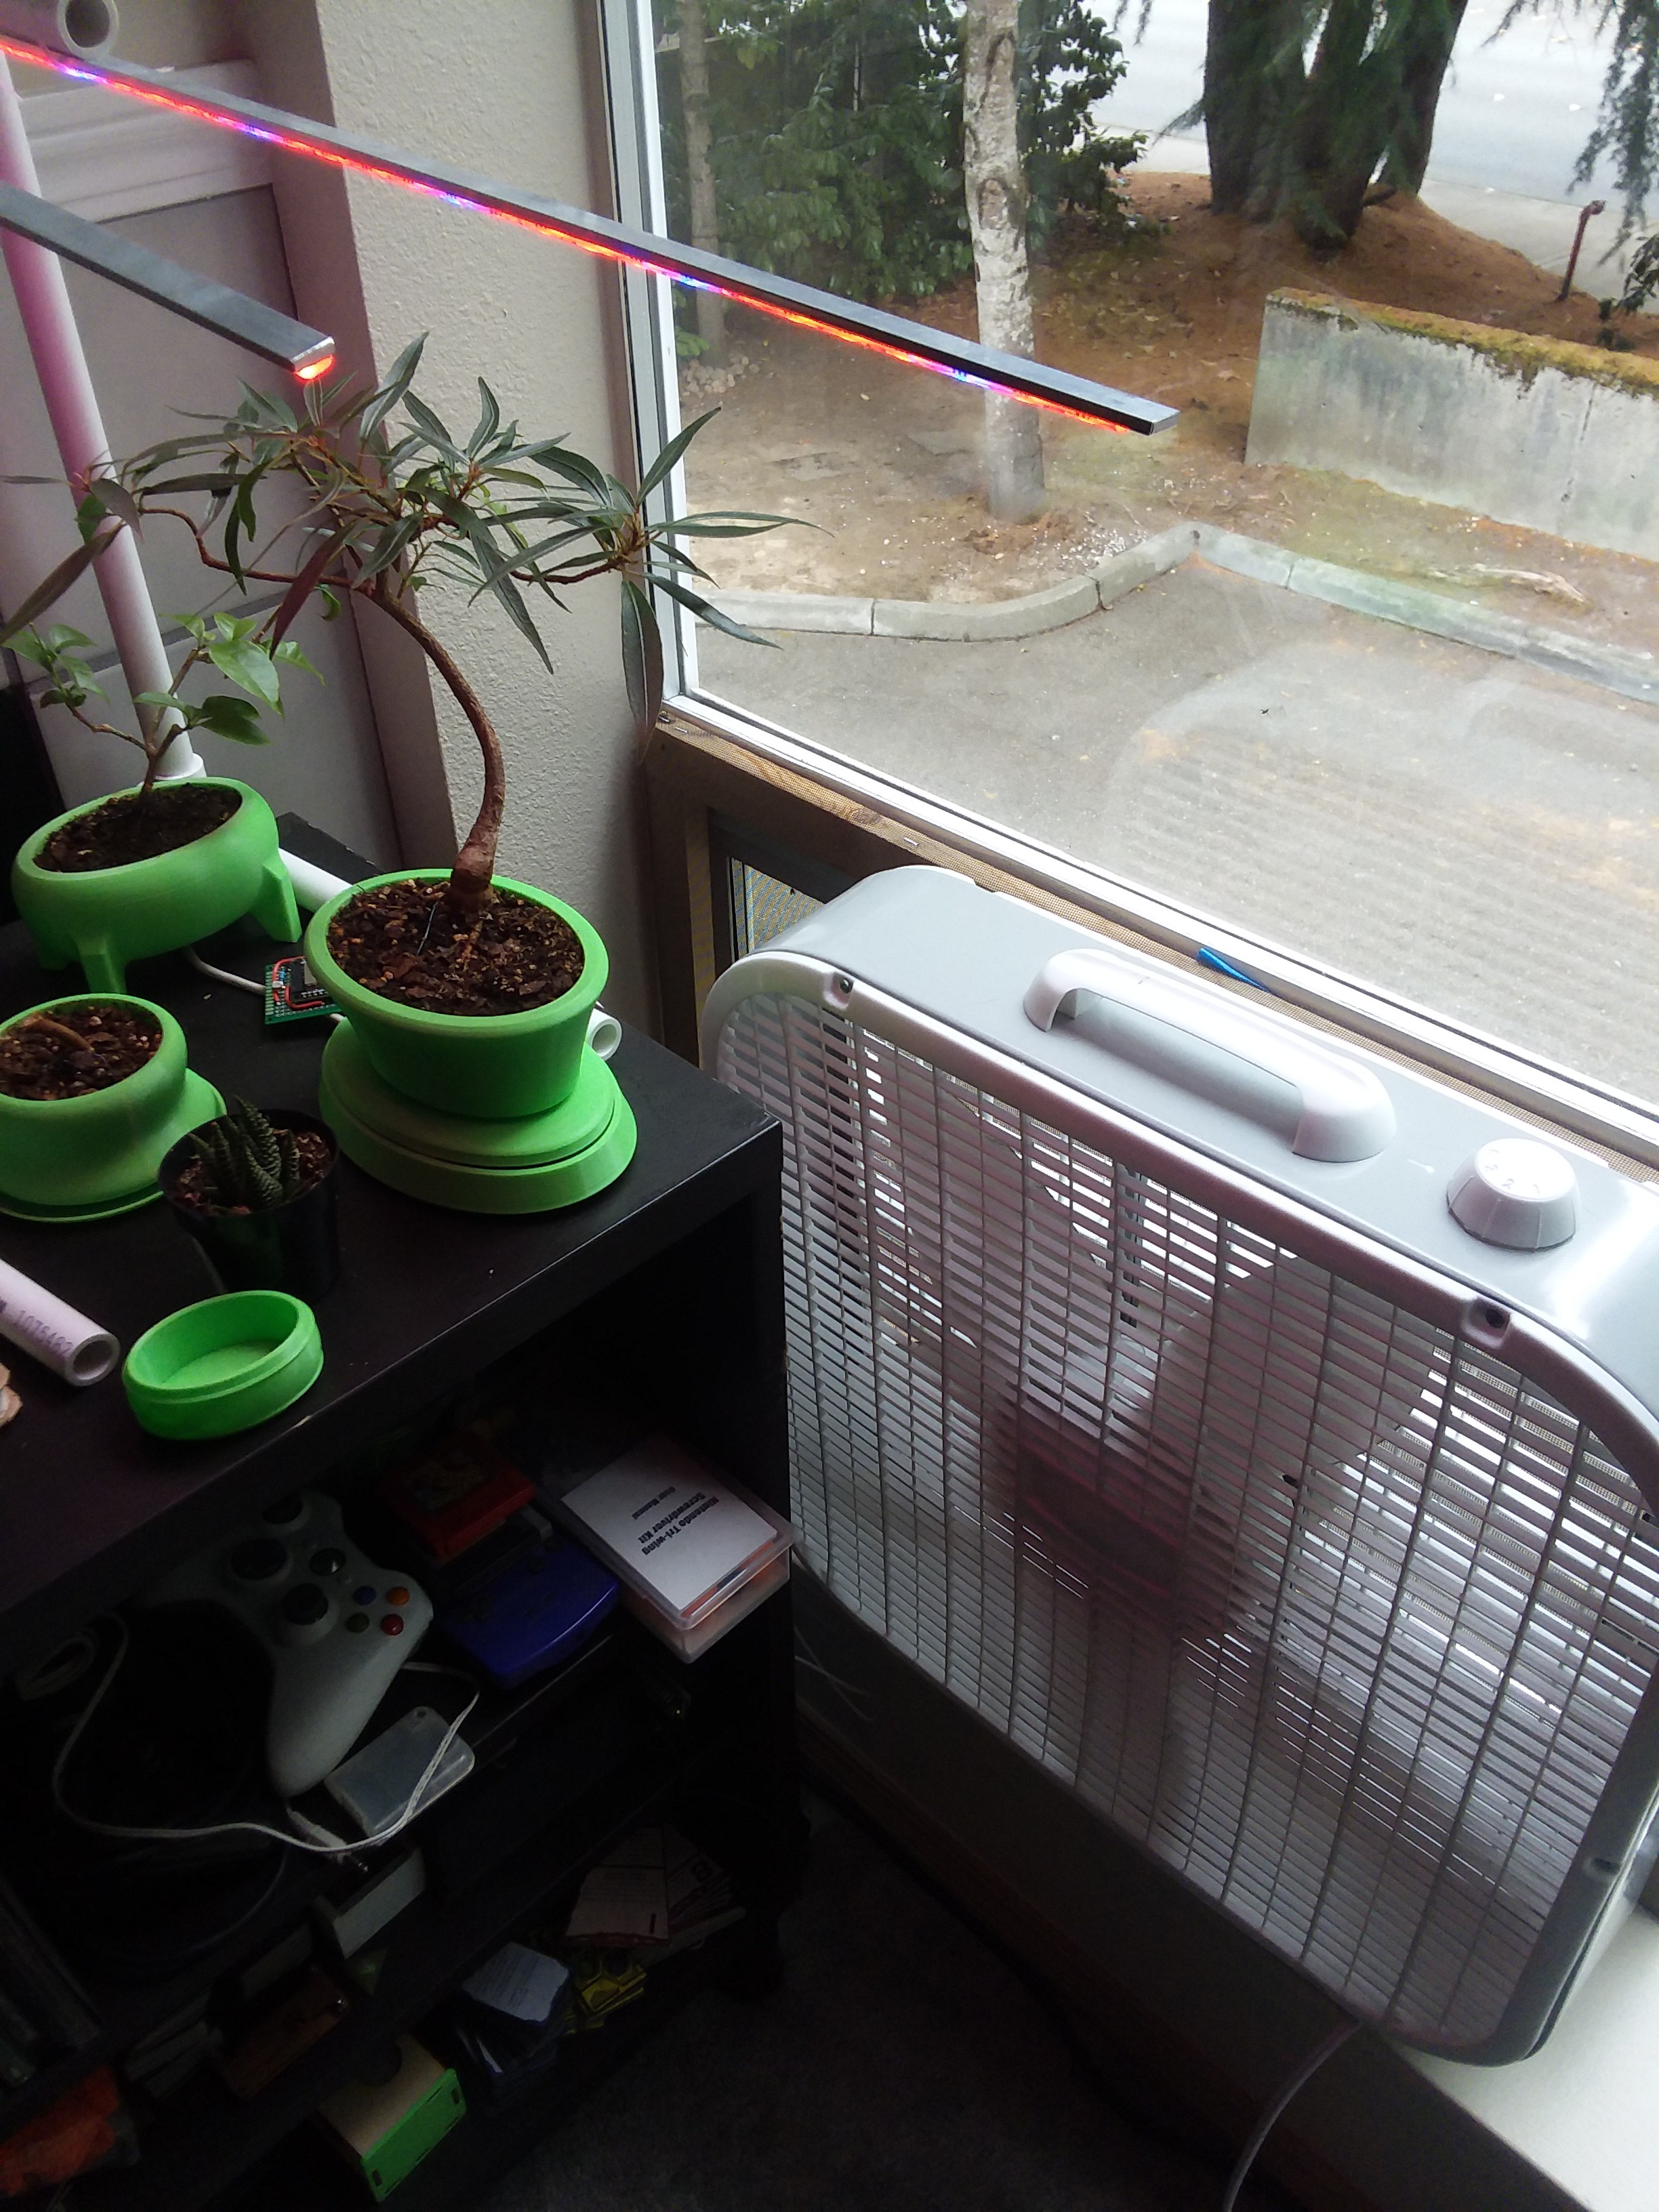
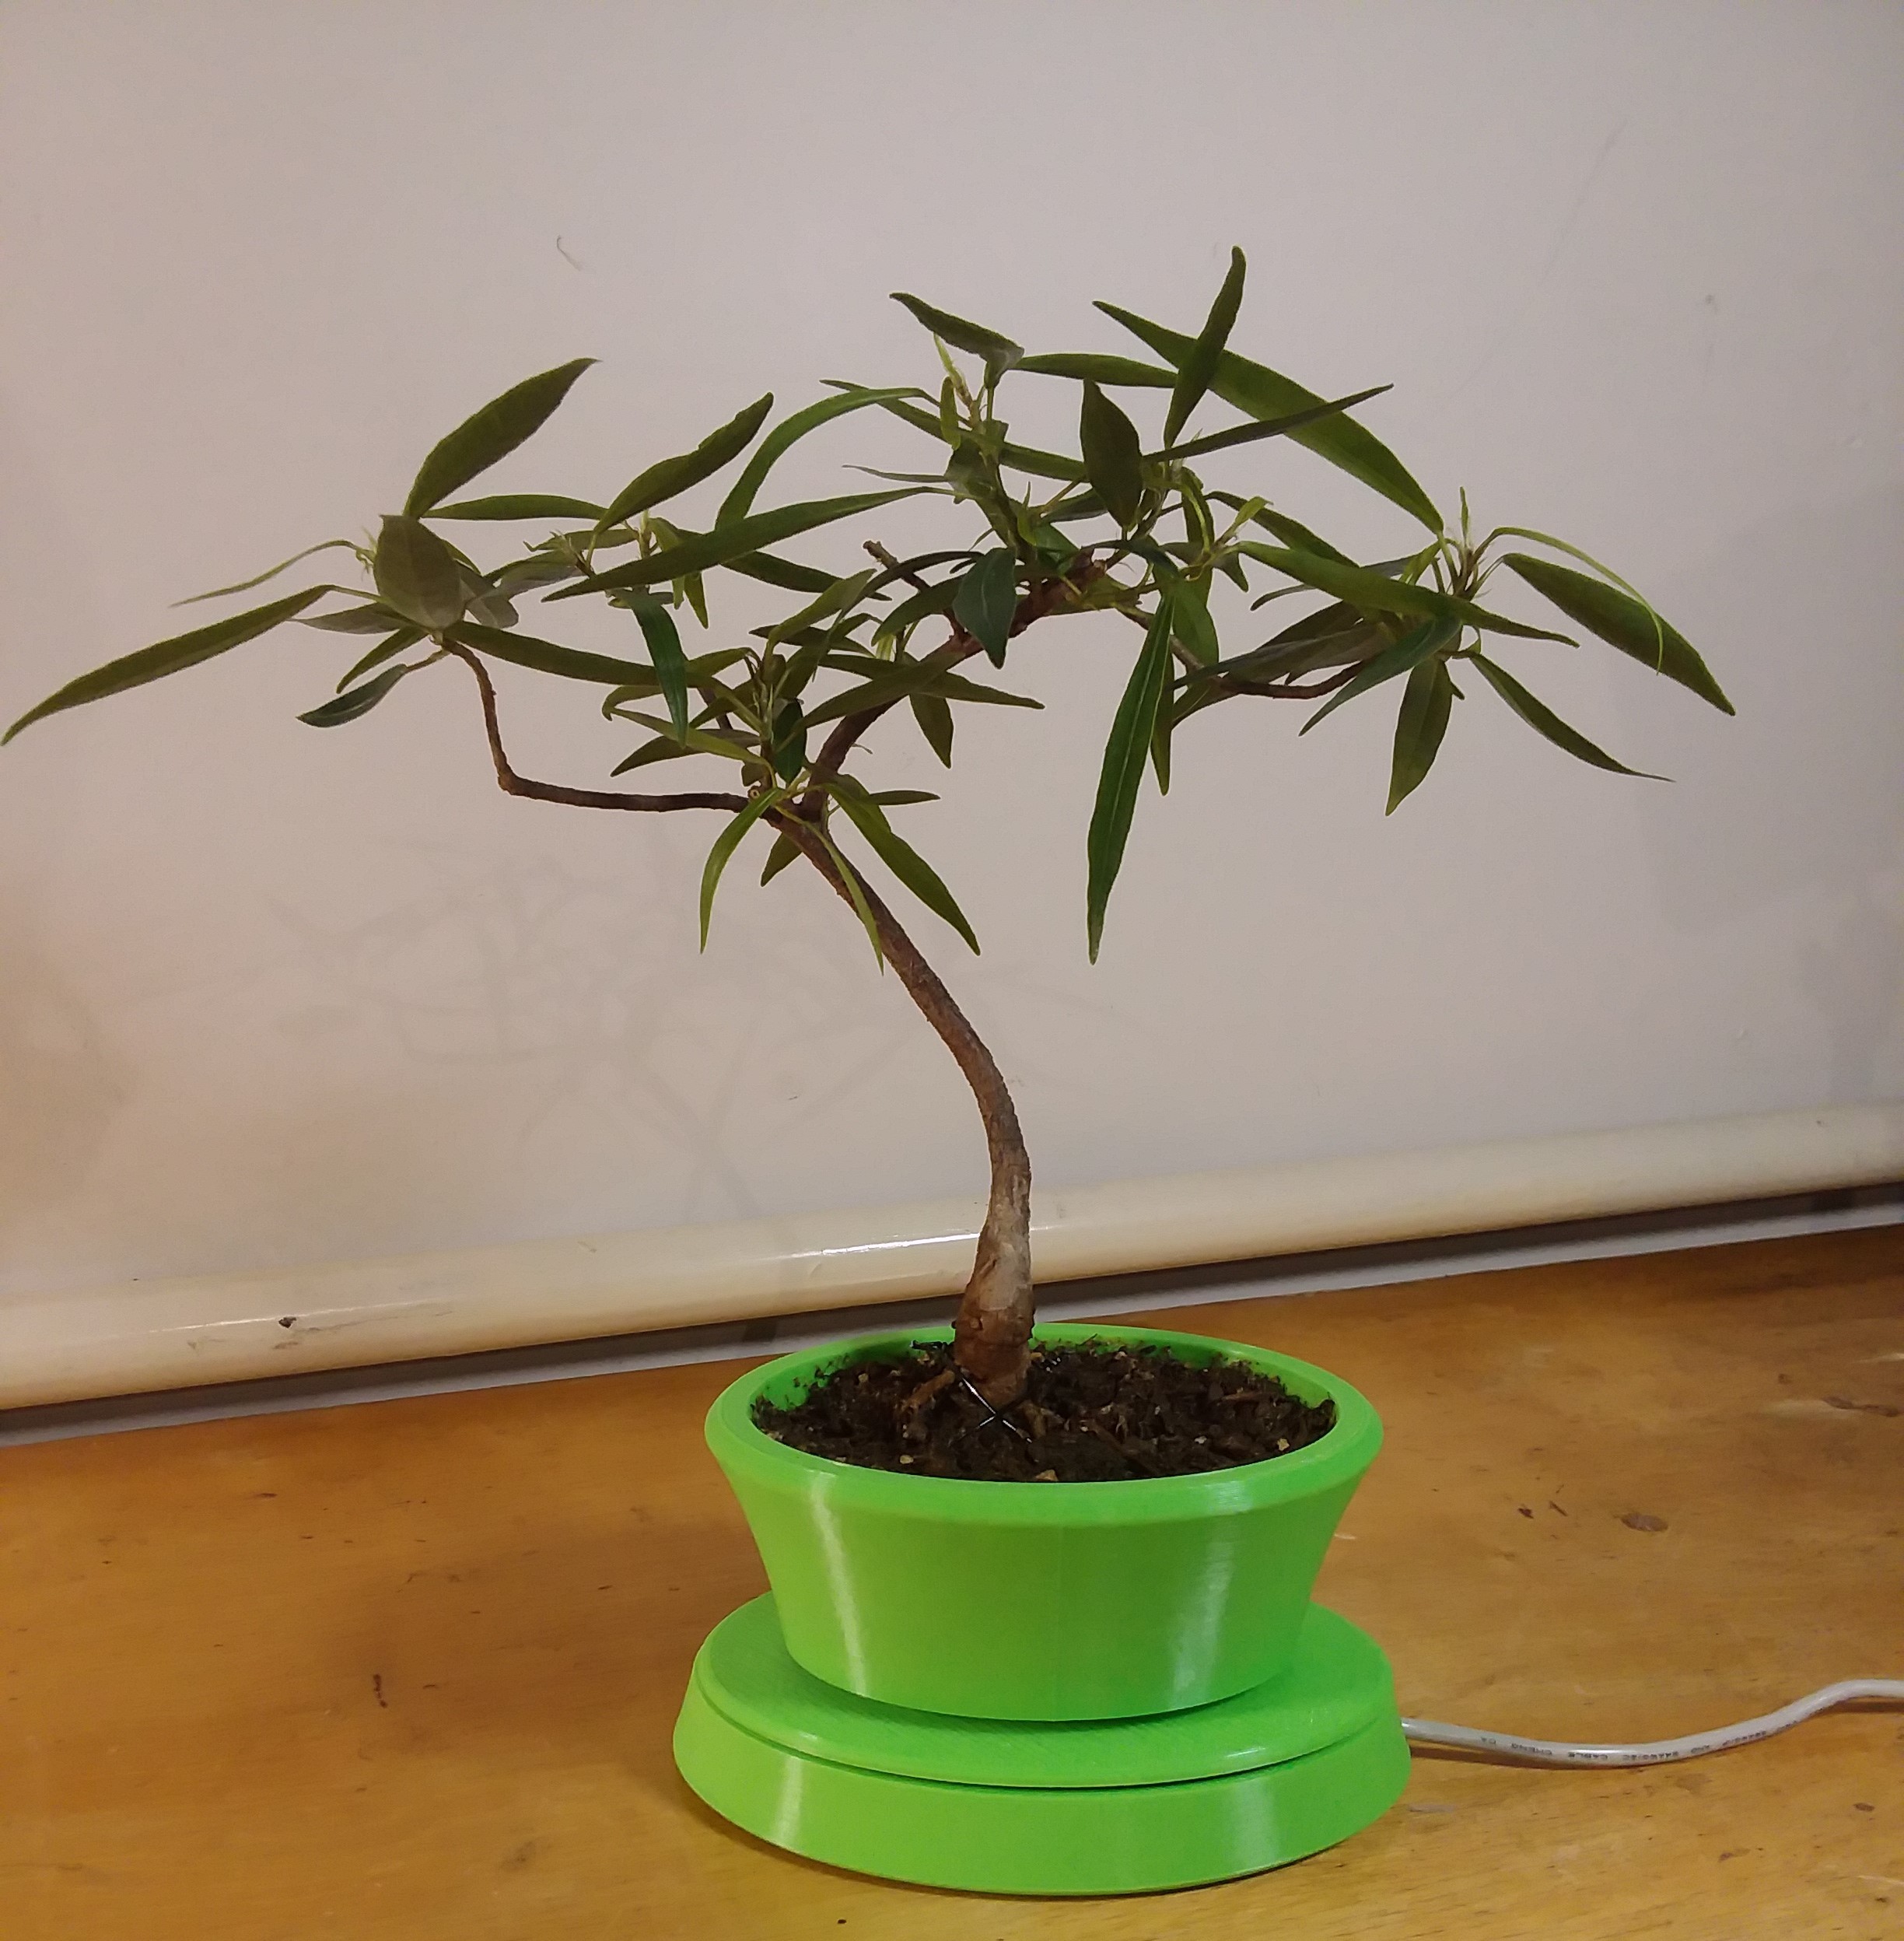
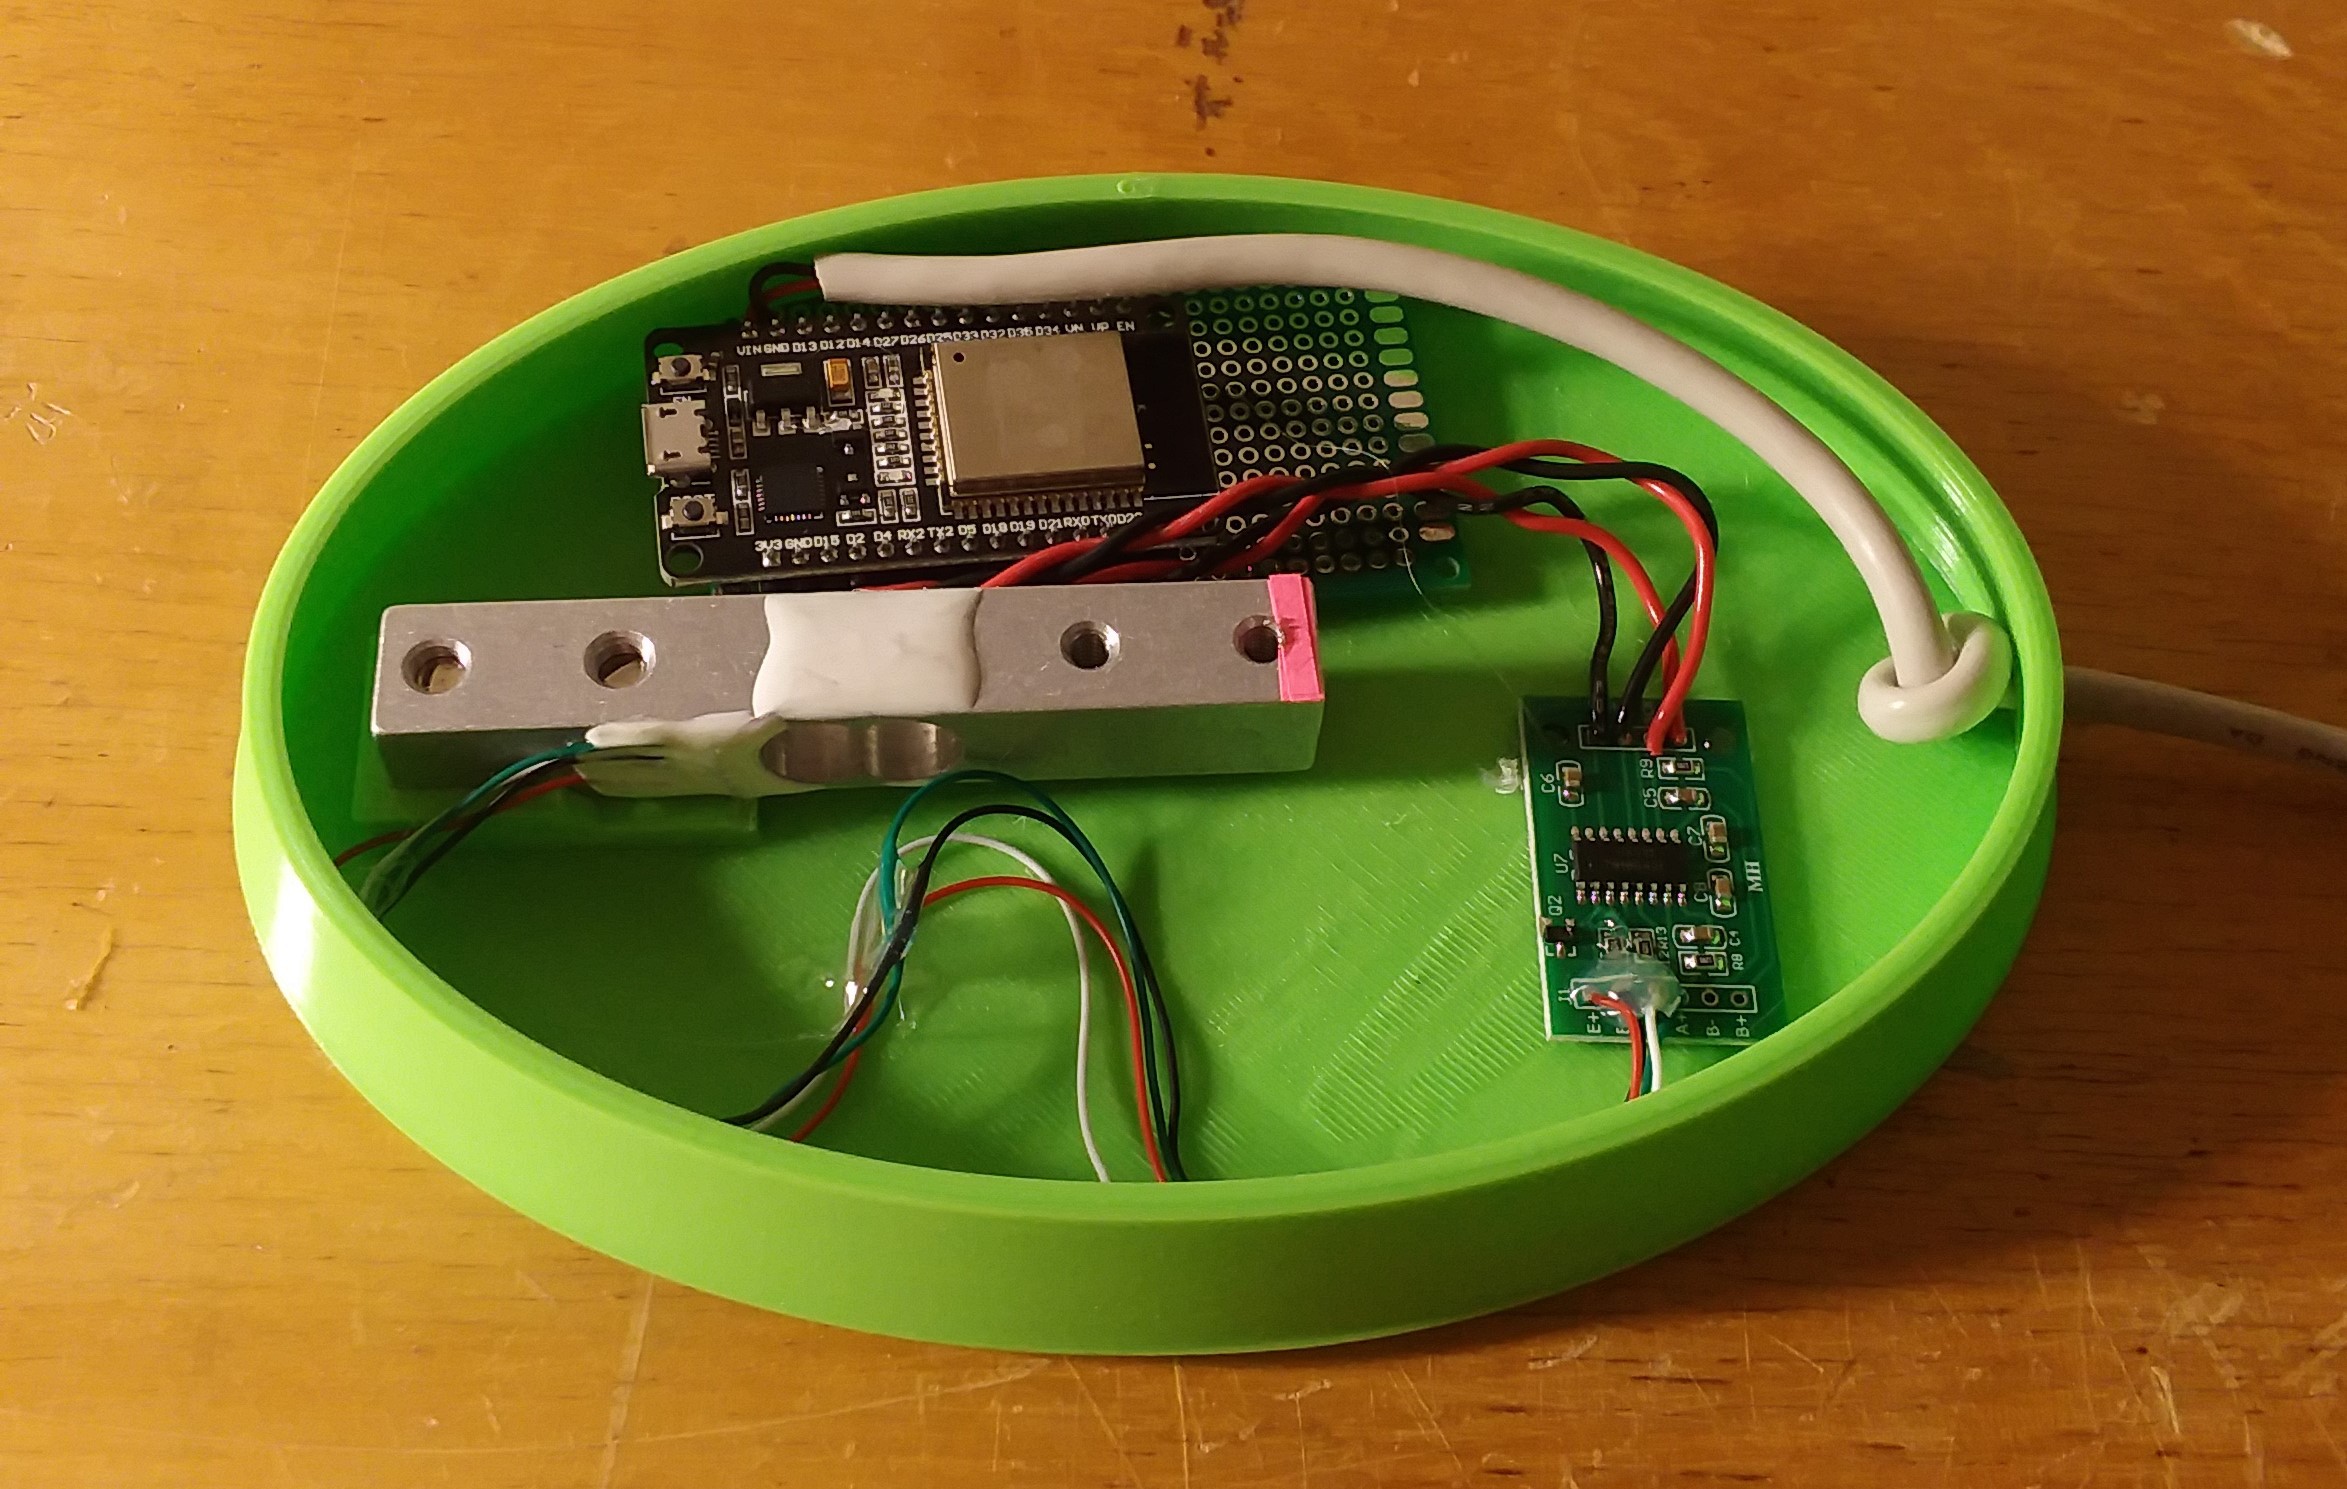
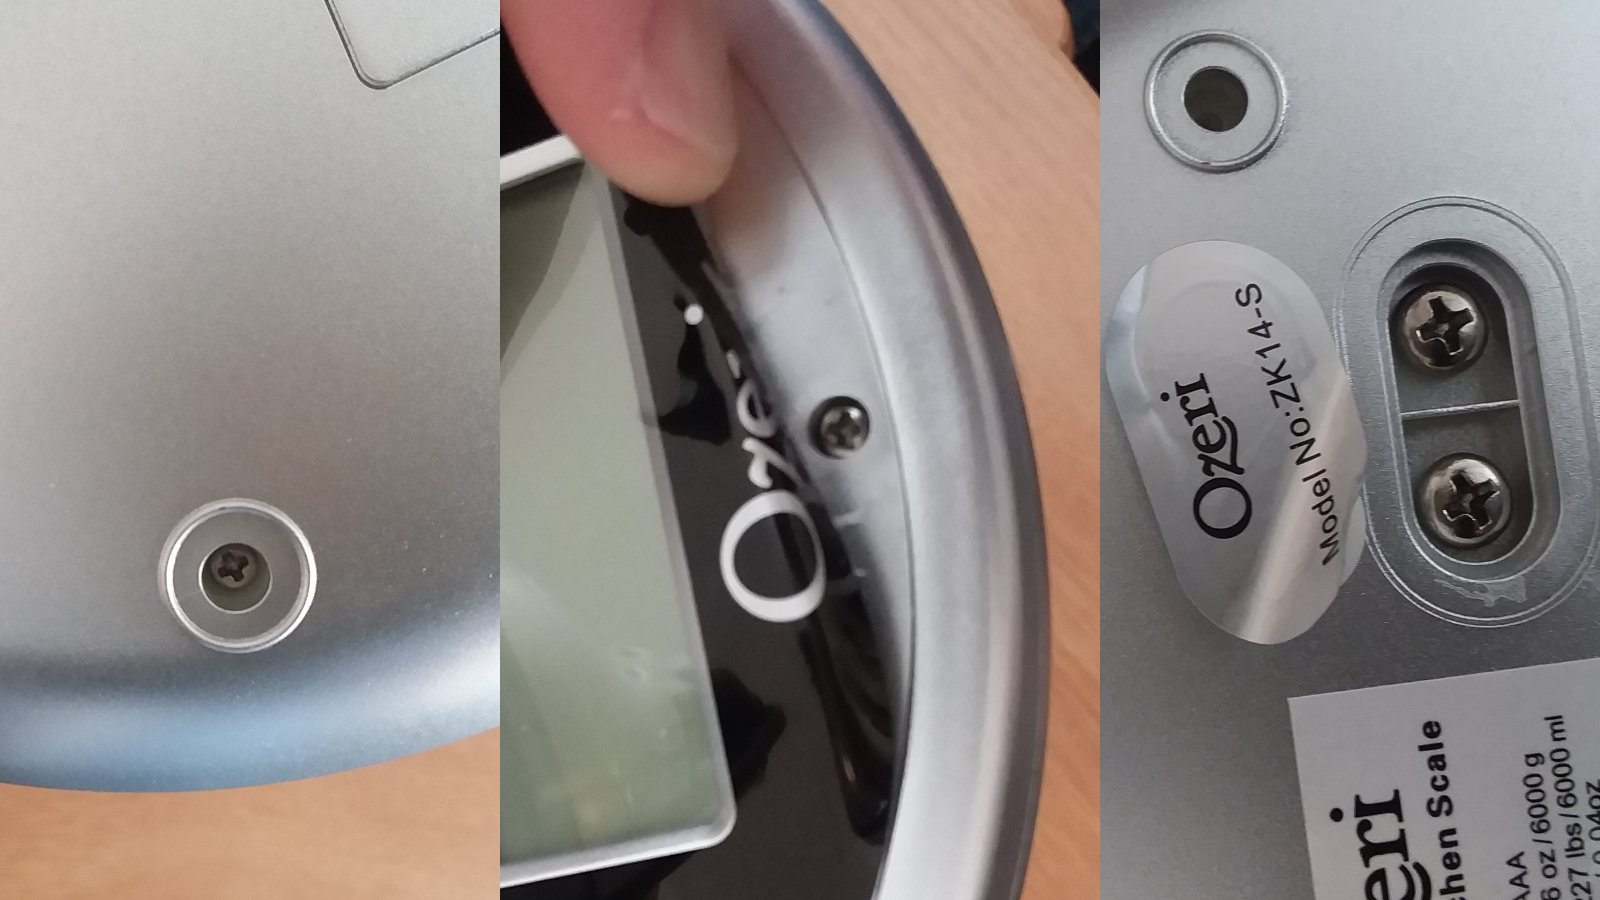
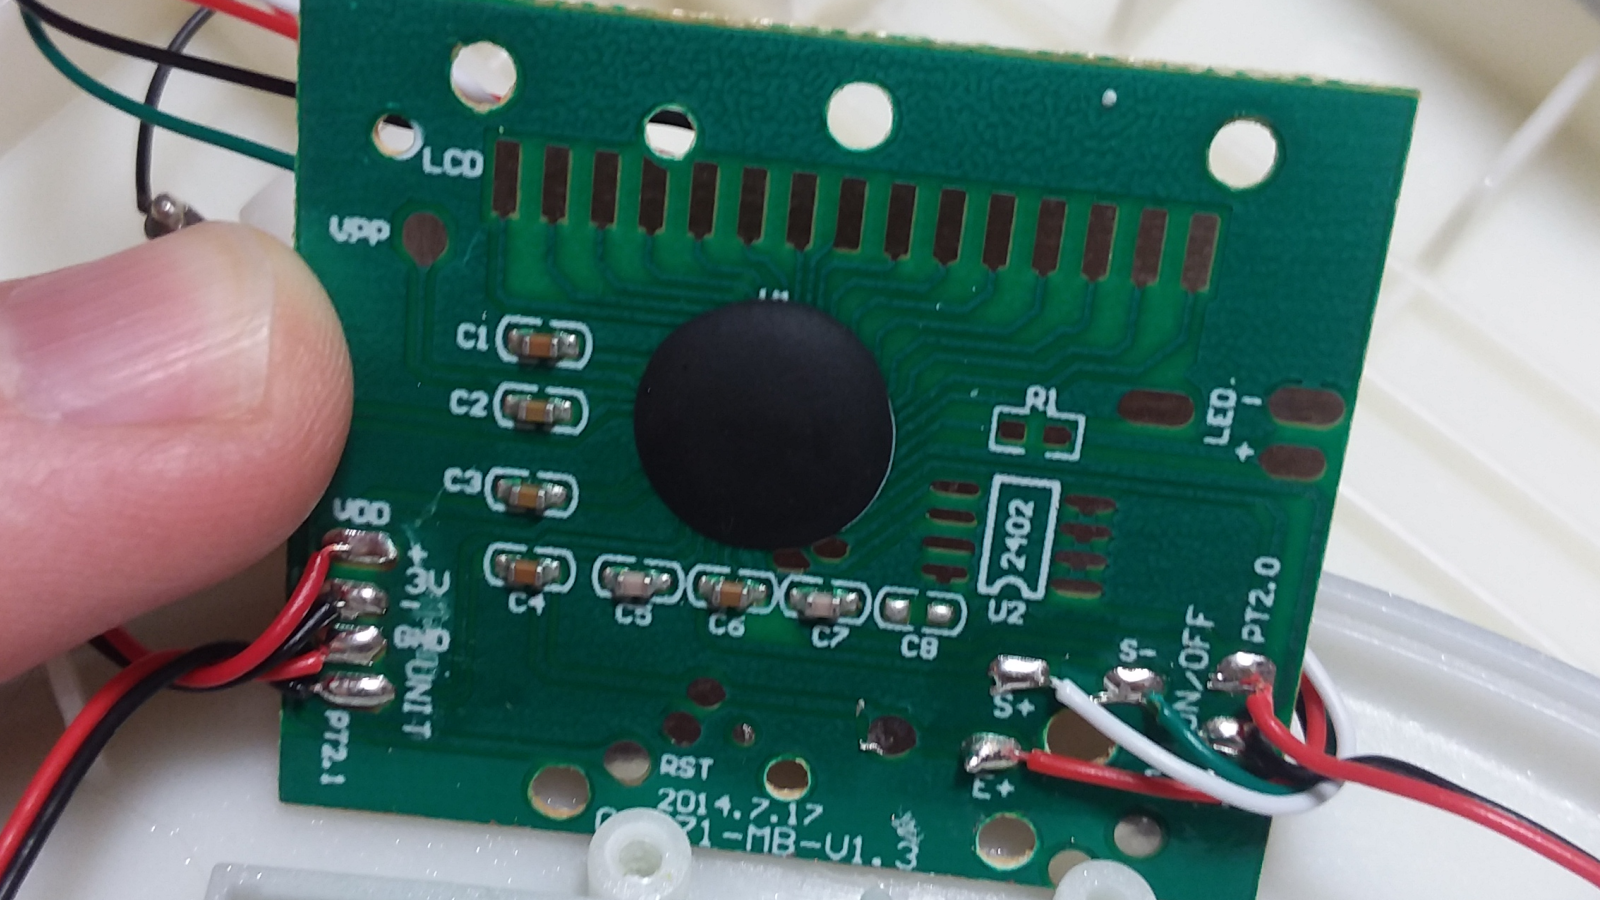
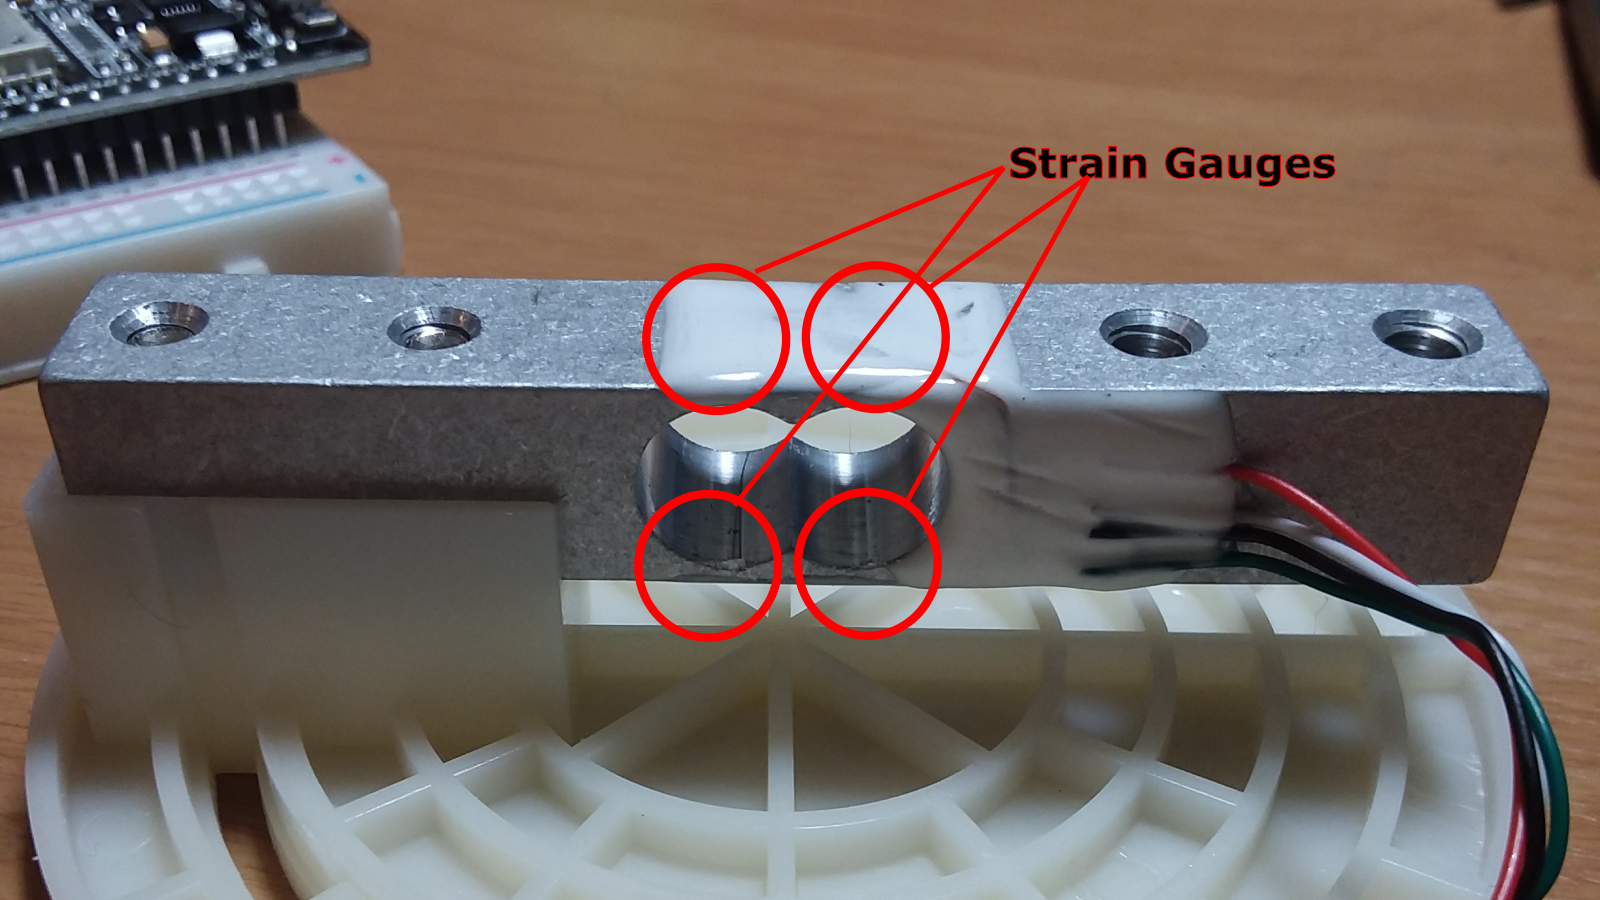
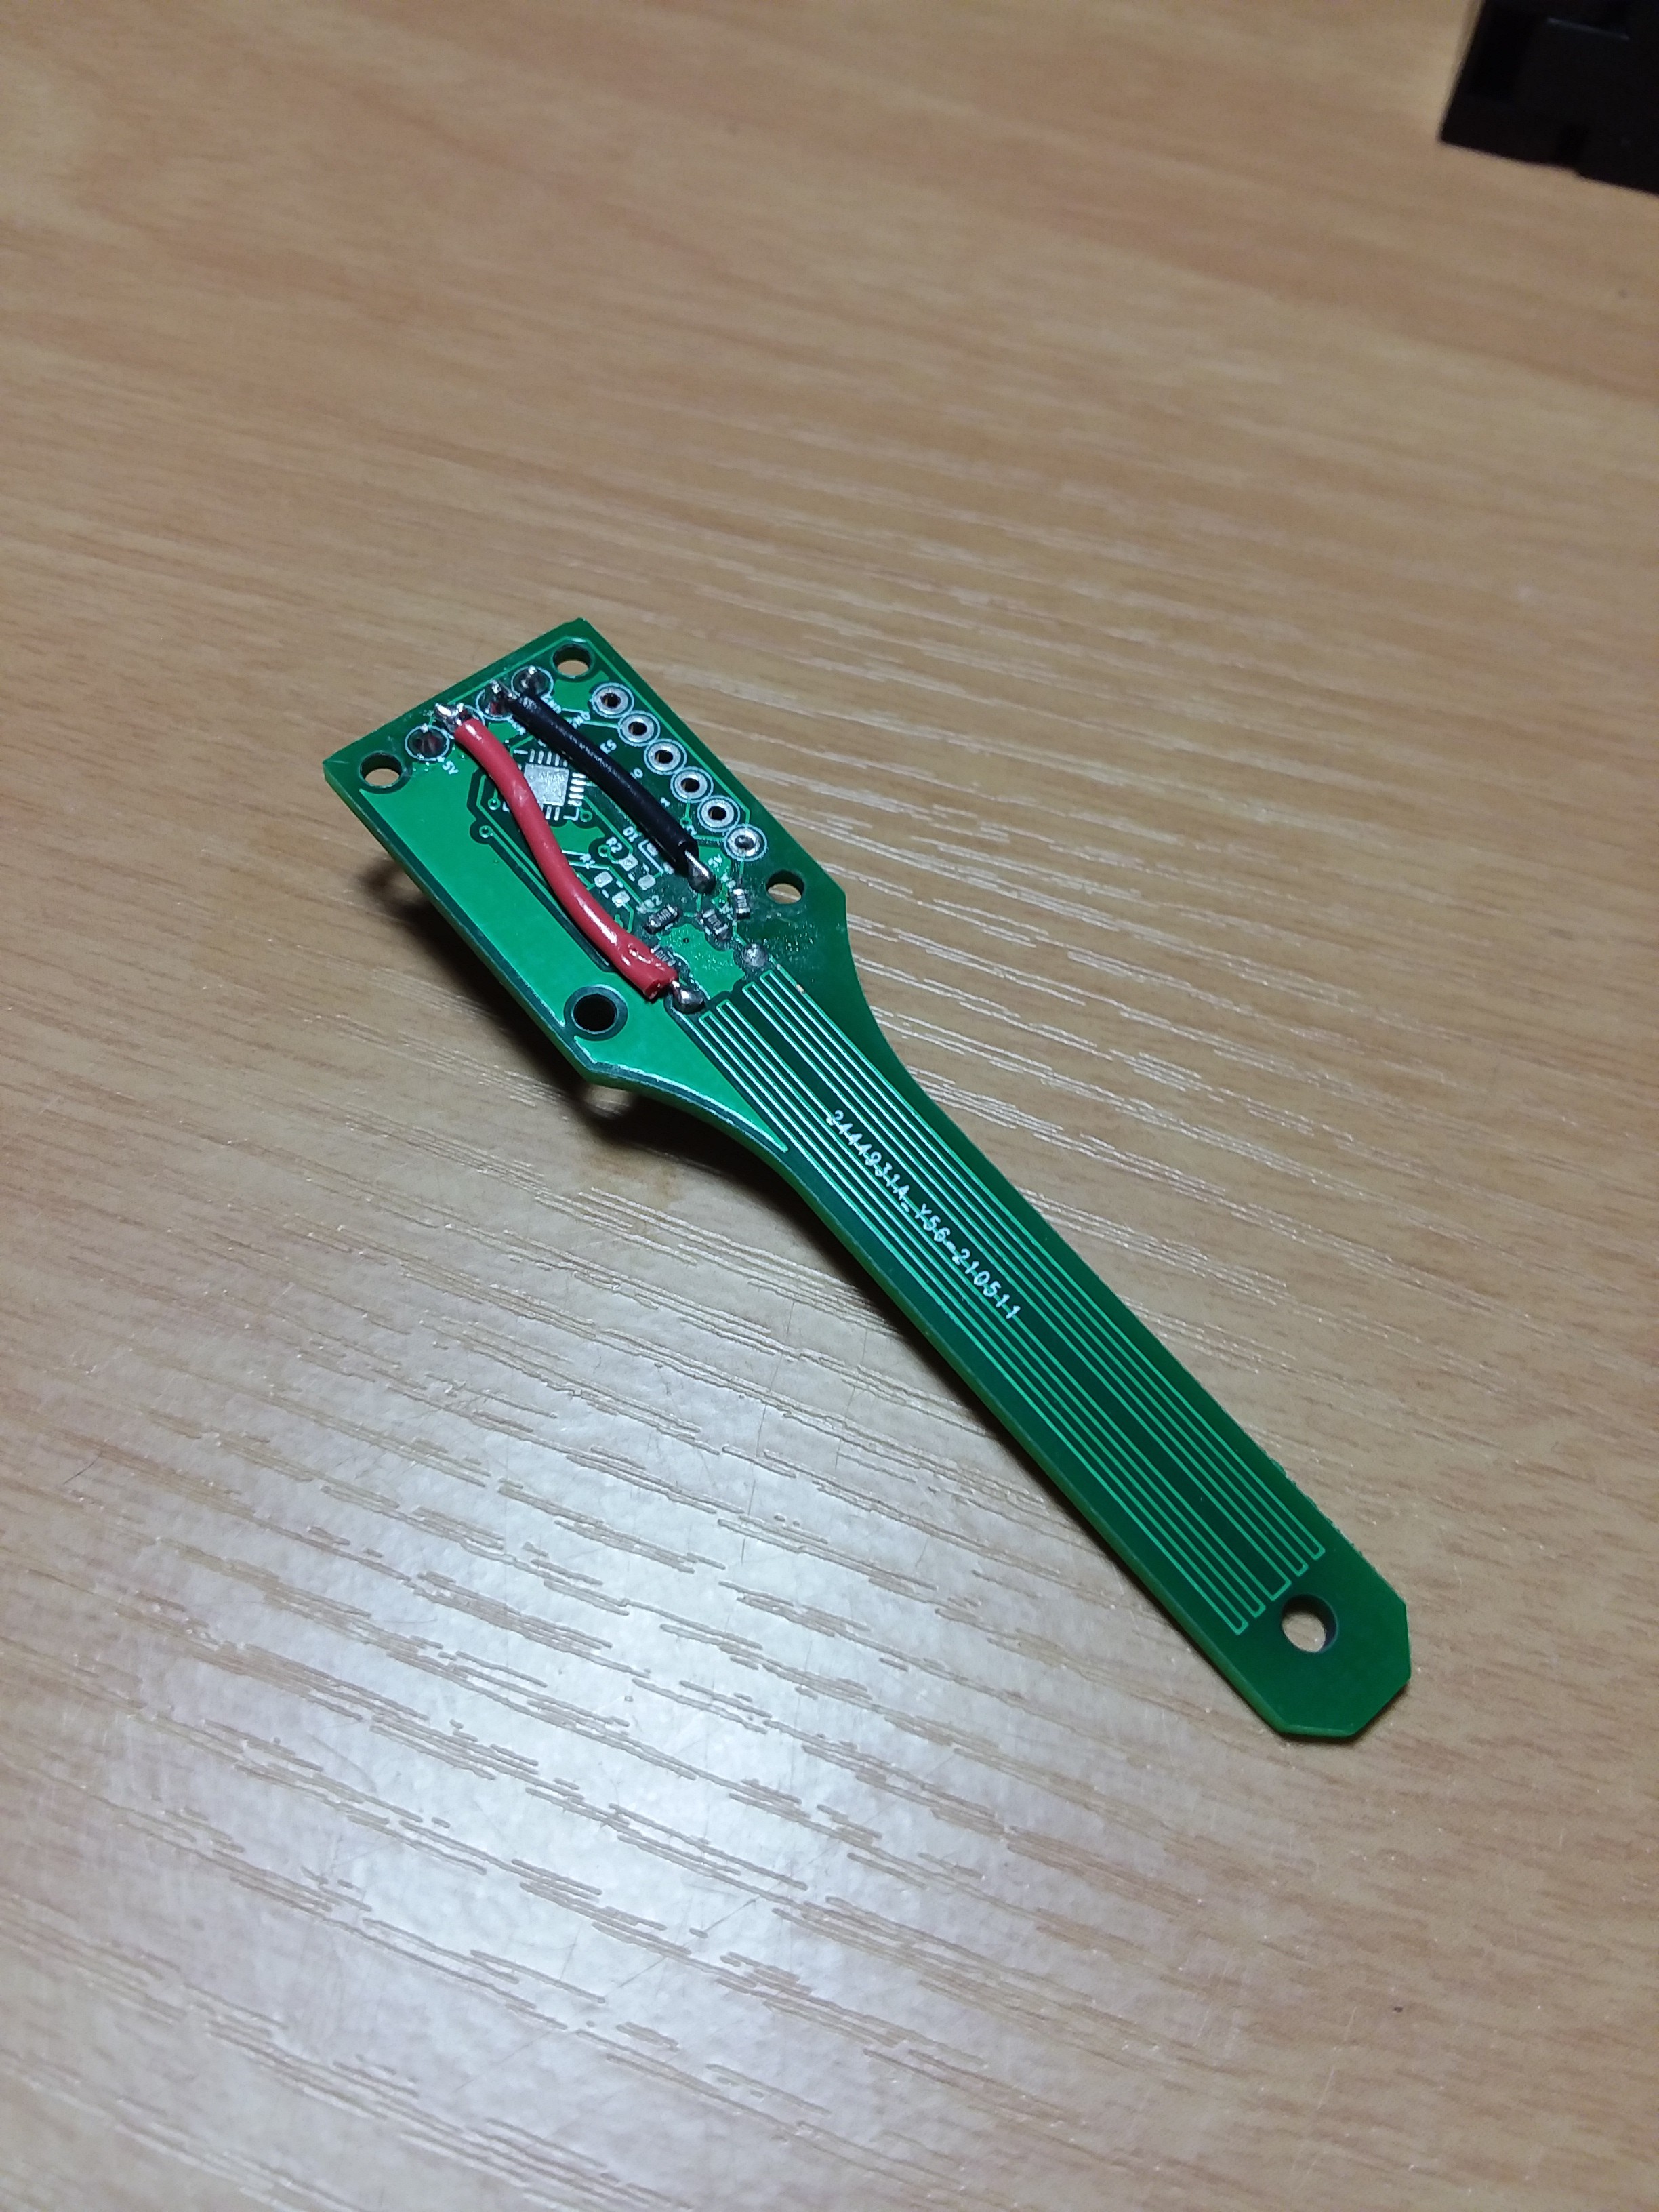
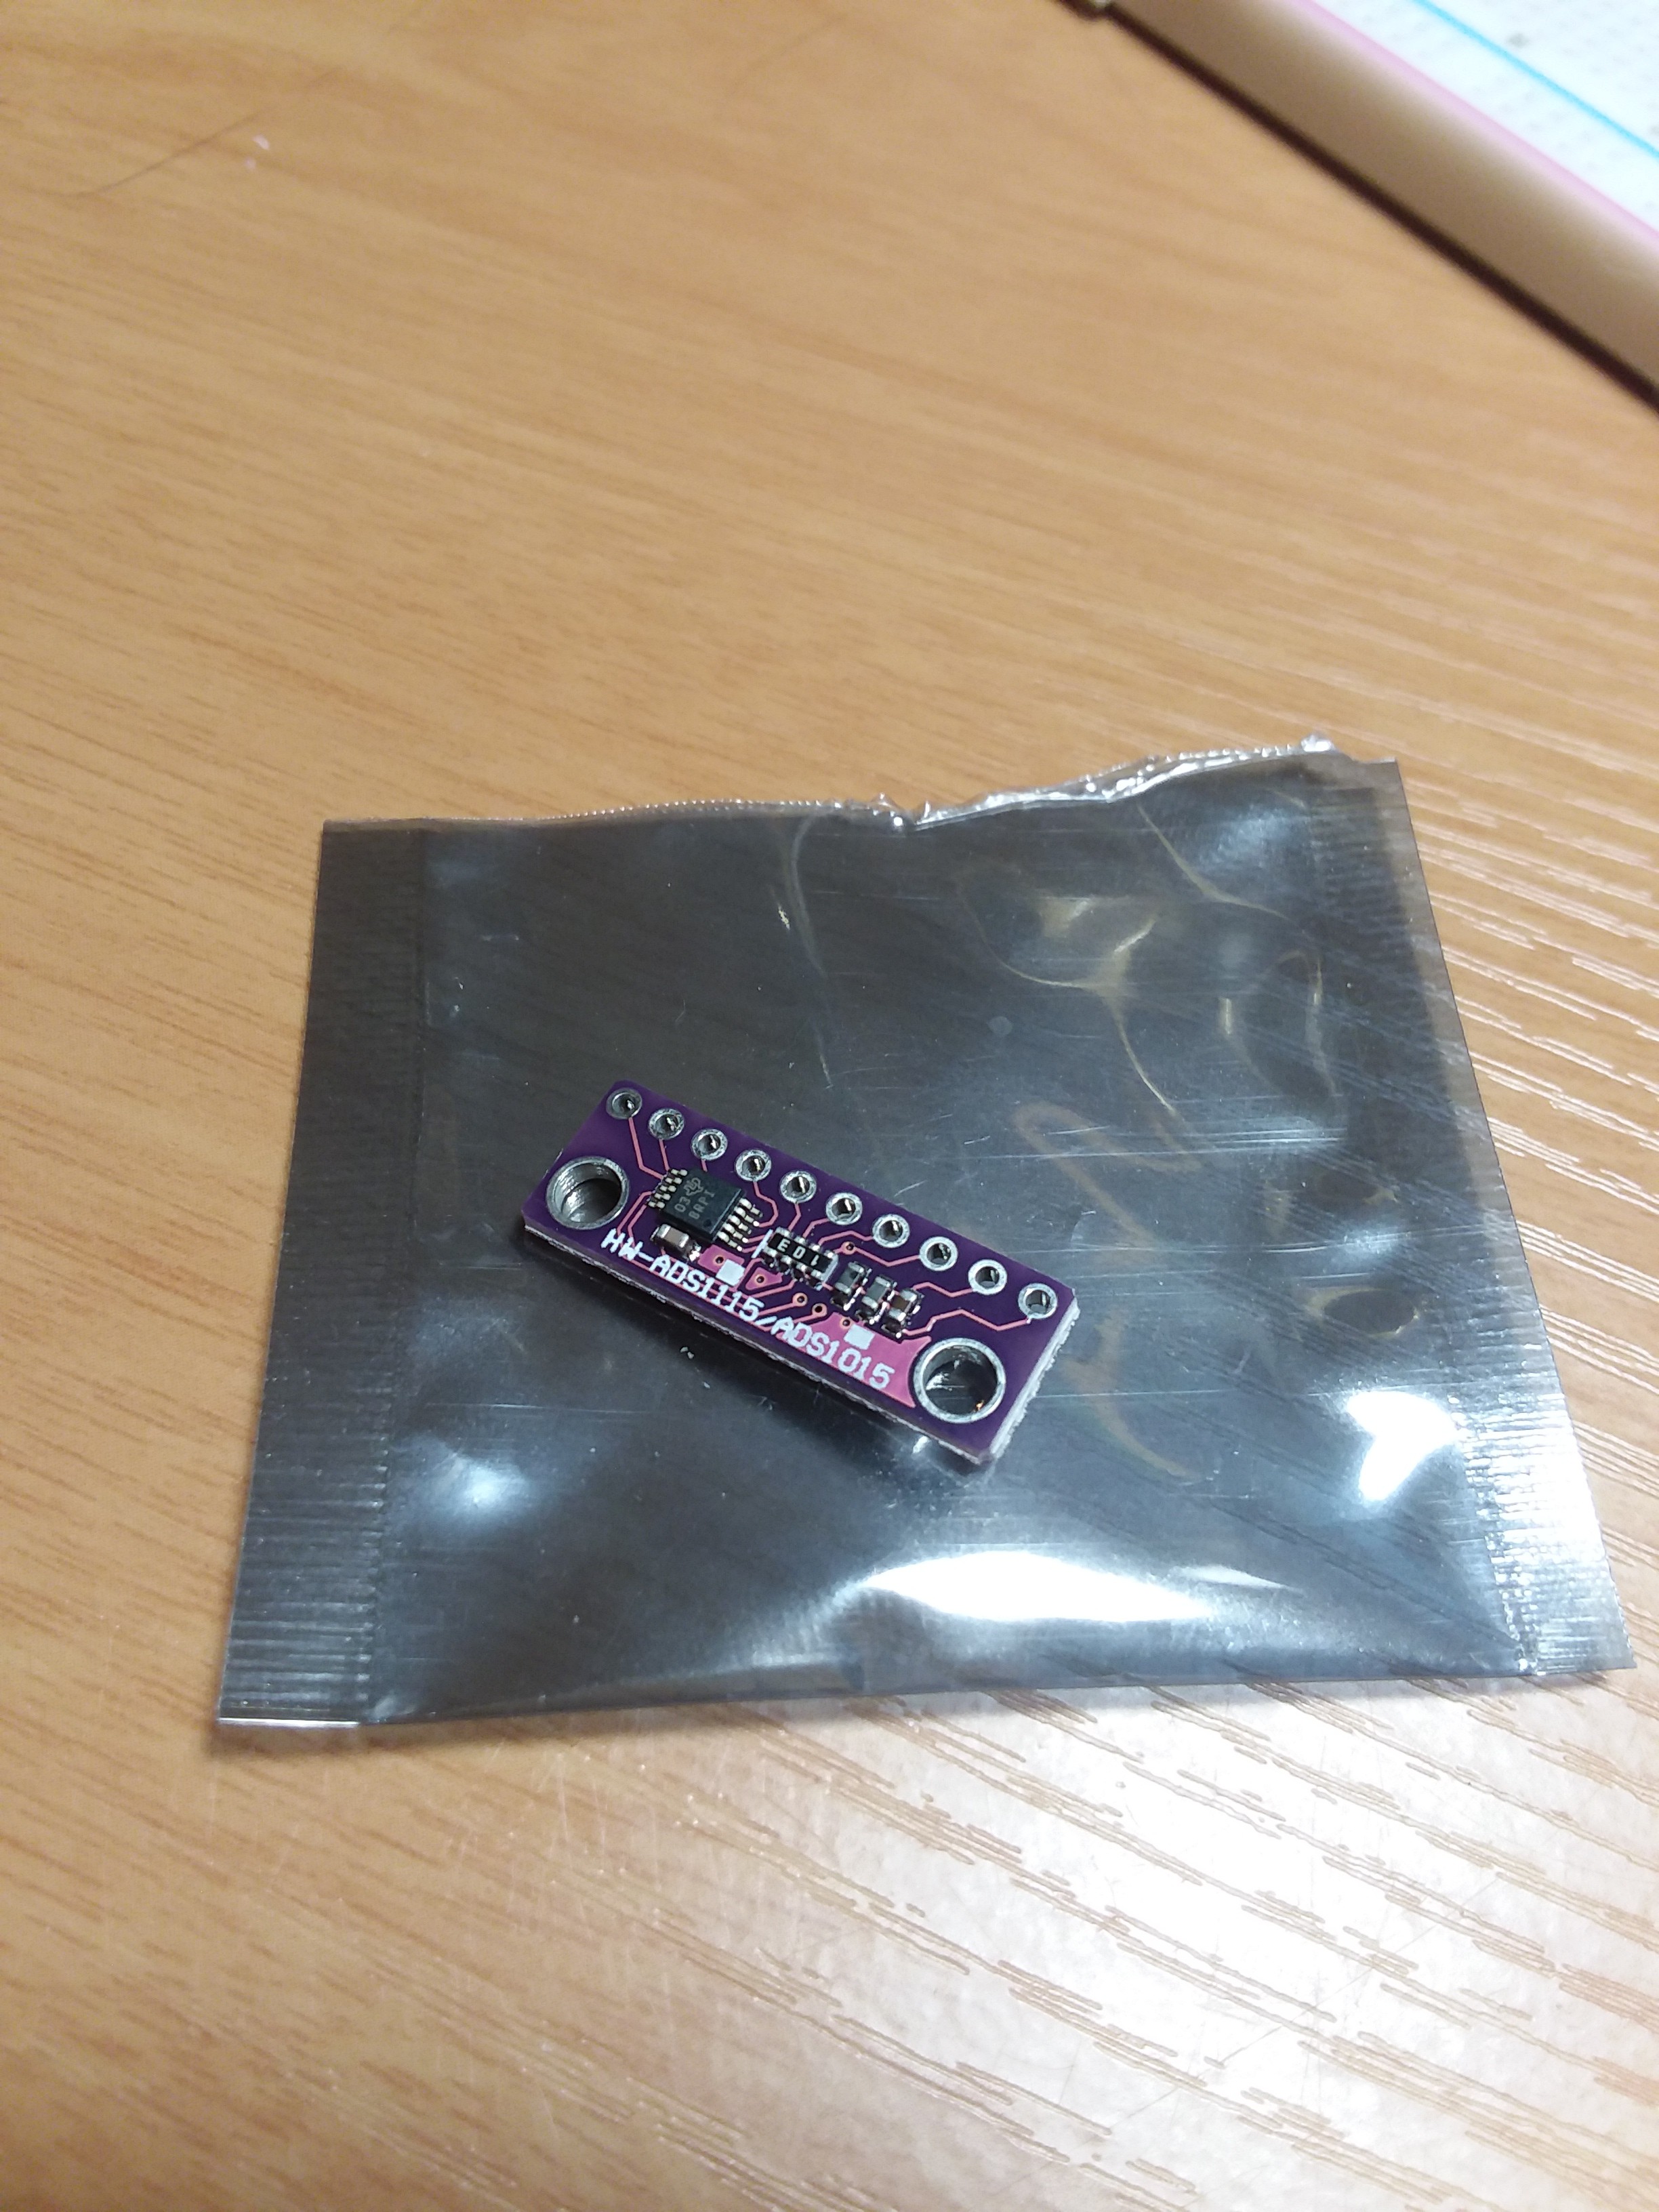
Currently working on a more off-the-shelf solution to weighing my plants in situ with a commercial load cell.
0%
0%
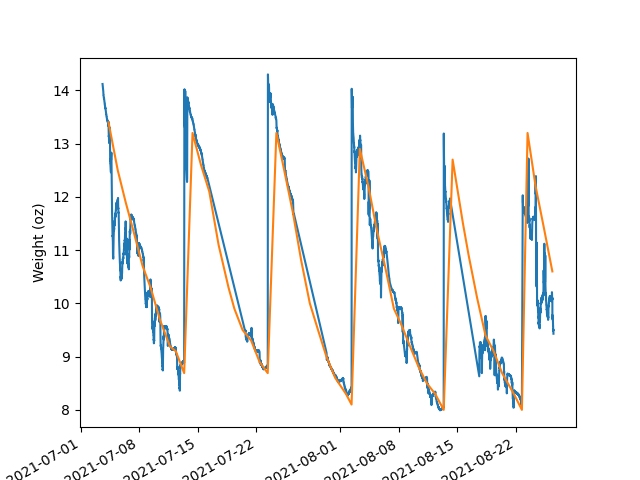
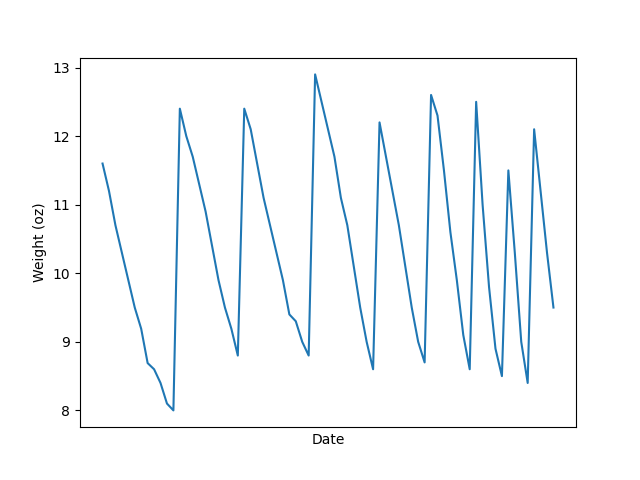
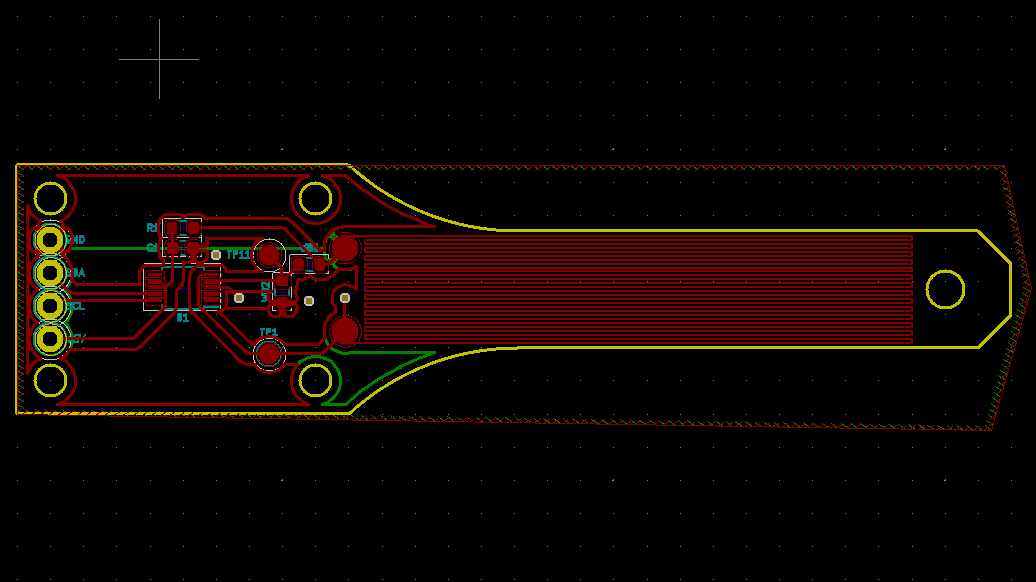
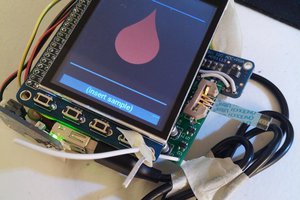
Weighing Plants
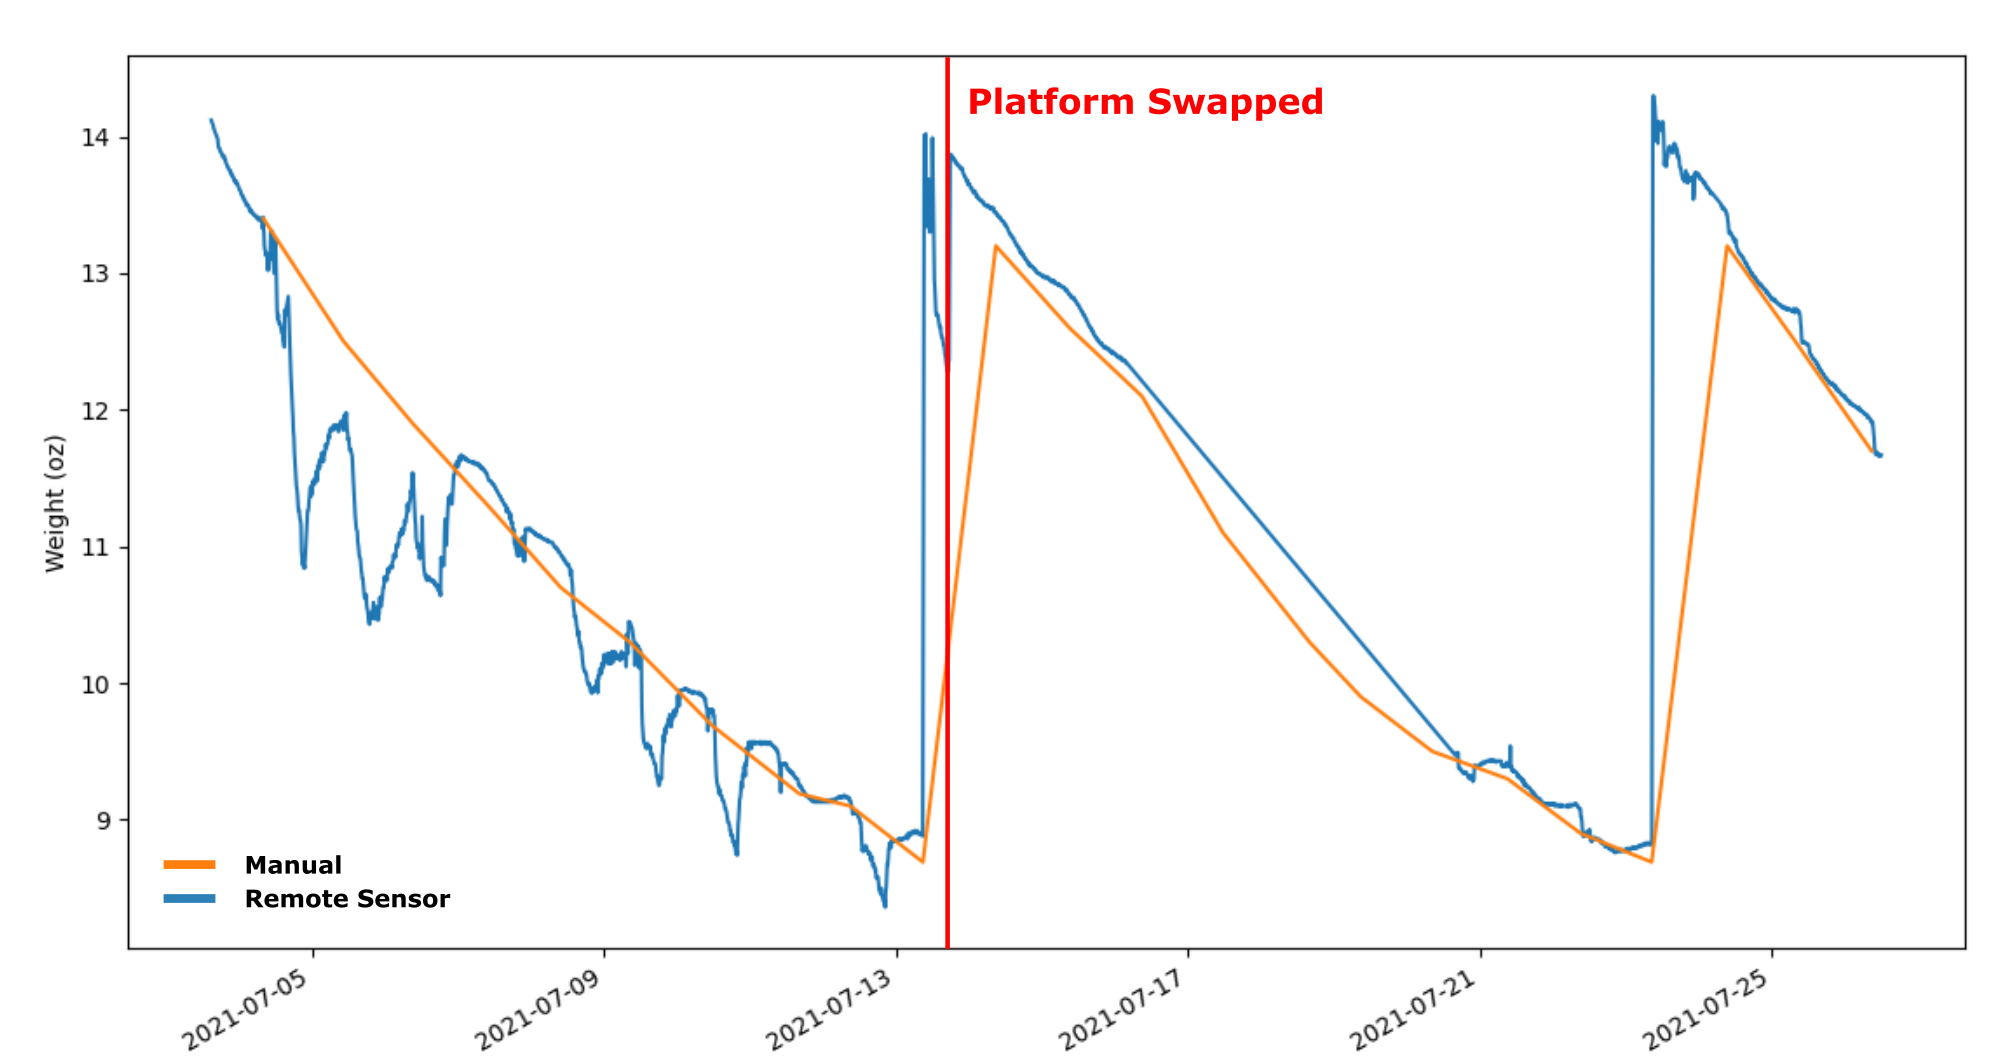
Tracking plant health through weight
Become a Hackaday.io member
Already have an account? Log in.
Just one more thing
To make the experience fit your profile, pick a username and tell us what interests you.
Pick an awesome username
hackaday.io/
Your profile's URL: hackaday.io/username. Max 25 alphanumeric characters.
Pick a few interests
Projects that share your interests
People that share your interests


 Jonathan Buchanan
 Max Kviatkouski
 sparks.ron
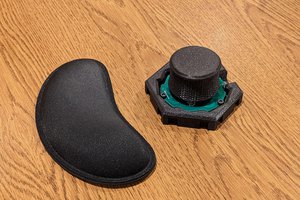
 colton.baldridge
Glad someone posted about the temp issue, found that the load sensors / ht711 also drift if read or under load for prolonged periods and the weight should be removed occasionally. Led me to think of some similar pot weighing madness but maybe with a servo operated shim/wedge to lift it the tiniest bit and take the weight off of the scales/load-cell