 Kevin Arne
Weighing plants for better plant health is a nice idea in the abstract, but I was really motivated by one plant in particular. This willow leaf ficus:
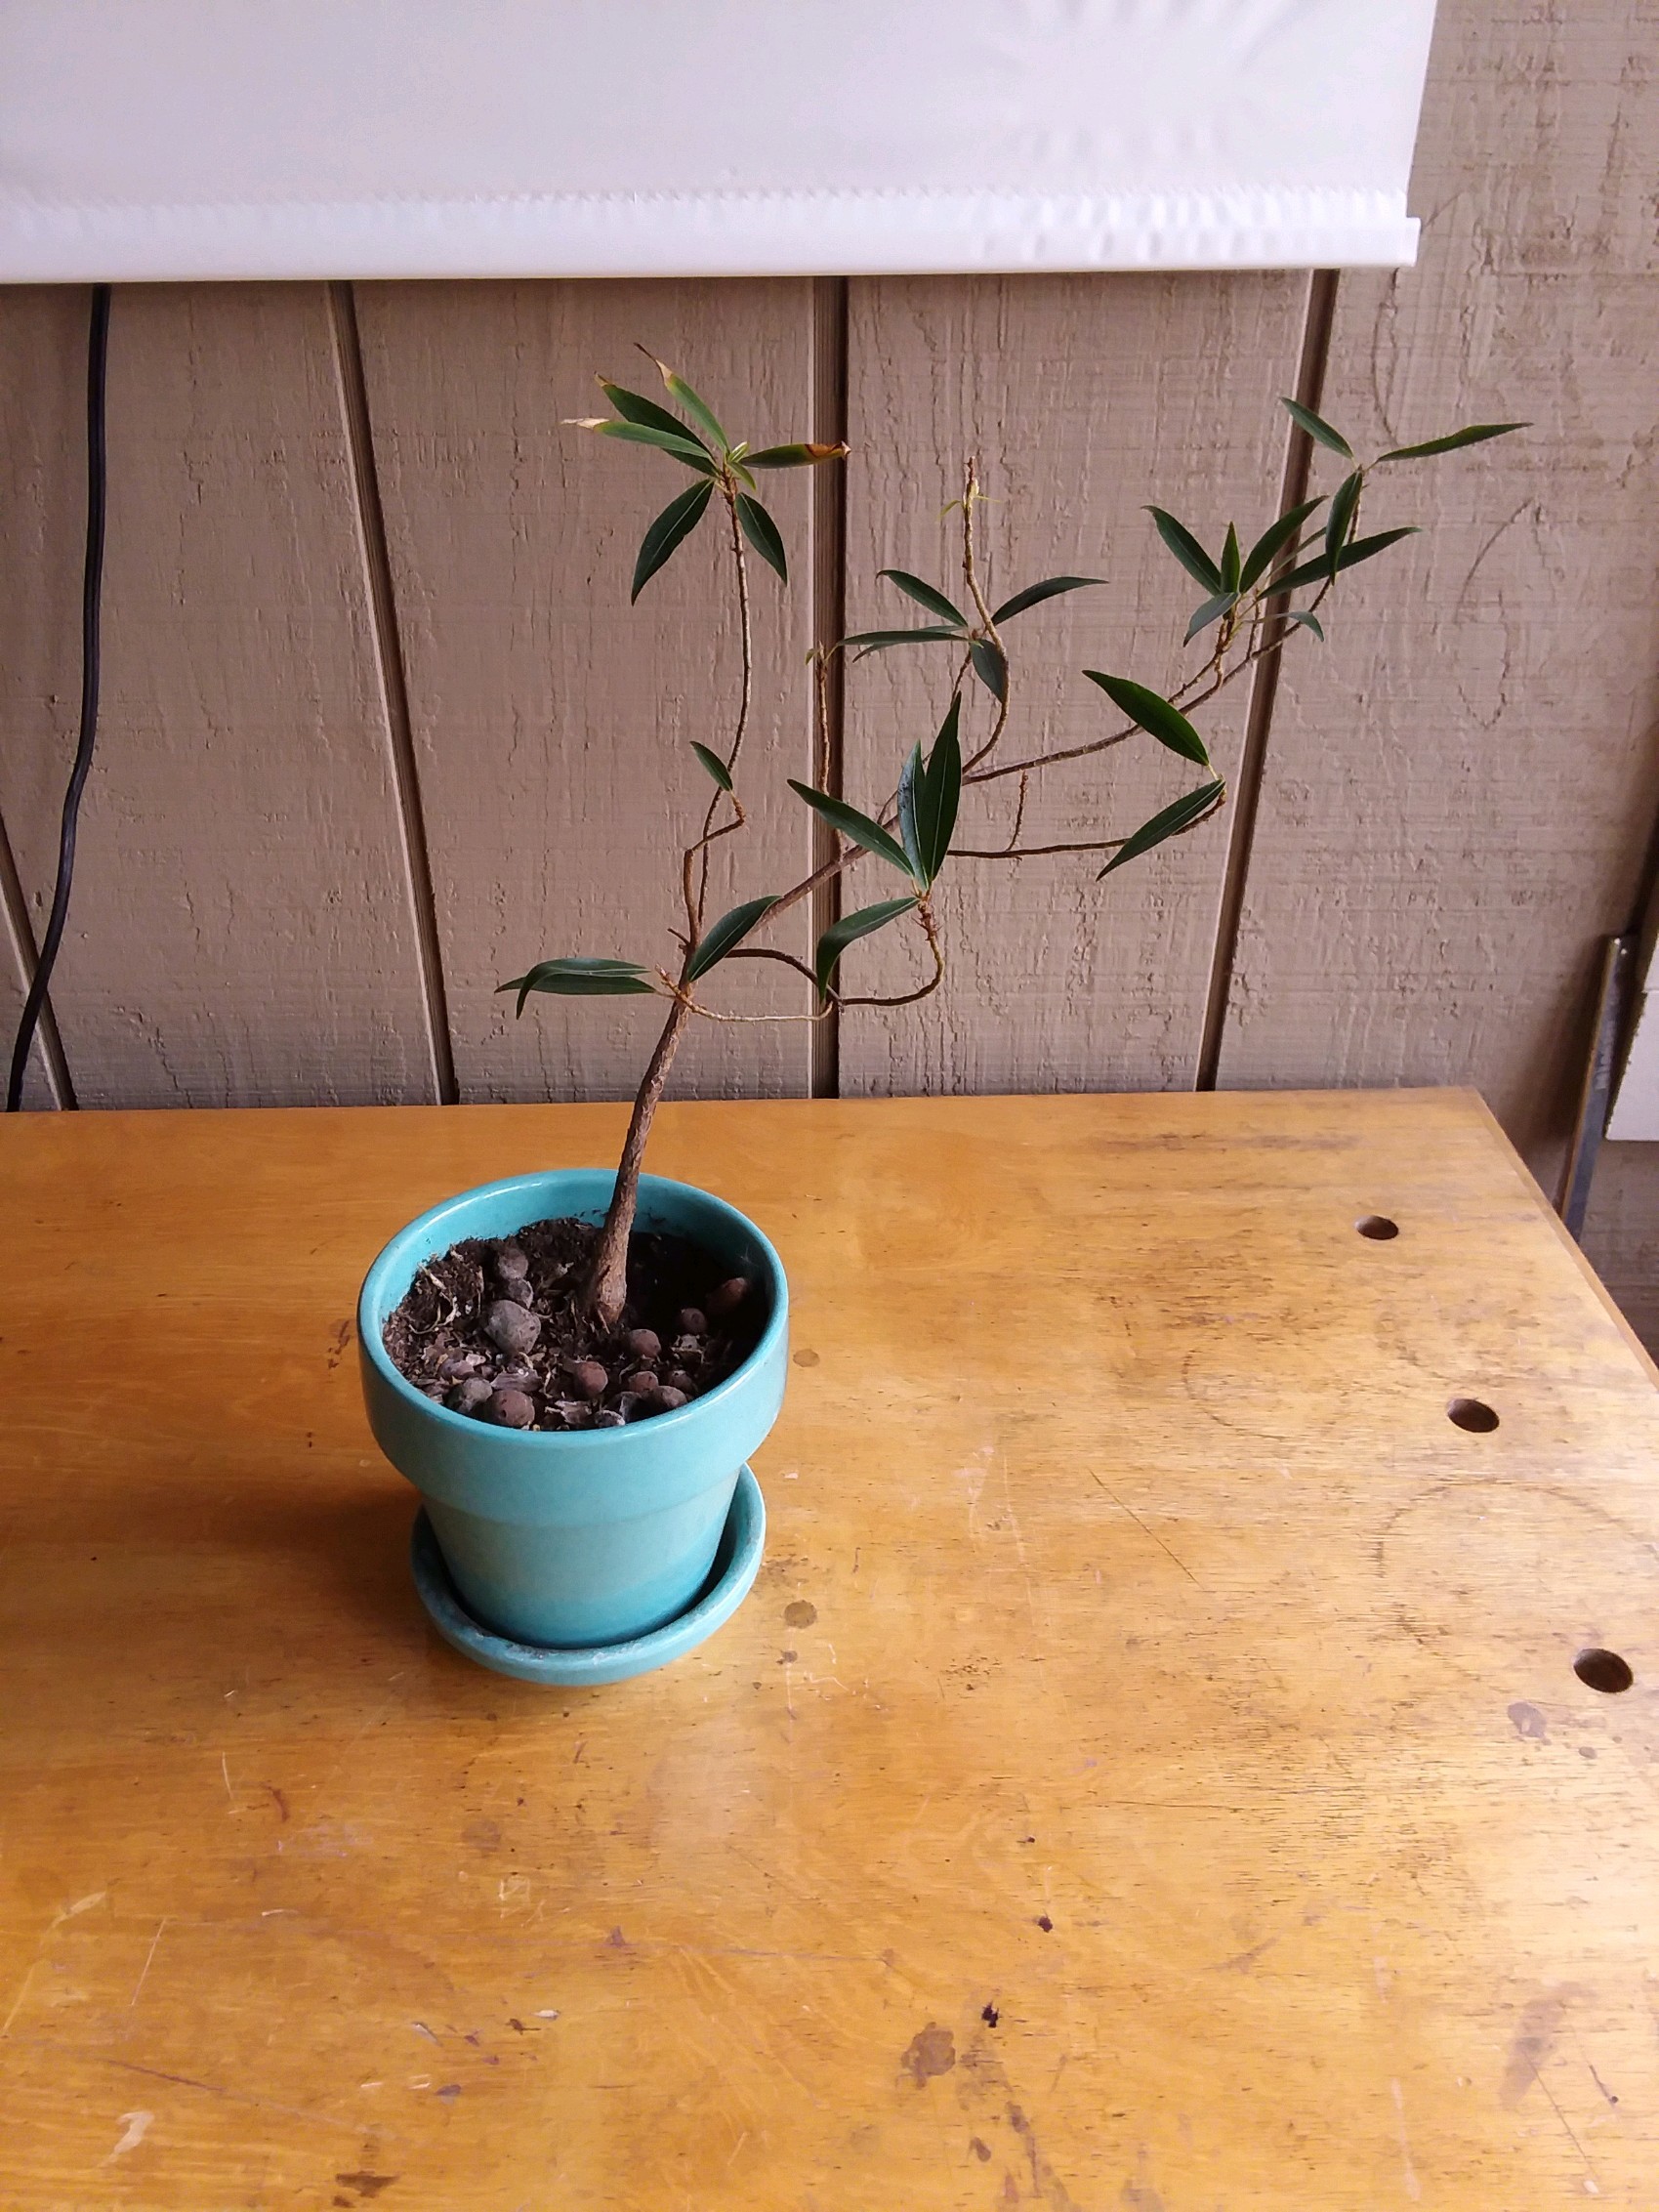
I've had it for about 8 years and it's always looked about this terrible. I wasn't sure whether I was over/underwatering or possibly just not giving it enough light. It did better in the summers when it got to live outside, but unfortunately that changes both of those variables.
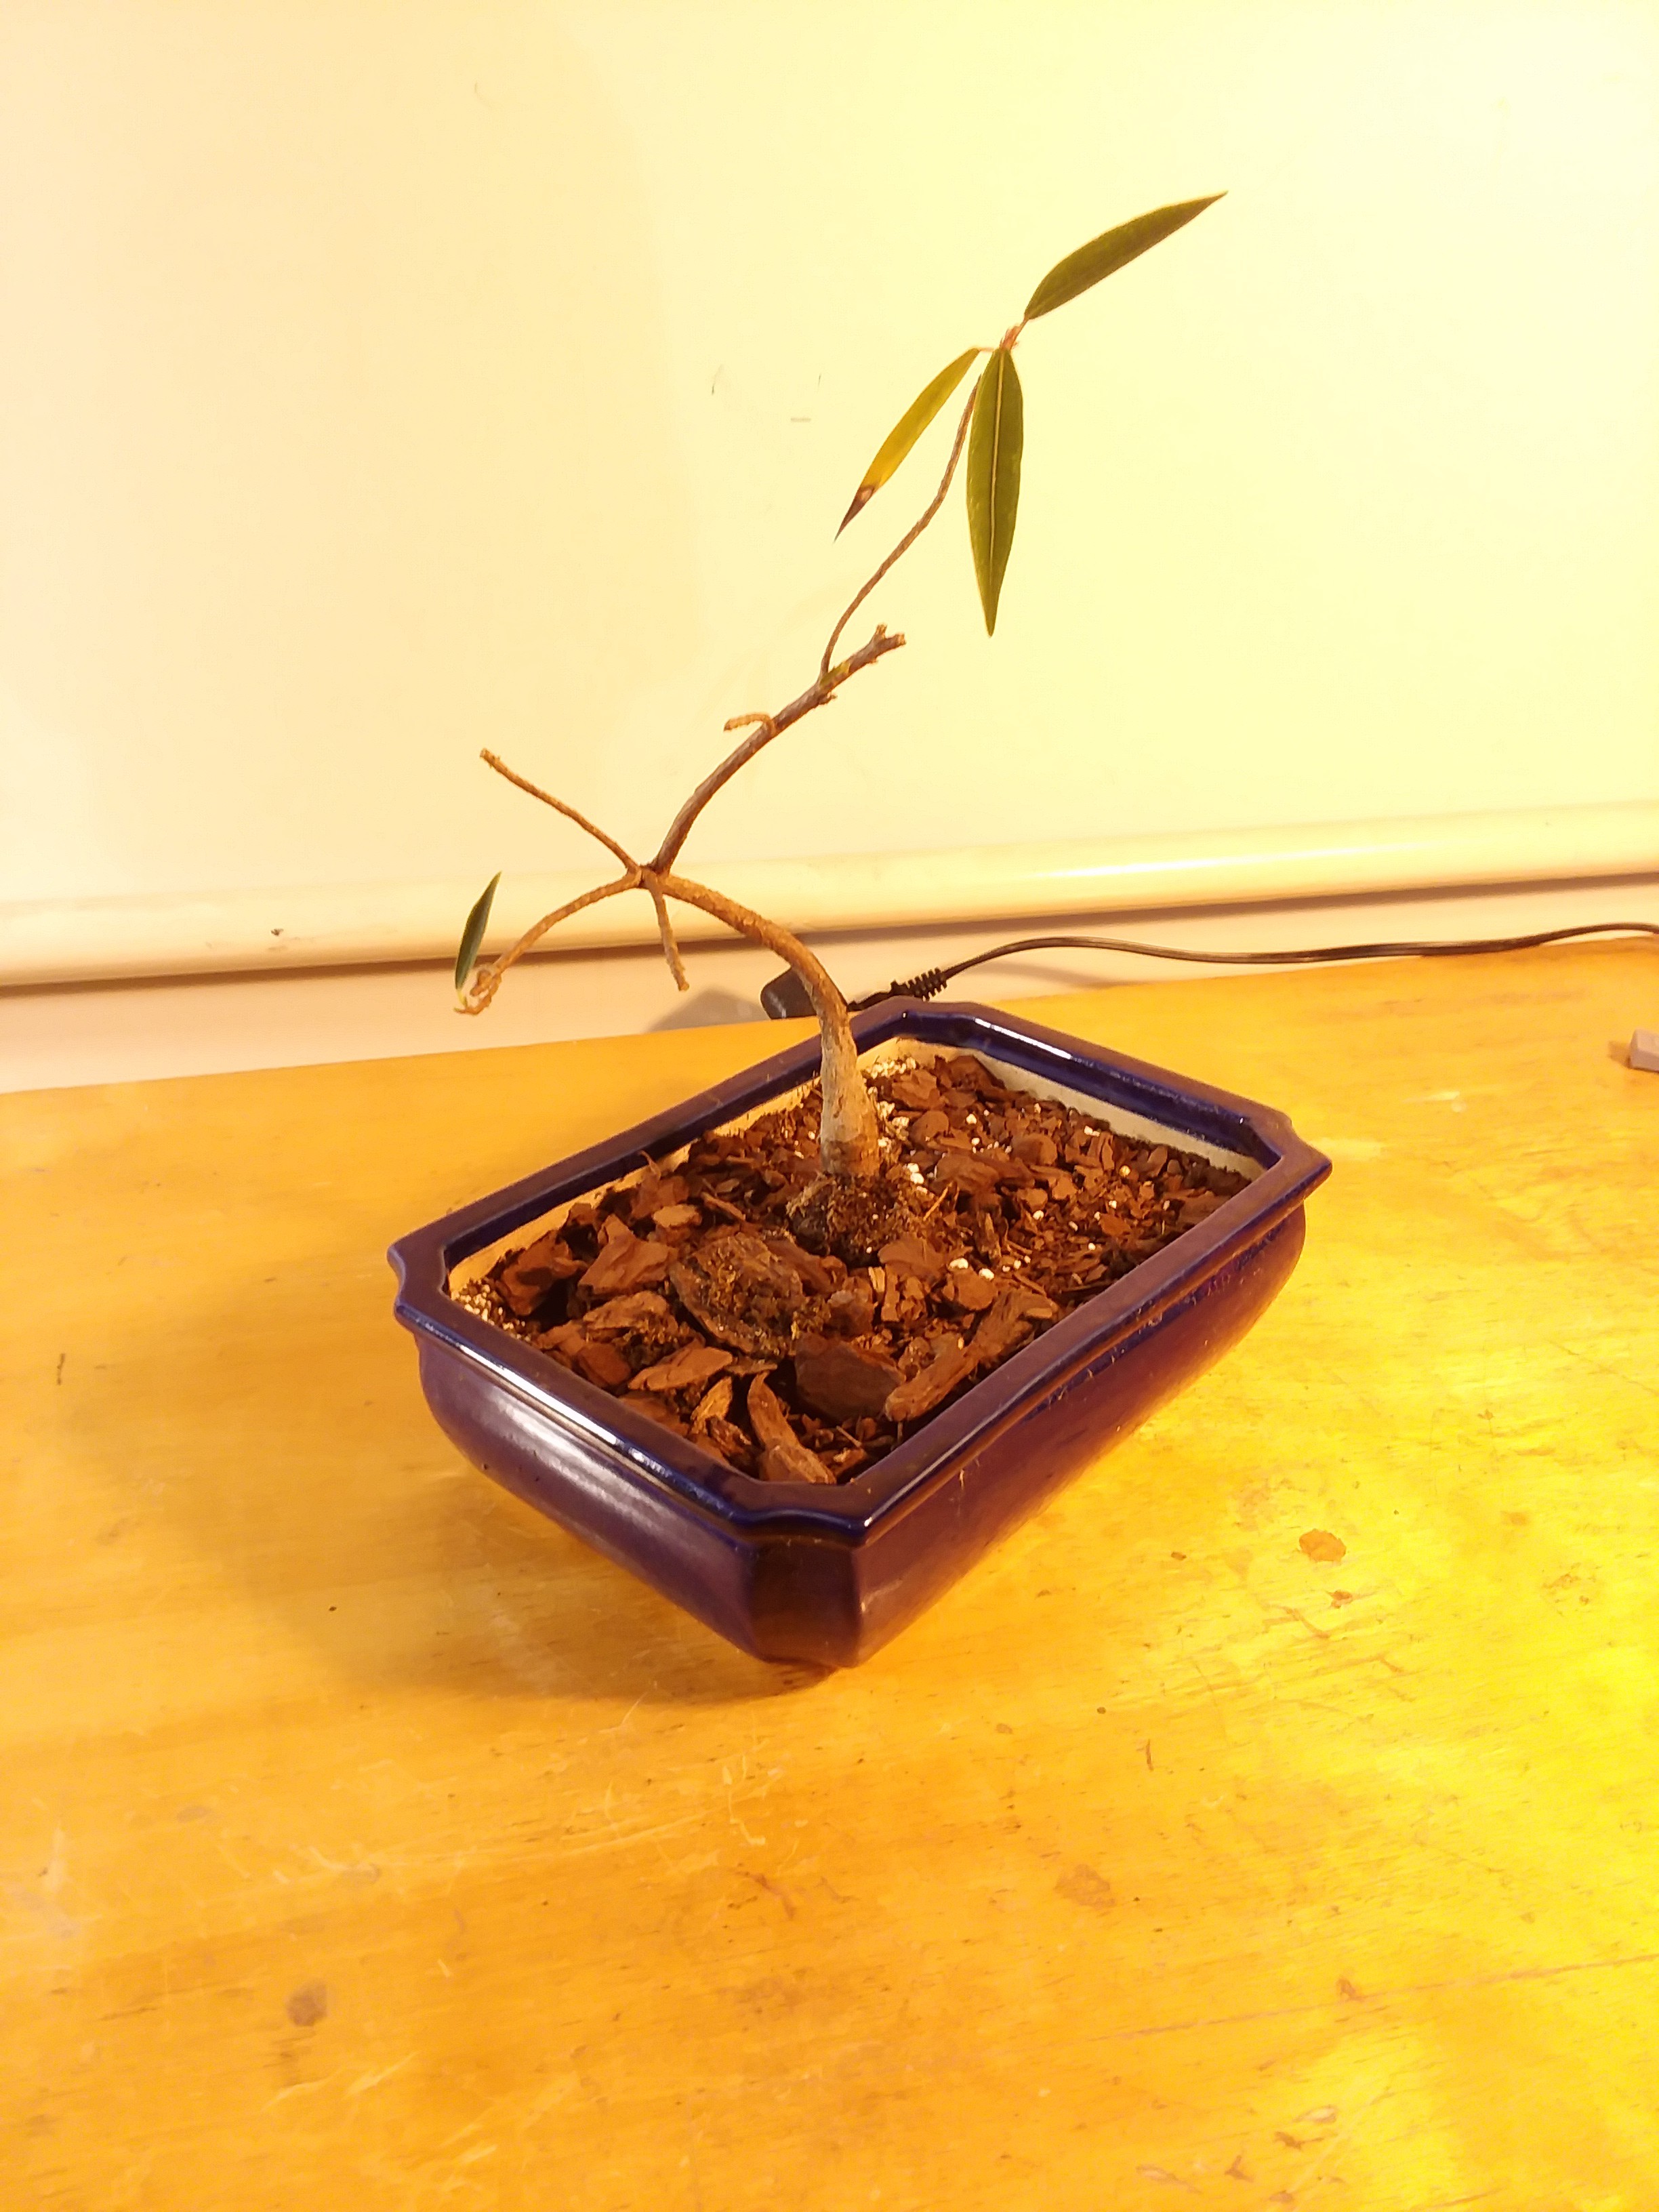
In January, I watched one of those many YouTube videos on creating bonsais from relatively normal-looking plants. I gave it a shot, to largely terrible effect.
Side note: I'm not terribly fond of describing these mini-tree sort of things as bonsais. Bonsai comes with many cultural connotations and the perception of right and wrong ways of doing things. I just want interesting-looking plants, so I try to avoid calling them bonsais. But, bonsai is a pretty effective word for giving someone else the rough idea of what you're going for, so I do slip up and use it periodically.
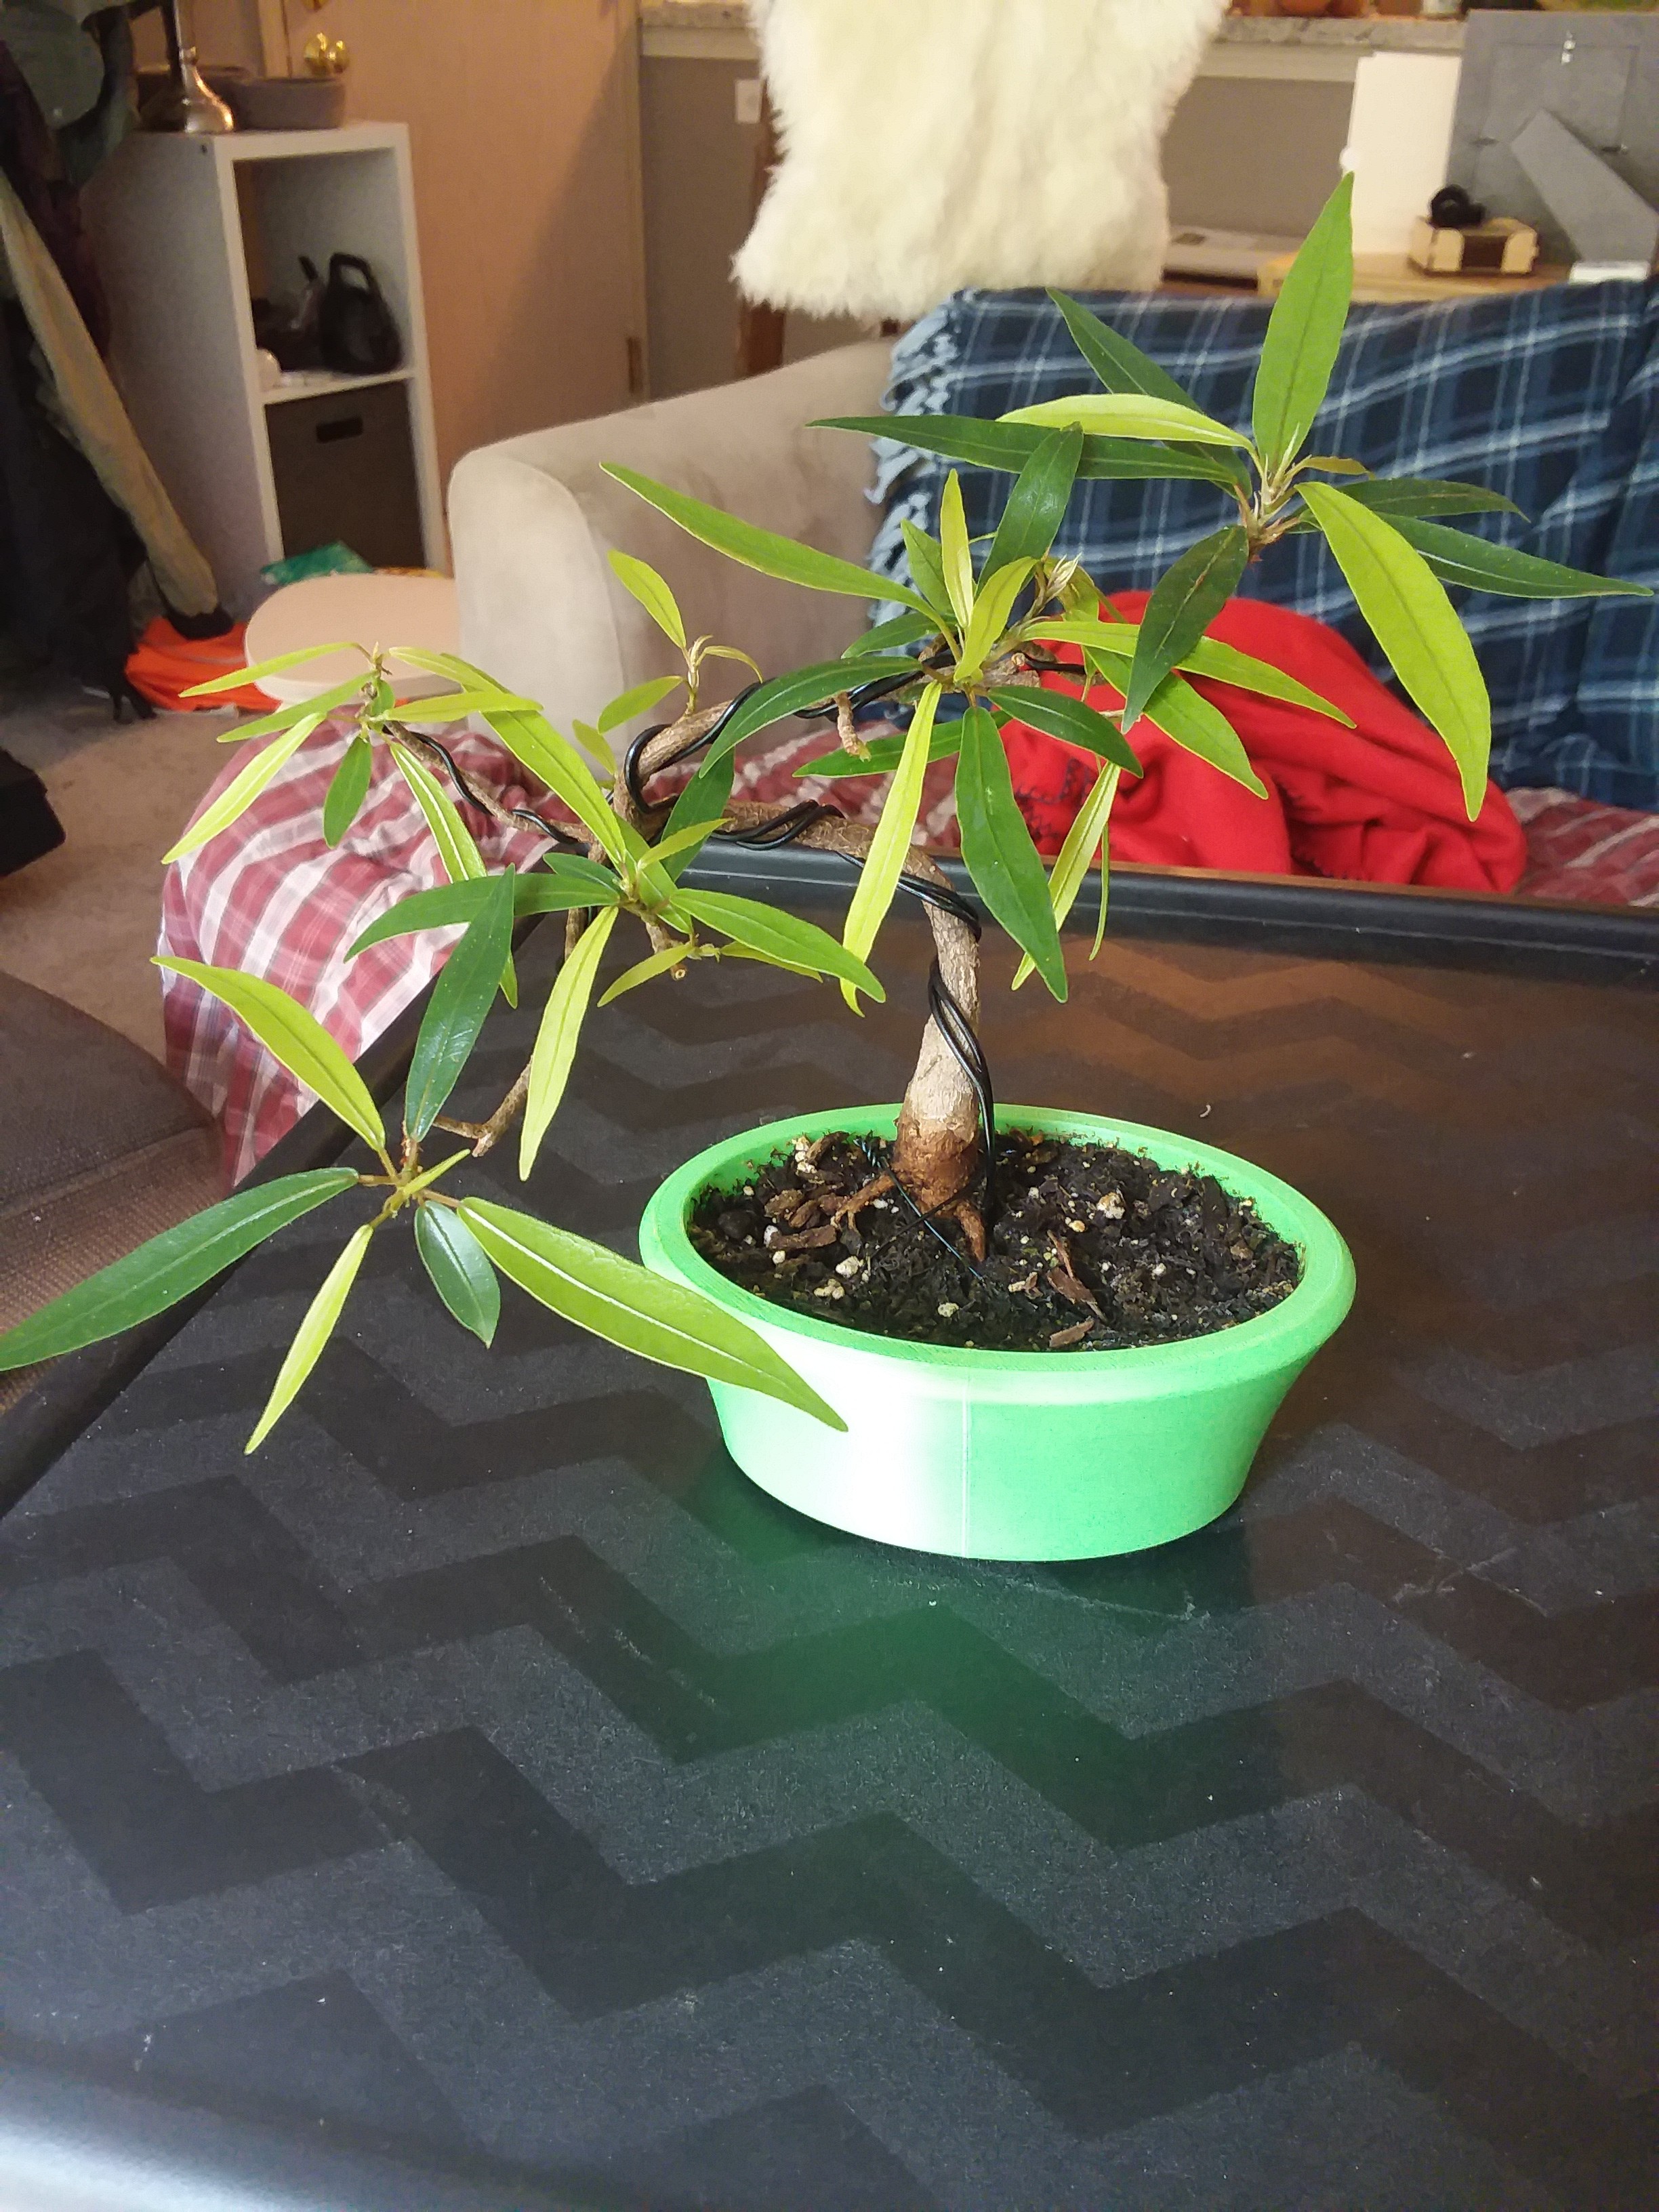
In between the previous two pics, I moved from Atlanta to Seattle, which probably didn't help the plant at all. The repotting really exacerbated the watering issue. Since the root system was tiny (not a healthy plant), the bigger pot made it harder to tell whether the soil by the roots was dry. I was worried that the plant was going to completely die if I didn't do something, so I risked the stress of repotting into a much smaller planter (designed by me in Fusion 360 in two snap-together parts to print without support). This next picture is 2 months later.
About at this point, I started tracking the weight of all of my plants each day in a little notebook. That was far too much work, so a Raspberry Pi Zero W database with a local network website followed shortly. Anyways, here's a plot of the weight of this particular plant, starting at the end of April and going until July 2nd.
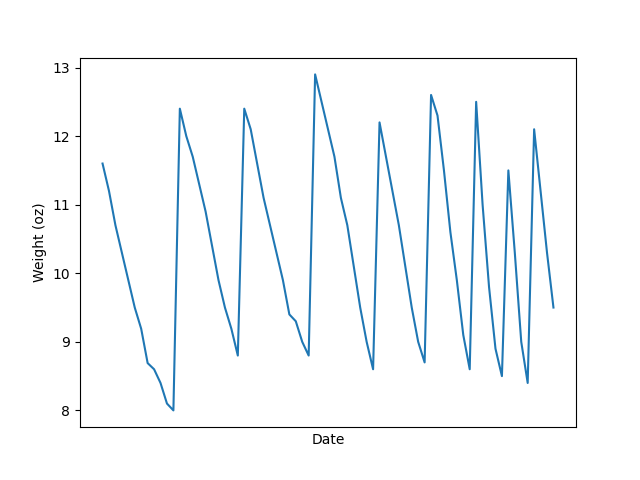
Couple of things stand out to me about this graph, aside from my clear lack of skill in creating compelling graphics. First is that the time between watering is decreasing (or frequency of watering is increasing if you'd rather be positive about it). This is likely due to a rebound in the number of leaves, which use up the water in the process of photosynthesizing the plant food.
The other is a lack of an upward trend in the maximum weight. As the plant grows more, it should be increasing in mass, yet this graph implies the opposite. I have two guesses for why: my measurement and watering schedules are missing the maximum weight in each watering cycle or the weight of the plant is pretty negligible compared to the soil, water, and pot. The first certainly contributes, especially since I tend to weigh, then water, then weigh again the next day. Measuring more continuously with an in situ scale should reveal the contribution of the timing, but I suspect the growth I've seen has also been negligible.
Discussions
Become a Hackaday.io Member
Create an account to leave a comment. Already have an account? Log In.