 psemportugal
The software KiCad was used to create the respective PCB, due to it being open-source and easy to use. The first step was to create the schematic symbols corresponding to each component of the circuit, some already existed (like resistors, capacitors, diodes and MOSFET’s), and others were created from scratch (like gate drivers, motor, batteries, voltage regulator and all the 2, 3 and 6 pin connectors). Due to its size, the schematic was divided in 3 images.
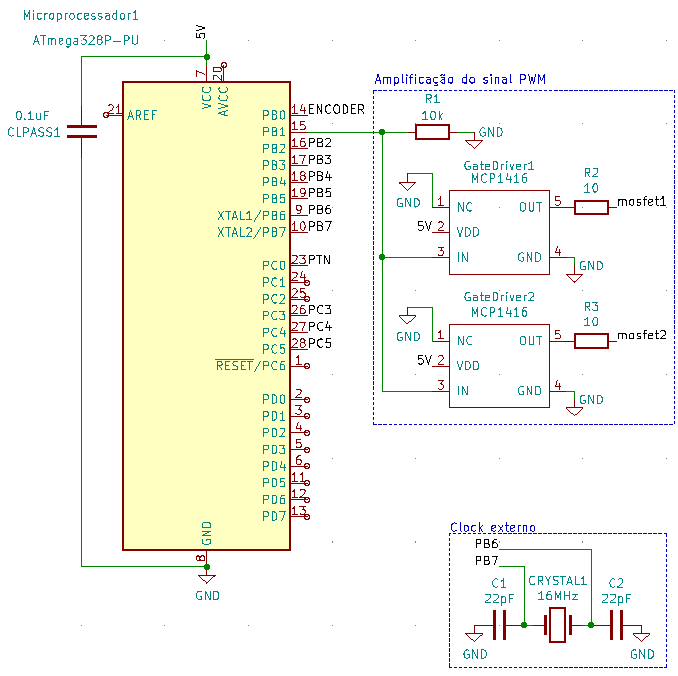
- In the first schematic image we see the microprocessor used (ATmega328P-PU) and its connections to both gatedrivers. The signals exiting gate drivers 1 and 2 through resistances R2 and R3 will enter the MOSFET’s gates. To force the microprocessor frequency to be 16MHz we use a small external crystal.
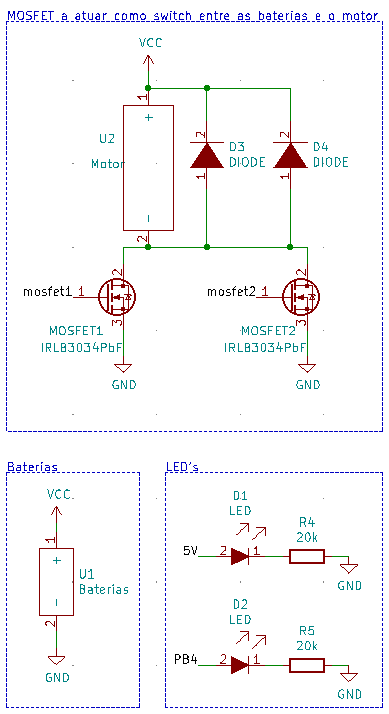
- In the second schematic image we see the main motor-battery circuit, where the motor has two flyback diodes in parallel (to avoid the negative effects of EMF when the circuit is suddenly opened) and two MOSFET’s, which act as switches to close and open the circuit. We also have two small circuits for two LED’s, one of which turns on when the batteries are connected to the PCB, and the other when the microprocessor sends a 5V signal to its respective connection. These LED’s allow us to troubleshoot problems more easily.
![]()
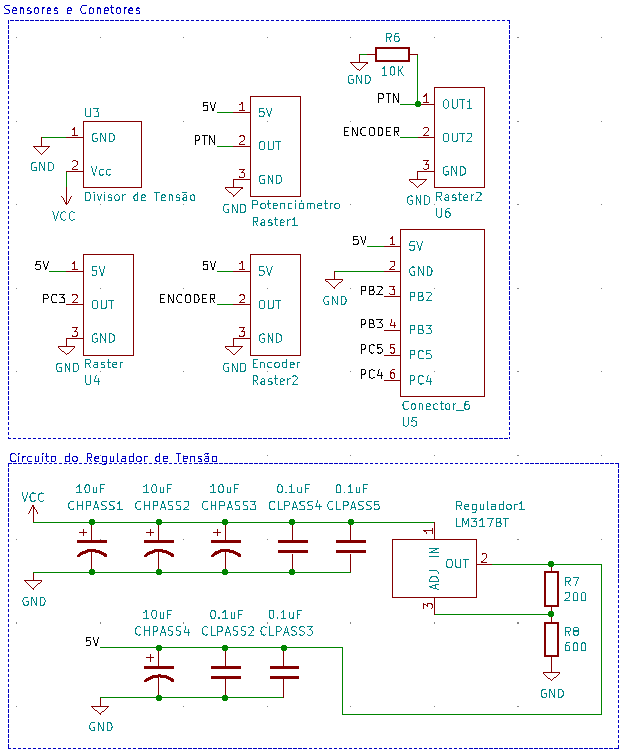
- In the third schematic image we see, on the top side, all the connectors used. Most are used to send important data to our data acquisition system, but two 3 pin connectors are used to receive data relative to the current measured vehicle speed, measured with a Hall sensor, and the current desired vehicle speed, which our pilot adjusts with a potentiometer. On the bottom side we see our voltage regulator, it takes in 24V from both batteries in series, requires two resistances (200Ω and 600Ω) to adjust the output voltage to 5V, and capacitors of various values (10μFand 0.1μF) on the input and output to filter any noise the signals may carry.
![]()
With this schematic in hand, we need to create the necessary footprints to assemble the PCB layout. Just like the component schematics, some footprints already existed and were used and others were created from scratch (using the component datasheets as reference for the dimensions and pin placements).
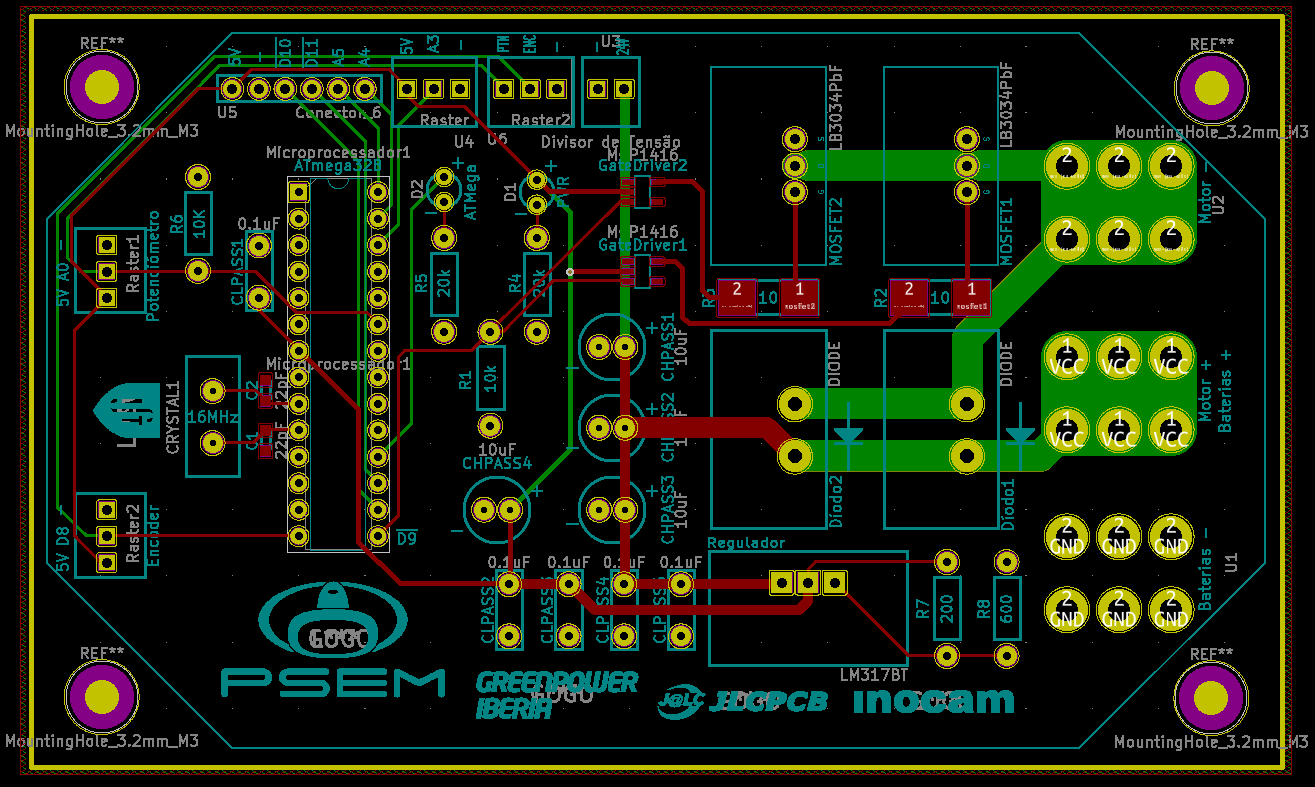
In the following image we see the entire PCB layout.
- The red connections represent traces on the top layer and the green connections represent traces on the bottom layer. One feature that stands out is the relatively high width of the green traces on the right side. These traces connect both MOSFET’s and both diodes to 24V and to the motor negative. Since a relatively large amount of current will run through these components (between 20A and 25A, in nominal conditions), these traces need to be as thick as possible on the PCB. To aid this, these traces are uncovered so we can solder copper wires on top of them, this way we reduce the strain the high currents will inflict on the PCB.
![]()
Besides these copper wires, all other components were placed on the top layer, in the following image we can see the physical PCB (courtesy of JLCPCB) assembled with all components.
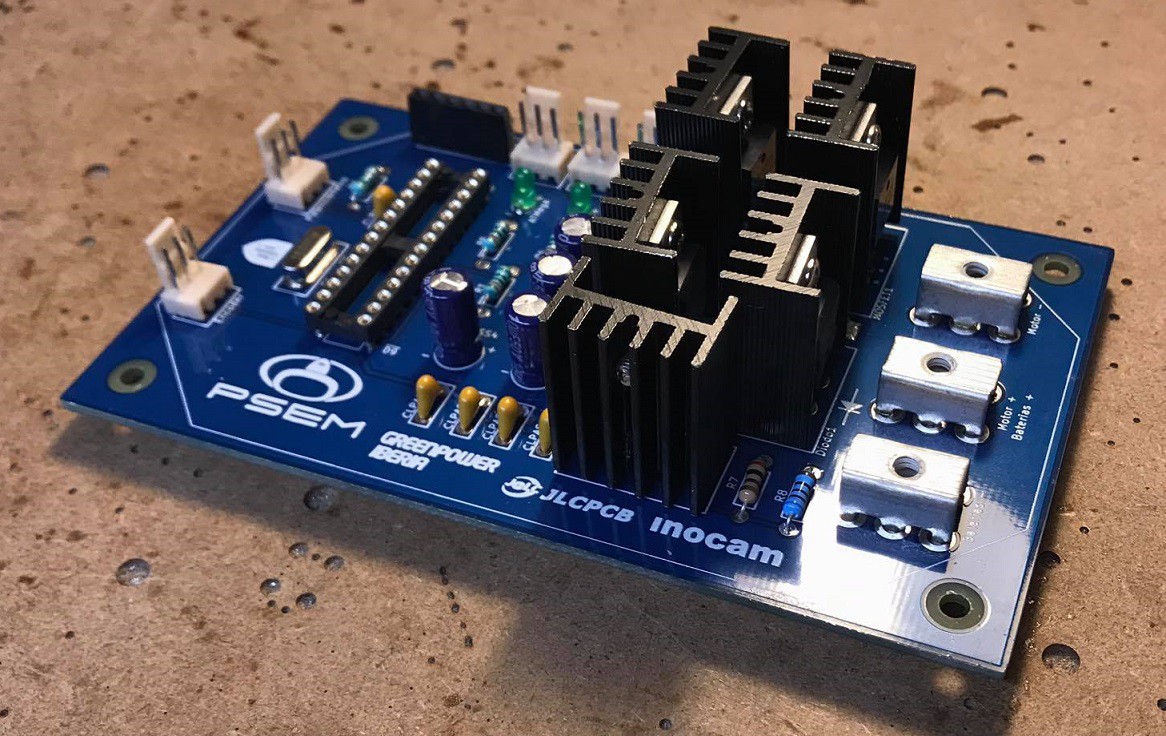
In order to test the controller design, assuring the safety of the driver and the car, the whole system was recreated in a laboratory. The controler is present on the leftmost side (we also have an arduino recording measurements from temperature sensores placed on all the heatsinks) and the motor on the right side is acting as a generator, so we can simulate various loads.
A diagram explaining this setup is also shown.
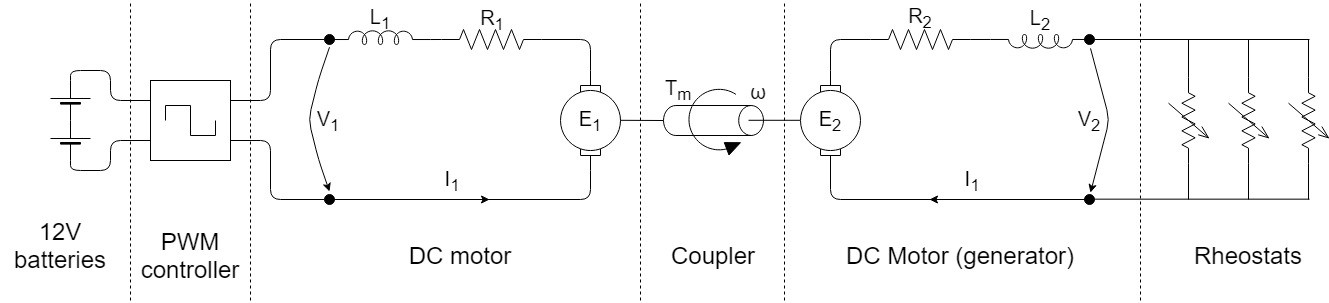
Firstly, we have two 12V batteries in series connected to the PWM controller, which is powering the DC motor with an equivalent DC voltage V1 (proportional to the duty cycle). This motor is coupled to the second one on the right mechanically, making the angular velocity of both shafts the same. Since the second motor is not powered electrically, it is serving as a generator, imposing a voltage V2 on the three rheostats which itself imposes a current back on the DC motor generator.
The current forced by the rheostats is interpreted by the left DC motor as a torque load. In other words, by increasing the equivalent resistance of the three rheostats, we are making the DC motor use more current, giving us the ability to manipulate how much current runs through the PWM controller. This way, by adjusting this resistance, it is possible to simulate racing conditions, assuming the only external variable on the DC motor is the torque appliedon E1. The following system of equations describes how the mechanical component interacts with the electrical in a DC motor.
Matching the torque and velocity on each motor (using the coupler), and knowing the constants R, L, k, J and B for both cases, with just a few measurements of the system, it is possible to calculate all the relevant information. For example, imagining we know the torque both the car and the driver apply on the motor on a certain point of the track, by adjusting the rheostats, we are able to obtain the correspondent current draw graph on the controller for variable speeds on those conditions.
Since we are dealing with currents around 25A or 30A, both the motors and the rheostats are working near their limits. To mitigate any possible damage to the equipment, the temperature of both motors is monitored closely, as well as the current on each rheostat, to ensure the load is distributed equally. As for the controller, the PWM signal generated is observed on an oscilloscope and the temperatures of the diodes and MOSFET's are recorded as well.