 David H Haffner Sr
Well I've worked out some noise issues concerning the 8 bit ccd design, I'm glad I got to play around with it on the breadboard before ordering the PCB. I was able to make some needed tweaks in DesignSpark and update the gerber files and now they are getting made @ PCBWay.com :)
I am confident in it's performance, even @ 8 bits, I did learn a few things though about working with CCD's, one is, thermal noise, yeah, even with NO power its still there, and on the breadboard it has little room for any air circulation underneath, so I had to compensate for this "dark current" by taking at least 5 dark frames and comparing the frame with the least amount pixel depth and then averaging the other frames together at their higher RMS #'s and subtracting that from the low pixel numbered frame and that gave me a pretty good representation of the most stable dark current values.
I did the same procedure with the sample frame, I used my Solux 50 Watt Halogen lamp (4700K), which uses a 12vdc regulated power supply @ a distance of 52 cm and a slit width of 0.5 mm and slit length of 16 mm. The biggest reason for following the same procedure with the sample frames is because of what is called "shot noise,"
Which is caused by the random arrival of photons. This is a fundamental trait of light. Since each photon is an independent event, the arrival of any given photon cannot be precisely predicted; instead the probability of its arrival in a given time period is governed by a Poisson distribution. With a large enough sample, a graph plotting the arrival of photons will plot the familiar bell curve.
Shot noise is most apparent when collecting a relatively small number of photons. It can be reduced by collecting more photons, either with a longer exposure or by combining multiple frames.
I chose the multiple frames option because I am not capturing any live spectra, as one would if you were imaging a galaxy for example, so I used an integration time of 0.50 ms long enough to get the shot but short enough to not introduce unnecessary noise caused by longer exposure times.
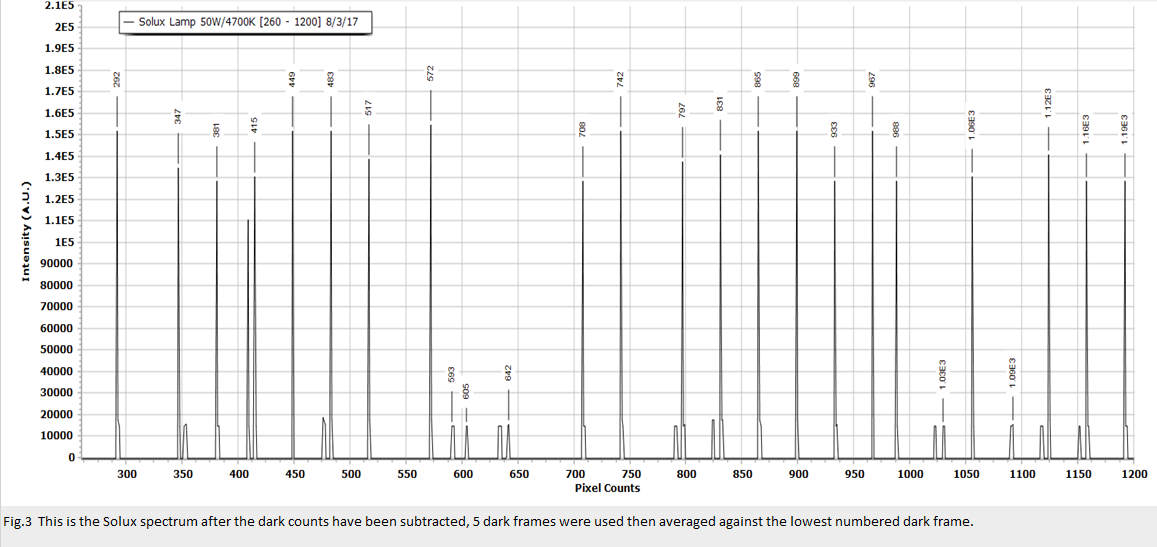
The first plot we will look at is figure 3, because its the raw spectrum from 260 pixels to about 1200 pixels in length. I processed the CCD data using Spectragryph 1.2.0 designed and written by Dr. Freidrich Menges PhD. and is now certified by the NIST. I already subtracted it from the dark frame and flipped it right side up using this LOG formula in excel; =(10*(-B2))*100. This will convert the Y values to -LOG so the spectrum will revert to a transmission spectrum, because negative numbers do not make sense in this case.
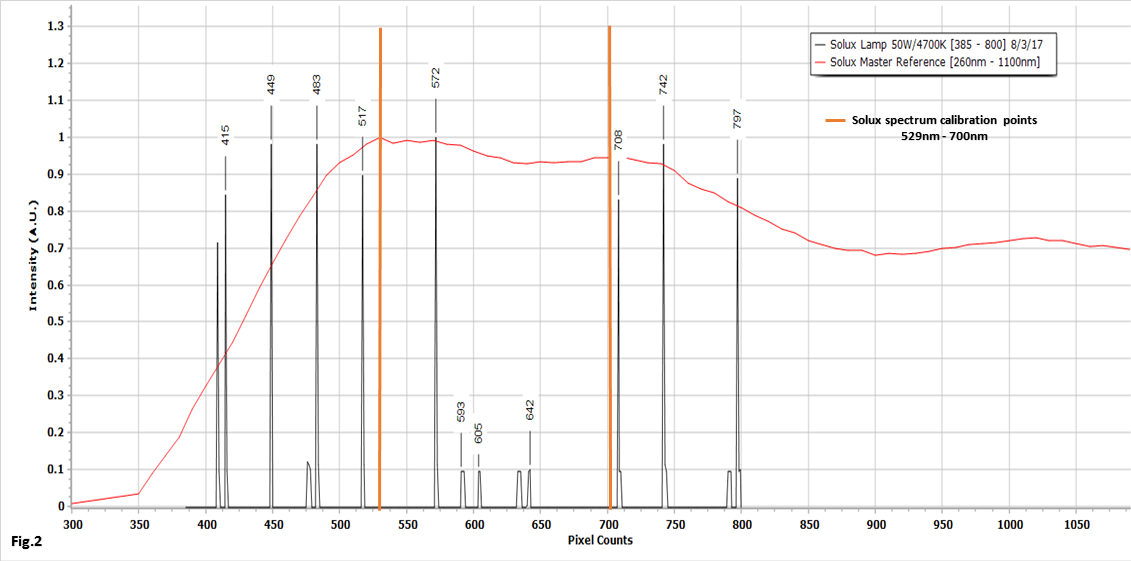
The next plot figure 2, is the spectrum cutoff at 385 - 800 pixel counts. This was the reason for the 16 mm slit length, the only way to manually control the wavelength range was to simulate an actual spectral image on the CCD substrate without a diffraction grating.
In figure 2 you also notice, how I calibrated my Solux spectral image to correspond to a master reference spectrum, a Solux spectral plot I downloaded from Solux Technical Data and Graphs
Here is the spectral resolution data for this spectral plot below
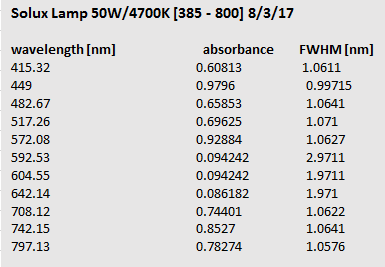
Keep in mind that, @ 1 and 2 nm it's not the best but we are working from a breadboard after all, with no diffraction grating or optics!
Finally I put it all together in figure 1, best for last, and introduced a feature in Spectragryph 1.2.0 called "Spectropic view," where I can align the plot to fit a particular wavelength range and image the spectral lines.

The next steps are clear when the PCB boards come in and then the final phase of testing can begin :)
Discussions
Become a Hackaday.io Member
Create an account to leave a comment. Already have an account? Log In.