 RossGK Tangibles
With the first functioning prototype, a test seemed to be in order. Being winter, it seemed like a few days of monitoring the cool unfinished basement in this old house seemed like a good idea.
I turned on the Doggler and set up my sampling to every 30seconds - more resolution than necessary for typical temperature fluctuations in a house, but I was interested in getting lots of data.
After four days (well, three and a half) I accumulated a bunch of data on my SD Card, and I pulled it into the LibreOffice spreadsheet and cobbled together a plot.
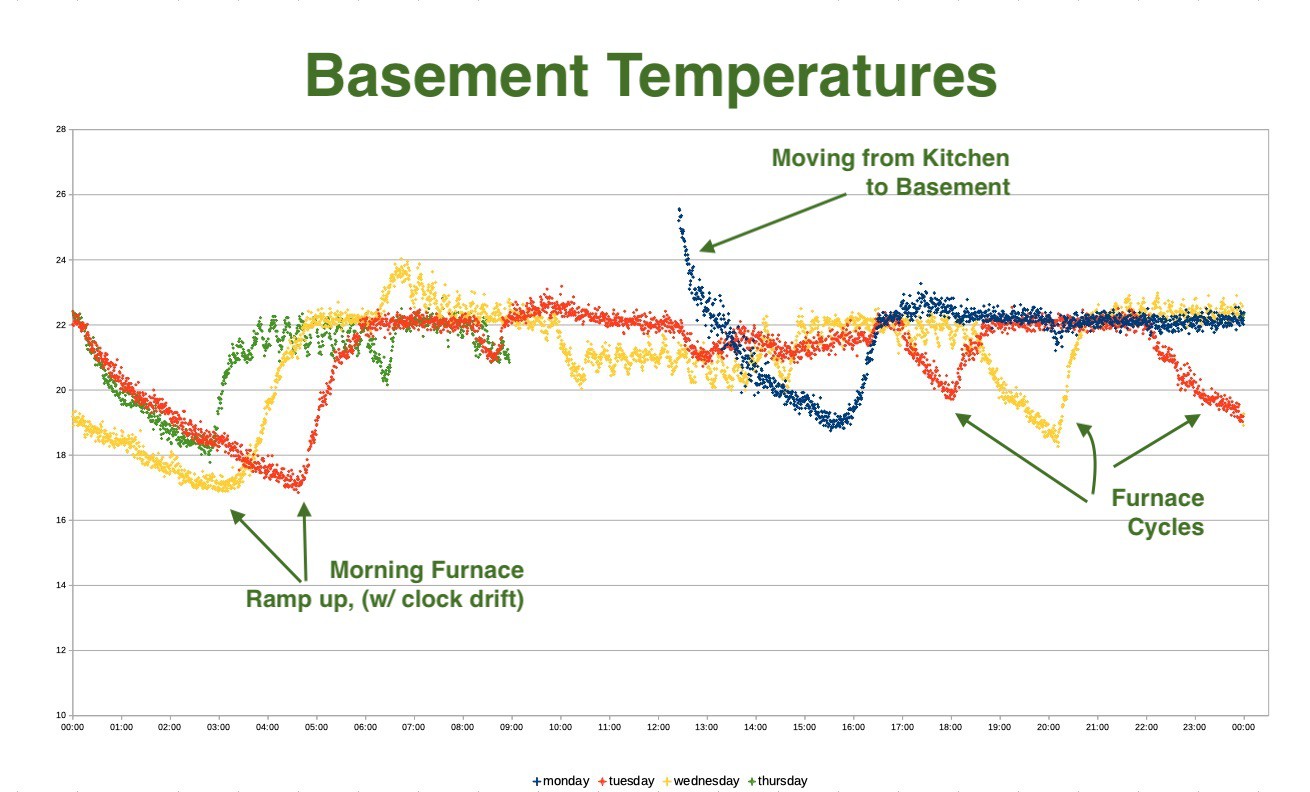
The result was nicely illustrative of the furnace fluctuations, and different periods in the house during the day when I'd bump up the thermostat, and then the long slow drop in the morning until the furnace came on for the first warm up.
As well, the shifting of that same early morning event shows that the time keeping was drifting a bit over multiple days. This makes sense as the ATMEGA processor was sleeping for multiples of eight seconds and trying to accumulate these and other processing interruptions to preserve battery life.
For this application - general trends are the main interest, and precision time-keeping didn't seem like a high value, so no Real-Time Clock circuitry is included. This keeps the costs down, and simplifies the code too - although there's overhead for managing an internal rough clock function, so that part is probably a wash.
Next was some work on a 3D printable case, with easy access to SD card and batteries.
Discussions
Become a Hackaday.io Member
Create an account to leave a comment. Already have an account? Log In.