 Nathan
BetterSerialPlotter
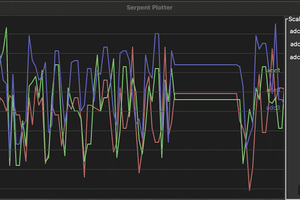
The Better Serial Plotter is a drop-in replacement for the arduino serial plotter. You should be able to use code exactly the same way that you would for your Serial Plotter applications, but work with the extended functionality of the Better Serial Plotter. Some beneficial features of the Better Serial plotter include:
- Comport and baud rate selection
- Support for multiple plots
- Change names and colors of variables
- Ability to view a serial monitor in the same application
- Auto-scroll option on serial monitor
- Plots with multiple y-axes
- x vs y plots
- Saving output to a file
- Autoscale plots
What your arduino program should look like
This program is intended to work for any program that already uses the built-in Arduino Serial Plotter. That means that you need to open the Serial communication channel in your setup() function using Serial.begin(BAUD_RATE) where BAUD_RATE could be 9600. Make sure you take note of what baud rate you use. Then in every iteration of your loop() function in your arduino code, you should write to the serial monitor with any amount of variables, each separated by either a tab or a space. Before the loop ends, you should output a newline character. See the Example Arduino Code section at the bottom to see how this could look. See the Example Arduino Code section below for an example
Running the application
Make sure that your arduino (or serial-interface device) is plugged into your computer and running. Run the Better Serial Plotter application, and a graphical interface should open up. From there, click on the Serial Port dropdown on the top of the screen. You should see a list of serial devices attached to your PC. Click on the serial port that your device is attached to. Then, you should click the dropdown for the baud rate and select the baud rate that you used in your Serial.Begin() function in your arduino code. If everything is set up properly, you should see your data on the left side of the application, under the Incoming Data section. If you are having trouble, make sure to check out the troubleshooting tips at the end of this page.
As a super-quick config option, you can click the plot all data button, then right-click the plot and click autoscale to get essentially the same experience as the arduino's built in serial plotter.
Configuring Data
The BSP becomes really useful when you want to do some more interesting configurations. Once you are properly connected, on the left side of the screen, you should see a list of all of the variables that you have sent from your arduino code. If you want to configure, the name, plot color, or what plots a variable shows up on, you can right-click the variable name. A context menu should open up as shown below, where you can edit these items. Click on save to make your changes.

Adding and Removing Variables to Plots
There are several options for adding and removing variables to plots. Portions of these are shown in the gif below.
- Click and drag variables from the
Incoming DataPanel to any plot to add it to that plot. You can also drag variables to a specific axis on any of the plots (x-axis, left y-axis, right y-axis) to add them to a specific axis. - Right-click a variable on the
Incoming Datatab, and configure it in thePlots Activesection, as shown below. You can both add and remove data using this section. - Right click on a specific plot choose either
Add DataorRemove Databased on what you would like to do.

Plot Controls
There are several configuration options to change how to display your plots, including:
- Resize the plot by clicking and dragging the bottom of it
- Add variables to the plot by right clicking and selecting Add Data
- Add variables to the plot by right clicking and selecting Remove Data
- Autoscale to make the limits of...


 Christopher Xu
 Jerry Isdale
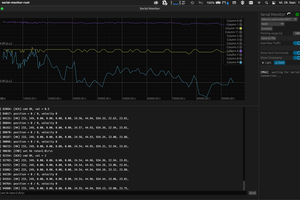
 hacknus
 Gintaras Valatka
Love this program!
Have searched long time for a plotter with this kind of easy zoom/pan, and also with multiple y-axis!
I am missing a connect/disconnect button. Right now I have to close the program every time I want to upload new code to the microcontroller over uart. This is troublesome since the config loading of label names dosnt work every time. Will have a look in your code to find a way to do this =)