 Wenting Zhang
Design and Implementation
Hardware
To best describe what's in the hardware, here is the block diagram
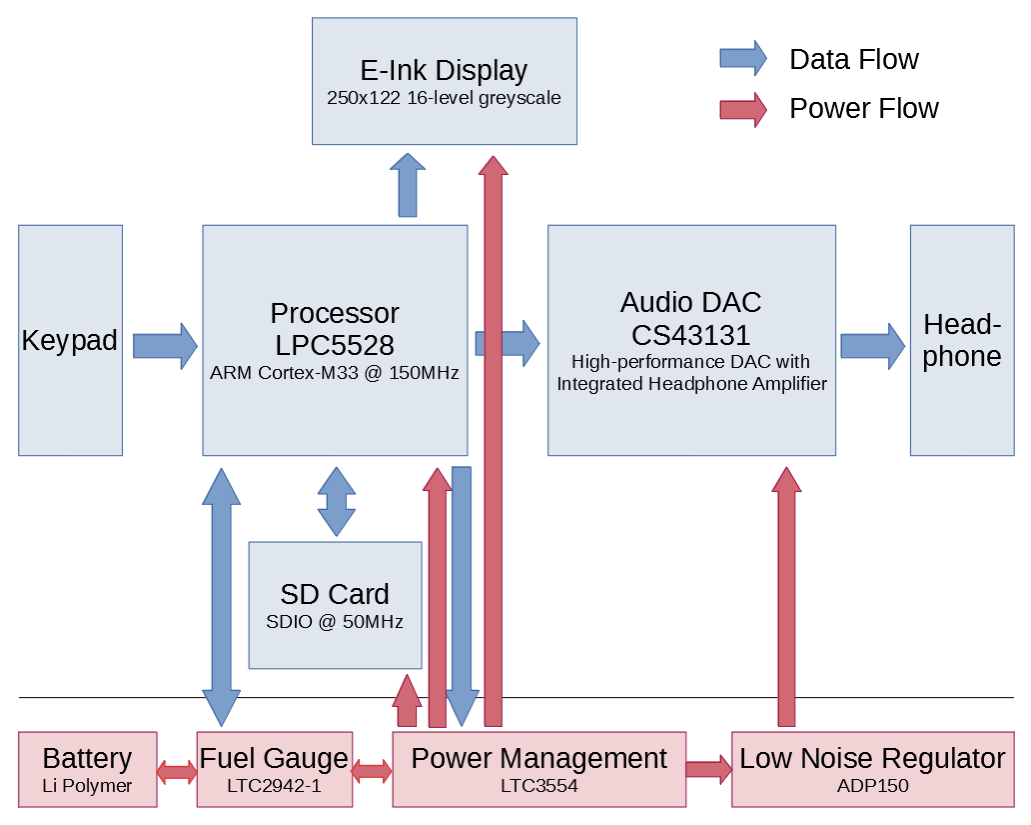
The main processor being used is the NXP LPC5528 microcontroller. It is an ARM Cortex-M33F based microcontroller manufactured at the latest (as of 2020) 40nm eNVM process. It has a hardware single-precision floating-point unit, which would allow running floating-point DSP algorithms much faster. It has 256KB of internal RAM and 512KB of internal flash. The DAC being used is the Cirrus Logic CS43131 DAC. It is a high-performance audio DAC with an internal charge pump and headphone driver. Integrated solutions allow us to make the device smaller. The screen is the GoodDisplay GDEH0213B72, which is a 2.13” E-ink display with a resolution of 250x122. Additionally, ADI LTC3554 and ADI ADP150 are being used for voltage regulating and charge control, regulating the power. For precise estimation of the remaining battery capacity, a fuel gauge (LTC2942-1) is also used onboard, providing tracking for the total energy used. This can be also useful for measuring power consumption.
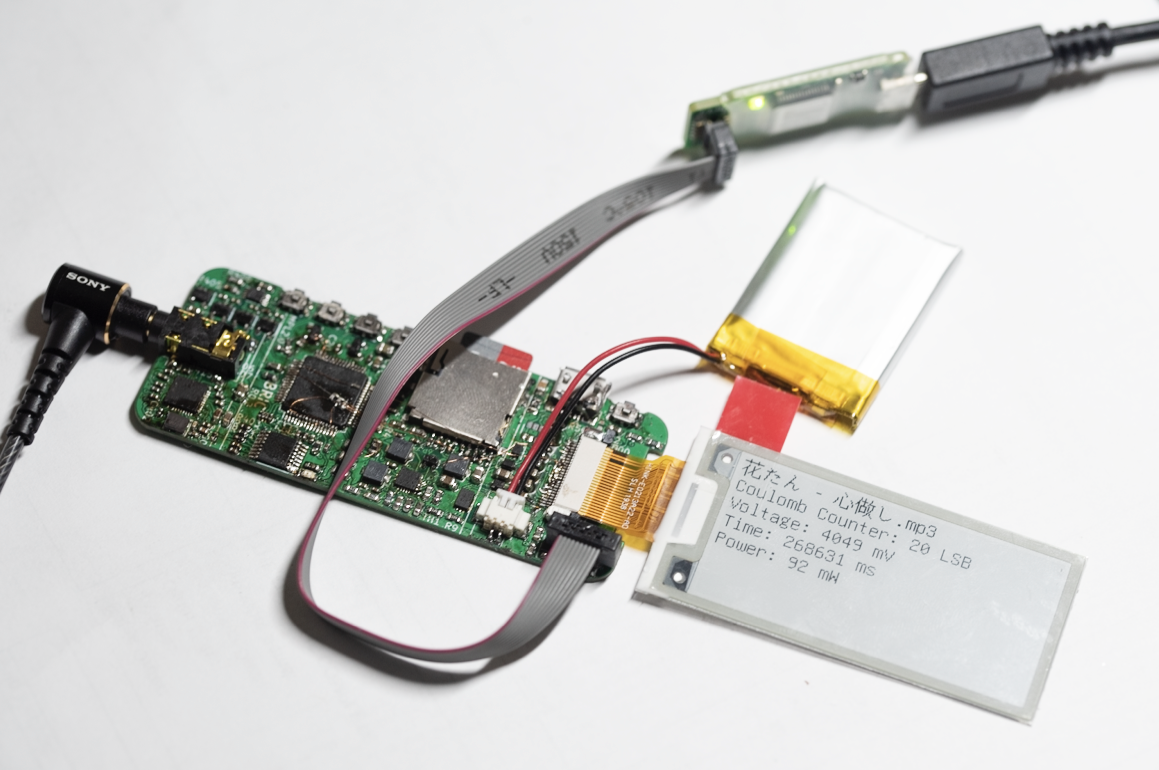
(R0.2 hardware running software MP3 decoder and showing power consumption)
Software
The software is built on top of the FreeRTOS. The system software consists of 3 concurrent threads:
- one for the user interface
- one for fetching data from the SD card
- one for decoding the audio.
The reason for using a multithreading software than a single thread one is the different nature of these three tasks. The data fetching task is a typical I/O bound task, meaning the speed is mostly limited by the speed of the I/O device (SD card in this case). The decoding task is a typical CPU bound task, meaning the speed is mostly limited by the processing speed. The user interface task is an I/O bound task as well, as it spends a lot of time just waiting for user input or screen update. By using a multithreaded approach, these tasks can be easily interleaved and so the CPU can spend less time waiting and more time computing. It could either reduce the CPU load or make the CPU capable of decoding more demanding audio formats under the same load. The rule of thumb is that, if it takes fewer cycles to do something, then the CPU can lower the clock speed or spend more time sleeping, lowering the power consumption.
Besides FreeRTOS, several other open-source frameworks are used:
- The FatFs by ELM-ChaN is used for handling the file system on the SD card.
- The minimp3 by lieff is used for decoding the mp3 audio file.
- The TJpgDec by ELM-ChaN is used to decode the JPG cover art embedded in the audio file.
- The id3v2lib by larsbs is used to read metadata from MP3 files. The id3v2lib is modified to allow buffer less operation due to the limited RAM amount.
To display the cover art, a block-based bilinear image scaling algorithm is implemented. The screen, despite being capable of displaying up to 16 level grayscale, is being advertised as a monochrome screen. Only monochrome (black and white only, without greyscale) example driver is provided by the screen vendor. The greyscale driver for the E-ink driver is then developed to allow displaying grayscale images. Mixing grayscale and monochrome content is also allowed and implemented.
Personally I listen to lot of Chinese and Japanese songs, so support for displaying these characters are important to me. To summarize my requirements:
- At least 2 font size for reasonable UI design
- Capable of display hiragana, katakana and most commonly used kanji glyphs
- Supports UTF8 encoded unicode. GBK and JIS supports are nice to have but not necessary
- Antialiasing is not necessary
- Fit in 512KB internal flash
Which may sounds quite reasonable, but it's not that easy, especially the last requirement of fit into 512KB. If without compression, 16x16px glyph takes 16*16/8=32 bytes each, 12x12px glyph takes 12*12/8=18 bytes each. So overall each glyph takes 50 bytes. Because it needs to support unicode, only considering 16bit UCS (lower 65536 glyphs), for each mapped character that's 2 bytes assuming glyph a 1-to-1 mapping and the glyph could be freely reordered. However to save space, Japanese kanji glyphs are aliased to Chinese hanzi glyphs. This breaks the 1-to-1 mapping, but rather a n-to-1 mapping (unicode to stored bitmap). So this adds 2 bytes to each supported unicode glyph. If I allocate 400KB to this font, that's about 7800 glyphs. This is clearly not enough to store all glyphs, so common ones need to picked. I decided to go with glyphs covered by GB2312, which contains 6763 characters, covering "99.99% contemporary Chinese text usage". A PC side tool was developed to generate the font and unicode mapping with Kanji->Hanzi alias.
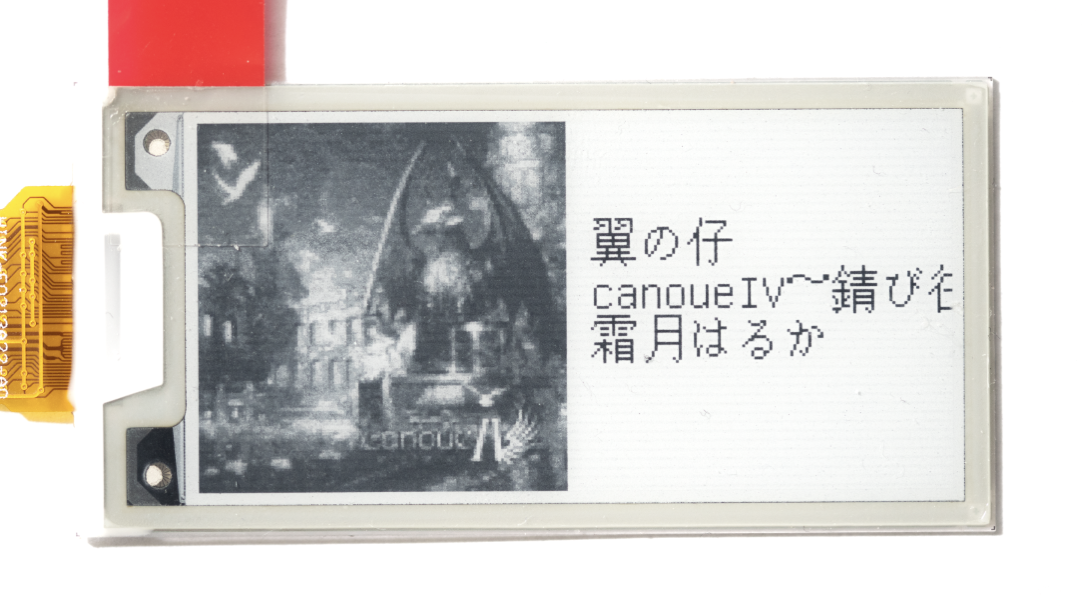
(Displaying ID3 tag and cover art from mp3 file)
Performance Evaluation
Note: Tests were done with R0.2 PCB, not latest R0.3/0.4 PCB. R0.3 made changes to SD card and DAC output layout, R0.4 only fixes some minor power consumption issue when powered down.
Power Consumption
The power consumption is being measured using the fuel gauge over the course of one song. Various configurations of clock frequency are being tested and the results are presented below.
|
# |
Idle Policy |
Clock Source |
AHB |
SDIO |
Flexcomm |
Power Consumption |
|
1 |
WFI |
External + PLL |
50 MHz |
16.7 MHz |
12.5 MHz |
82 mW |
|
2 |
WFI |
External + PLL |
50 MHz |
50 MHz |
12.5 MHz |
105 mW |
|
3 |
WFI |
External + PLL |
50 MHz |
16.7 MHz |
48 MHz |
82 mW |
|
4 |
WFI |
External + PLL |
96 MHz |
48 MHz |
12 MHz |
108 mW |
|
5 |
WFI |
Internal + PLL |
96 MHz |
48 MHz |
12 MHz |
108 mW |
|
6 |
WFI |
Internal |
96 MHz |
48 MHz |
12 MHz |
108 mW |
|
7 |
WFI |
External + PLL |
100 MHz |
12.5 MHz |
12.5 MHz |
81 mW |
|
8 |
WFI |
External + PLL |
100 MHz |
50 MHz |
12.5 MHz |
112 mW |
|
9 |
WFI |
External + PLL |
150 MHz |
50 MHz |
15 MHz |
122 mW |
|
10 |
None |
External + PLL |
150 MHz |
50 MHz |
15 MHz |
130 mW |
Note: WFI means “Wait For Interrupt”, it is an ARM instruction to put the processor into sleep mode.
From this table, we can see the factors that are contributing to the overall power consumption. From test run 1 and 2, as well as test 7 and 8, we can see the SDIO frequency contributes a lot to the overall power consumption. While from tests 1 and 3, the flexcomm frequency doesn’t have a measurable difference in the overall power consumption. From test 8 and 9, increasing the main clock frequency from 100MHz to 150MHz increases the power consumption by a small factor, likely due to the processor being run at higher core voltage. Test 9 and 10 show that putting the processor into the sleep mode saves some power. Test 4, 5, and 6 show that changing the clock source without changing the clock frequency doesn’t have a measurable difference in the overall power consumption.
From this table, to achieve optimal power consumption, the SDIO frequency should be kept as low as possible. Compressed audio data only needs to be read at a rate of less than 100KB/s, setting the channel too fast is just wasting power. The processor should be put into sleep mode whenever possible. The CPU frequency should be put under 100MHz whenever possible.
The average power consumption of 81mW is achievable. If we assume the battery has a constant voltage of 3.7V, with the 300mAh battery, it is capable of providing 300mAh*3.7V/81mW=13.7 hours of playback.
Audio Quality
The audio quality is tested using a R0.2 unit with a calibrated PrismSound dScope III.
Output amplitude at full-scale
The result is obtained by driving the input with a 997 Hz sinusoidal stimulus at 0 dBFS and recording the RMS output amplitude.
Left channel RMS amplitude: 6.933 dBu / 1.721 Vrms
Right channel RMS amplitude: 6.928 dBu / 1.720 Vrms
Frequency Response
The EUT is stimulated with a sine stimulus swept from 10Hz to 20kHz in third-octave steps. In order to prevent overload in systems that use emphasis, the frequency response is measured at -20dBFS. Prior to measurement, the output of the EUT is passed through a band-pass filter centered at the frequency of the stimulus, in case significant amounts of aliasing or noise are present.
THD+N
The THD+N is measured as per the “Total harmonic distortion and noise vs frequency” subsection in the AES17 standard. A -1dBFS sinusoidal stimulus is generated by the microprocessor, successively at each octave frequency between 20Hz and half the upper band-edge frequency (10 kHz). The output of the EUT is passed through a standard notch filter at the frequency of the stimulus, and also through a low-pass filter at the upper band-edge frequency. Note that measurements are also made for frequencies higher than 10 kHz and are also present in the graph.
Idle channel noise
The EUT is fed with a digital-zero signal. The RMS amplitude of the output noise of the EUT is measured via the A-weighting filter. The result is reported for both channels, in dBFS.
Left channel idle noise: -117.6 dBFS
Right channel idle noise: -122.0 dBFS
Idle channel noise spectrum
The EUT is fed with a digital-zero signal. The RMS amplitude of the output noise of the EUT is measured via the A-weighted filter in a range of ⅓ octave bands between 20Hz and 20kHz. The result is graphed in dBFS.
Noise in the presence of a signal
The EUT is fed with a 997Hz sinusoidal stimulus at -60dBFS. The output of the EUT is passed through a standard notch filter at the frequency of the stimulus, and also through the A-weighting filter. The RMS amplitude of the residual is measured for both channels in dBFS.
Left channel residual noise: -121.5 dBFS
Right channel residual noise: -122.6 dBFS
Software Performance
This section evaluates the performance (in terms of CPU time) under different settings.
Decoder Performance on Bare Metal vs on FreeRTOS
To show the benefit of using the FreeRTOS over bare metal, a simple test has been done to count the time the processor spends on various tasks. The results are presented below.
|
Fetching |
Decoding |
|
|
Bare Metal |
147.4 ms |
2941.8 ms |
|
FreeRTOS |
5.6 ms |
3017.6 ms |
When using the FreeRTOS, the CPU uses significantly less amount of time on fetching. This again shows it is an I/O bound task and the operating system can schedule other tasks while that task is waiting for I/O, thus improving the overall system throughput.
Decoder Performance vs Compiler Options
With the performance counter supported by the FreeRTOS, we were able to measure the performance of the MP3 decoder. The performance is measured in the DSP industrial standard MIPS counting: 1 MIPS means the processor needs to run at 1 MHz to process the audio in real-time. Note with stalls and multiple issue capability in DSPs, 1 MIPS no longer means 1 million instructions per second. The MIPS name is only for historical reasons.
The performance is tested against various compiler options and several audio files. SSAT is an optimization of doing saturated conversion using Cortex-M provided instruction. The optimization has been merged into upstream minimp3 library. The results are being shown below.
|
Configuration |
Test Vector |
Performance (Lower is better) |
|
-O0 |
心做し.mp3 (320Kbps) |
838.28 MIPS |
|
-O3 |
心做し.mp3 (320Kbps) |
690.37 MIPS |
|
-O0 FPU |
CONTRACT.mp3 (128Kbps) |
160.28 MIPS |
|
-O1 FPU |
心做し.mp3 (320Kbps) |
57.60 MIPS |
|
-O2 FPU |
心做し.mp3 (320Kbps) |
53.96 MIPS |
|
-Os FPU |
心做し.mp3 (320Kbps) |
56.64 MIPS |
|
-O3 FPU |
CONTRACT.mp3 (128Kbps) |
45.05 MIPS |
|
-O3 FPU |
心做し.mp3 (320Kbps) |
48.61 MIPS |
|
-O3 FPU SSAT |
CONTRACT.mp3 (128Kbps) |
40.71 MIPS |
|
-O3 FPU SSAT |
Betrayal.mp3 (320Kbps) |
44.81 MIPS |
|
-O3 FPU SSAT |
心做し.mp3 (320Kbps) |
44.43 MIPS |
From the result, FPU (Floating-Point Unit) is essential for this particular decoder to run in realtime. Compiler optimizations also bring a big improvement on the performance. The SSAT optimation extracts another 5-10 MIPS on top of the highest compiler optimization. Under the best effort (-O3 FPU SSAT), the decoder performance on our specific processor is 40-45 MIPS. Given the processor can run as fast as 150 MHz, this shows the processor is capable of decoding MP3 at more than 3X speed or decoding MP3 in real-time by a big margin.
Conclusion
So basically I created this thing in about half a semester, and it worked quite well. I was able to implement all the individual software components but there was no time left to really integrate them all together and create a useable DAP (which could require much more work than building the hardware). Moving forward, I don't have any plan to finish the software work anytime soon. If you are reading this and you are interested in helping me, feel free to reach out to me and we could work something out!