 Enki
EnkiTable of Contents
1 Introduction
This is the documentation of some experiments I performed in order to ascertain whether it's possible to detect cells generating excessive heat (aka "heaters") in a diy 18650 battery pack built using the popular 5x4 20.2 mm pitch 18650 cell holders. All of the findings should be applicable to bigger cell arrays as well.
2 tl;dr
By using an array of LM75 temperature sensors attached to one side of a 18650 cell pack abnormal heating of a single cell to a temperature of at least 50 deg Celcius results in a measureable (2 deg C) temperature anomaly which may allow for heater detection before a major pack failure has chance to occur.
3 Experimental setup
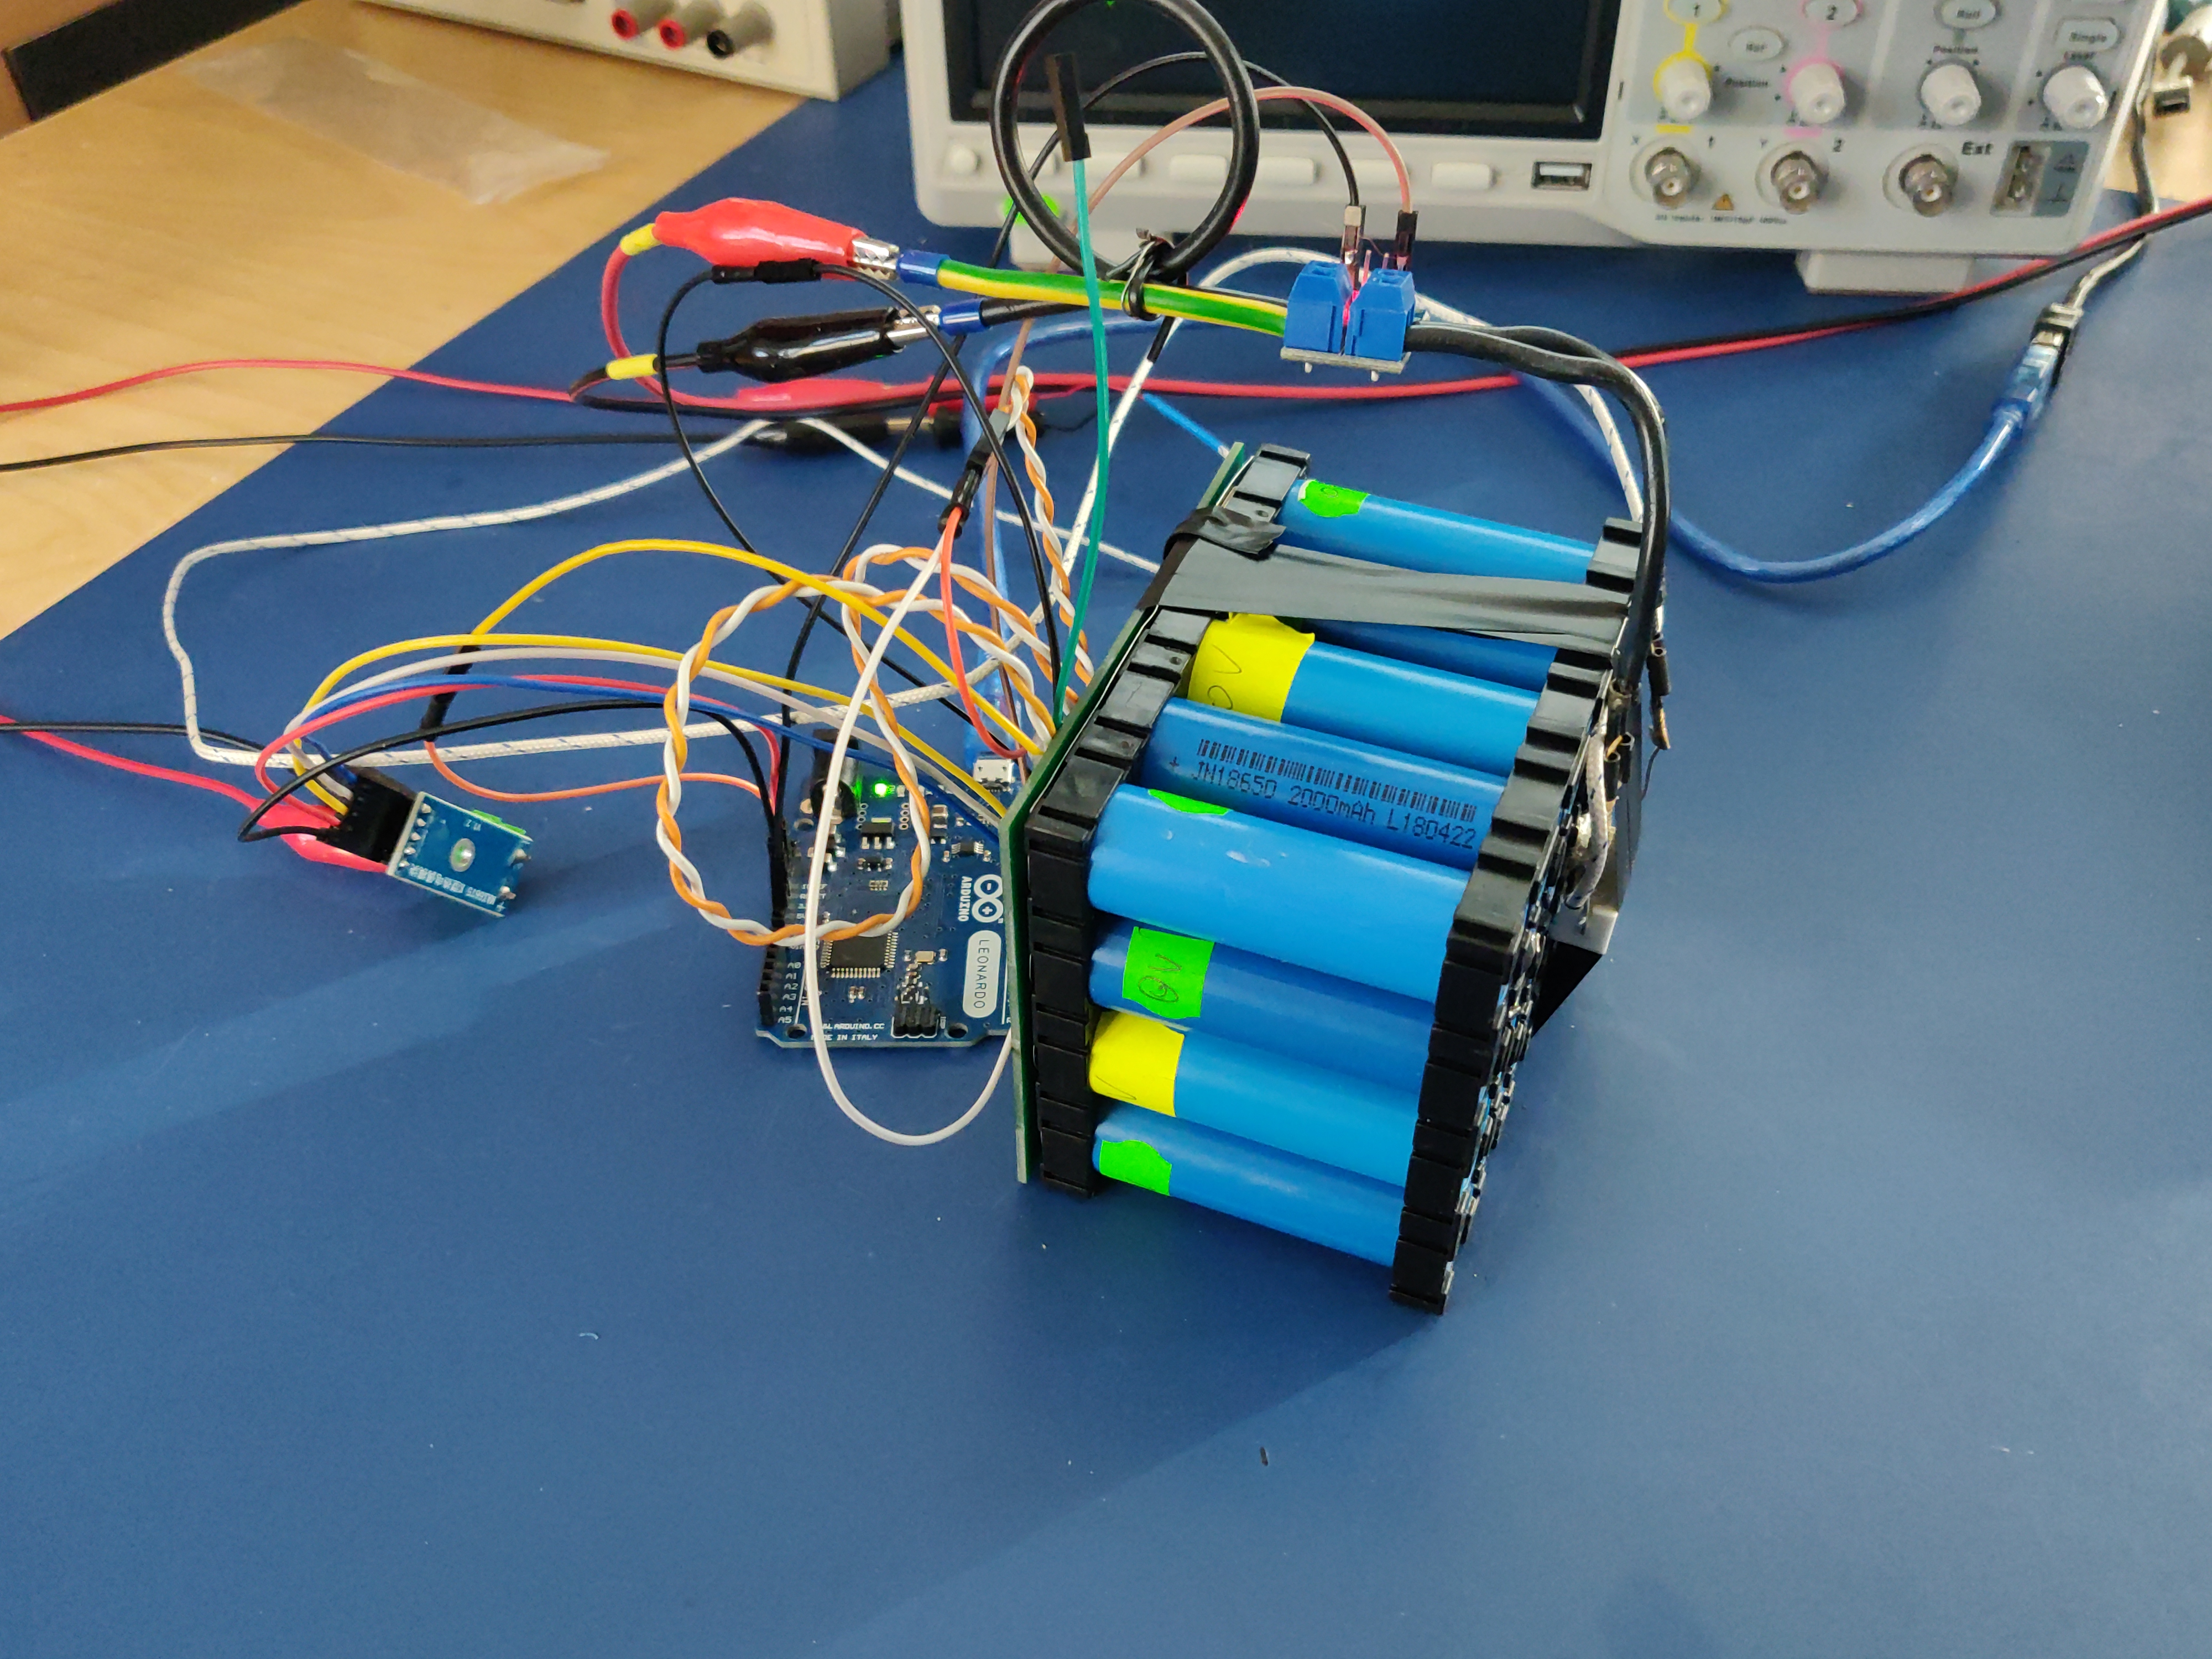
The experimental setup consists of a fake "pack" built out of 20 no-name 18650 cells connected (spot-welded) to a short strip of the 5P continuous nickel fuse roll from batteryhookup. The cells were welded only on the positive side with a small heater attached to the negative side of a single cell in order to simulate a "heater" cell. The cells used were junk cells having 0V and no charge in them for safety. The following image illustrates the experimental setup:

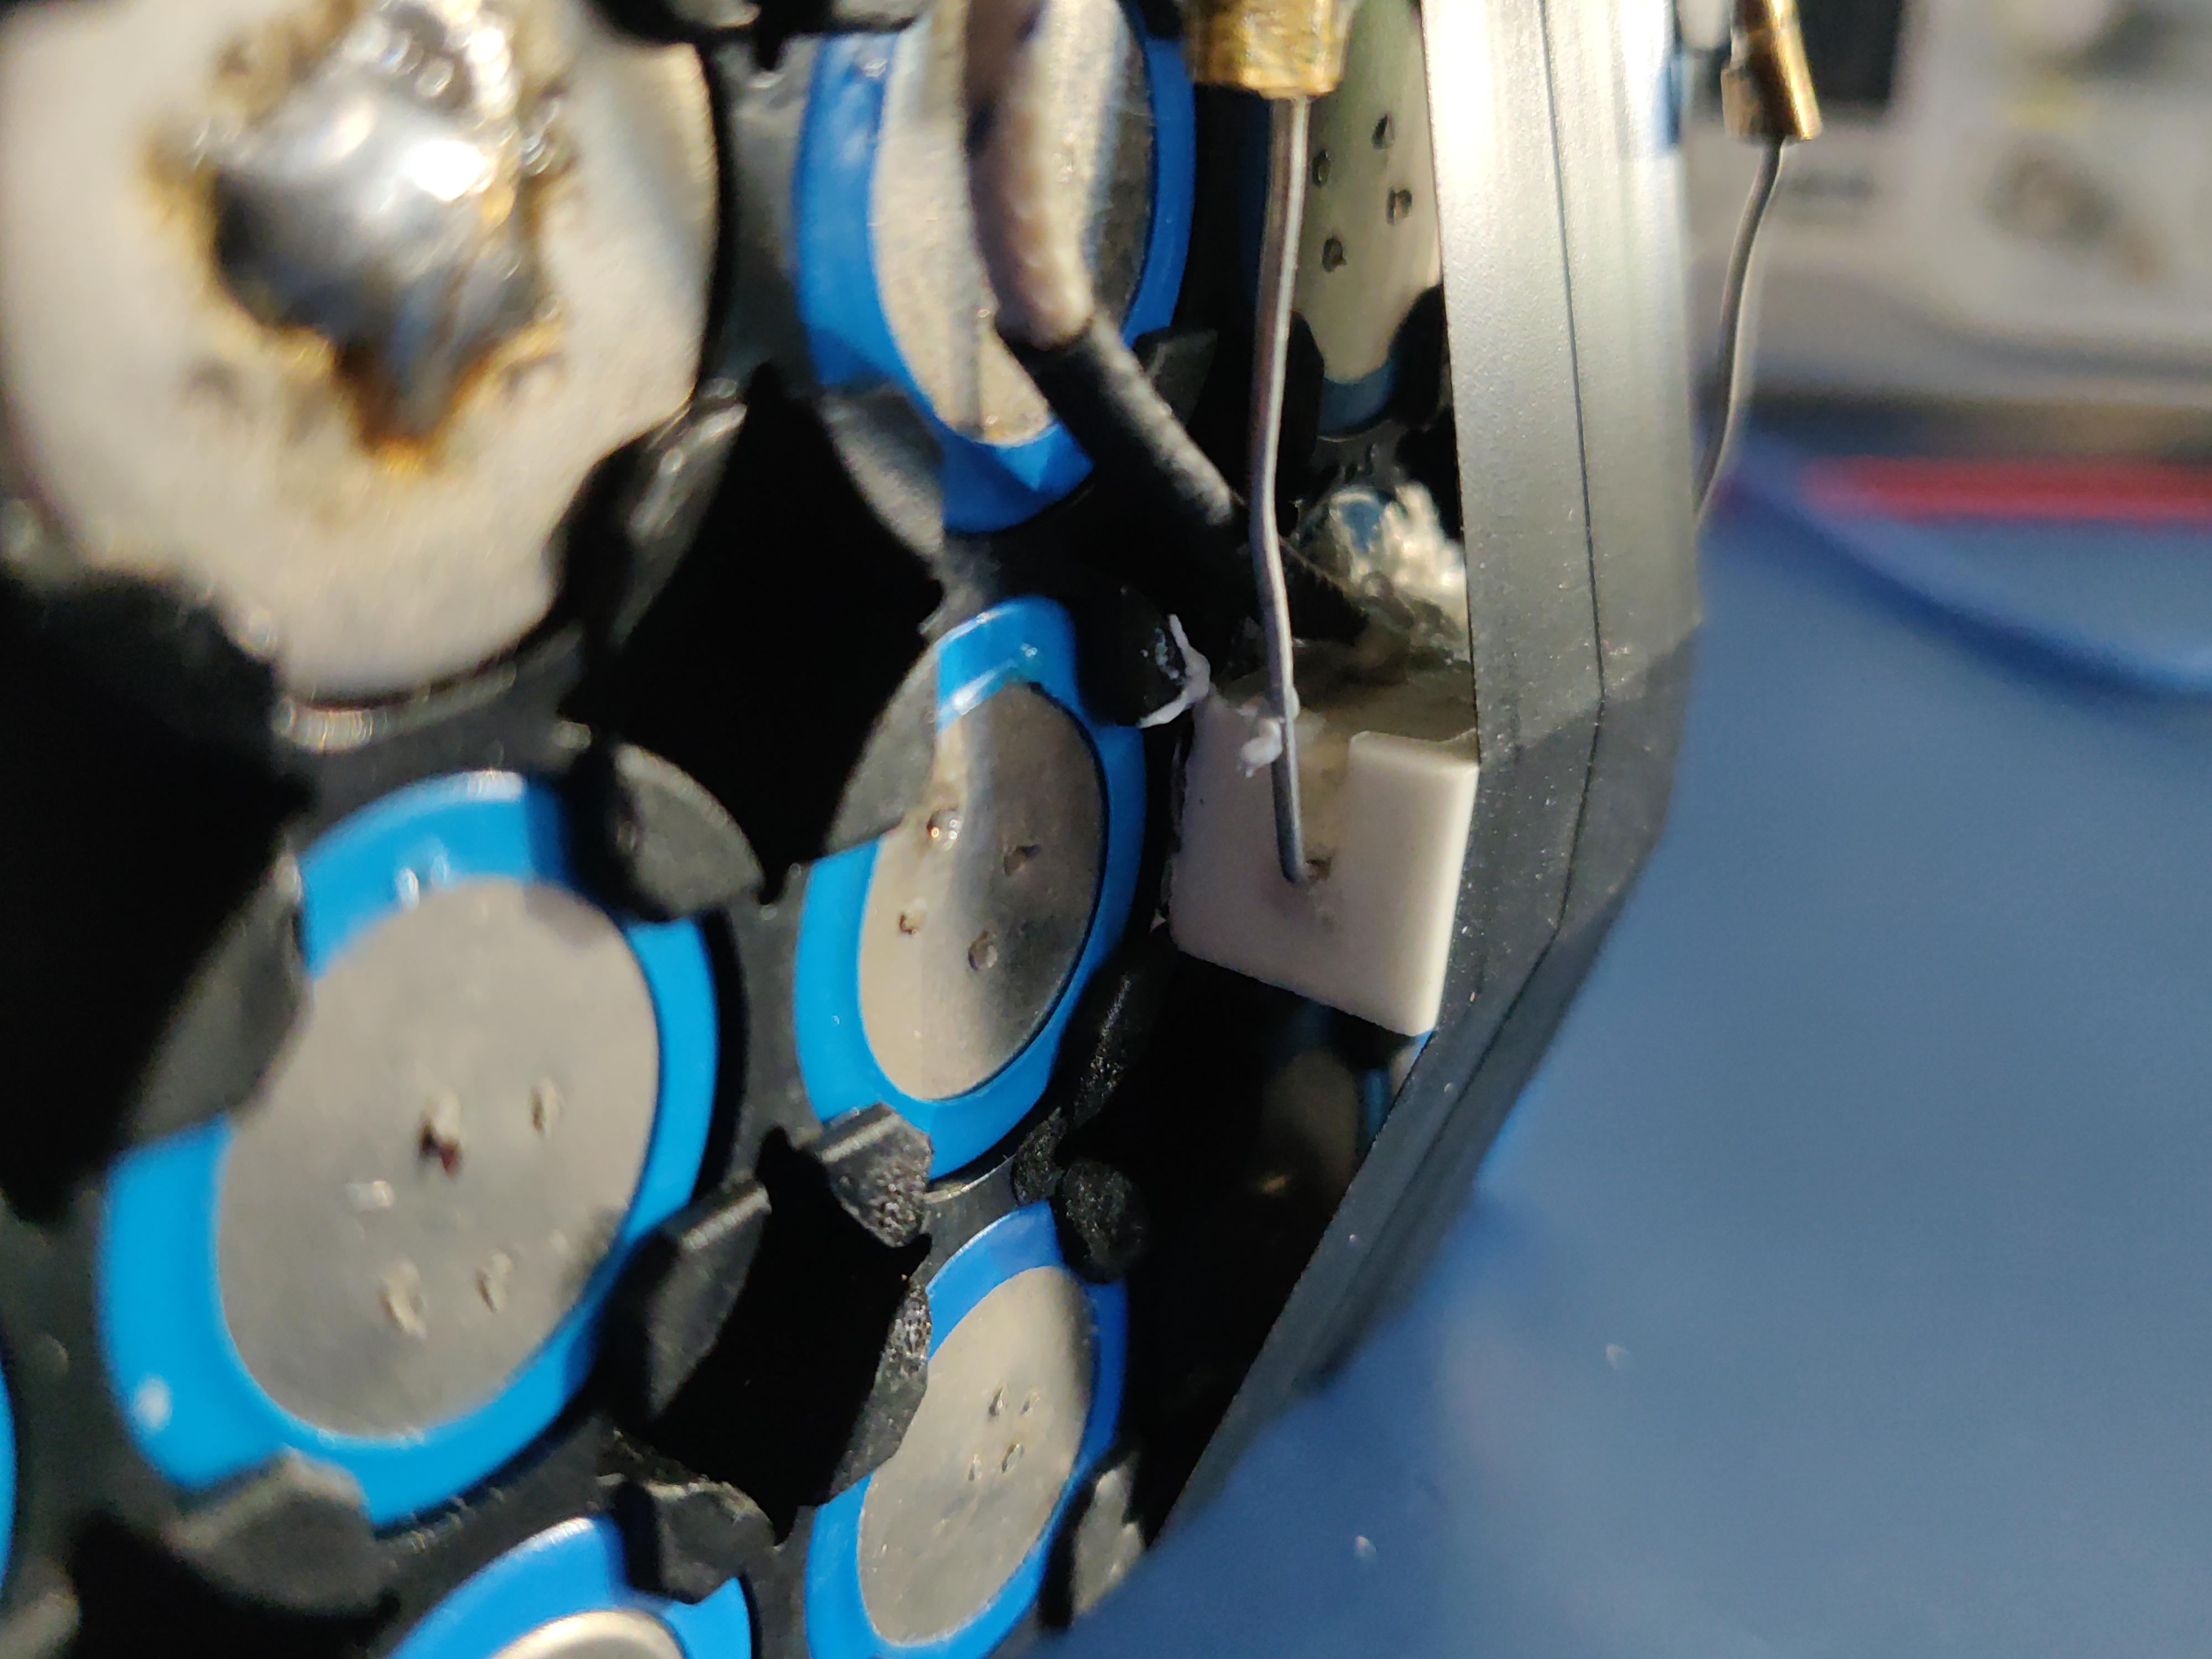
The heater assembly consists of a 10 Ohm / 5W resistor attached to the negative side of a single cell with thermally-conductive adhesive. A MOSFET is used to regulate the current flowing through the resistor with PWM. An K-type thermocouple is attached to the cell next to the heater resistor in order to for a closed feedback loop to stabilise the heater temperature. The temperature from the thermocouple is being read using a MAX6675 breakout board. The top PCB contains five LM75 I2C temperature sensors soldered in a very simple chain:
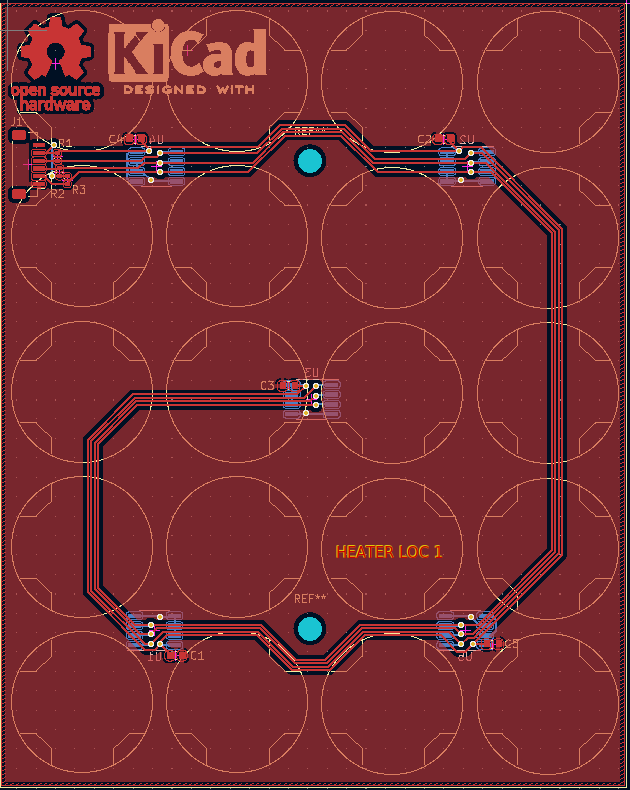
The temperature sensors are labeled U1-U5 and their relative locations can be seen on the PCB silkscreen. The location of the fake heater cell is indicated with the "HEATER LOC 1" text. During the experimental runs the temperatures read from U1-U5 sensors are logged into a CSV file for analysis. The assembled experimental setup can be seen below:
4 Software
The experiment is being controlled by an Arduino sketch which performs the following functions:
- regulates the heater temperature using a very primitive PID regulator driving a PWM output regulating current flow through the heater resistor
- periodically reads out all temperature readings and prints them on the serial port
The code for the Arduino project can be downloaded for reference. The most critical part (the main loop) is shown below:
void loop() {  float temp = thermocouple.readCelsius();
  float deltaT = target_temp - temp;
  float pwm_drive = min( max(deltaT * P, 0), 1023);
  // read temperatures for the ZIF-20C-TEMP board  float temp_U1 = U1.readTemperatureC();  float temp_U2 = U2.readTemperatureC();  float temp_U3 = U3.readTemperatureC();  float temp_U4 = U4.readTemperatureC();  float temp_U5 = U5.readTemperatureC();
  Serial.print("target_temp[degC] = ");  Serial.print(target_temp);  Serial.print("\ttemp[degC] = ");  Serial.print(temp);  Serial.print("\tpwm[%] = ");  Serial.print(map(pwm_drive, 0, 1023, 0, 100));  Serial.print("\tU1[degC] = ");  Serial.print(temp_U1);  Serial.print("\tU2[degC] = ");  Serial.print(temp_U2);  Serial.print("\tU3[degC] = ");  Serial.print(temp_U3);  Serial.print("\tU4[degC] = ");  Serial.print(temp_U4);  Serial.print("\tU5[degC] = ");  Serial.print(temp_U5);  Serial.println();
  analogWrite(heaterON, pwm_drive);  // For the MAX6675 to update, you must delay AT LEAST 250ms between reads!  delay(300);
}
The data printed by the Arduino code was monitored, plotted and logged using QtSerialMonitor which I unfortunately had to build from source code myself. An example data point gathered in the CSV file is presented below: ...
Read more »
 James Klein
 Arnov Sharma
 Ahmad Radhy
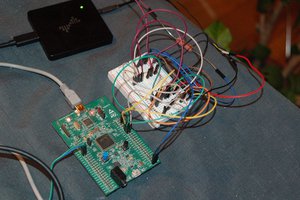
 Travis Bemann