Summary
These modeling tools follow the block diagram shown below. All of the threads combine to form the "system." This is powered from battery through a regulator. Future features may be added to support more complicated topologies, but this covers many, many designs. The regulator is simple. Currently it simple has a single efficiency number, where 0% corresponds to a linear regulator and 100% efficiency corresponds to an ideal switching regulator. No dynamics, dropout, maximum current capability, efficiency vs. current curve, or other capabilities are currently implemented. Some of these may be added in the future
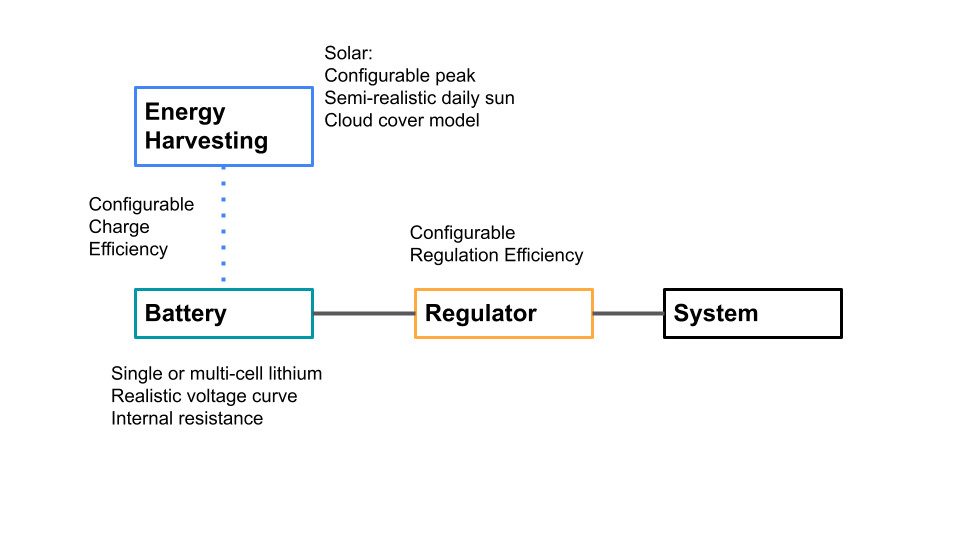
Battery
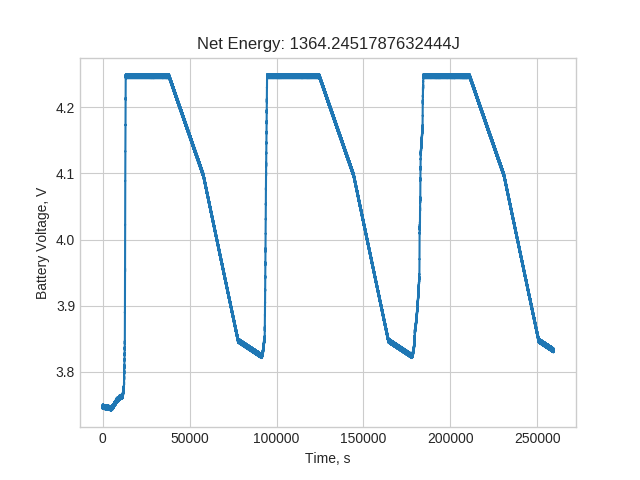
Currently, single and multi-cell lithium batteries are supported. The user selects the number of cells, rated capacity, charge level at the start of simulation, and internal resistance. As the simulation progresses, the battery is charged and discharged. It cannot be charged more than full. This is obvious, but important and sometimes ignored by novices when specifying solar powered systems -- energy can be wasted if there is nowhere to store it. A piecewise linear typical discharge curve is provided, so approximate voltage levels can be seen.
Solar Energy Harvesting Model
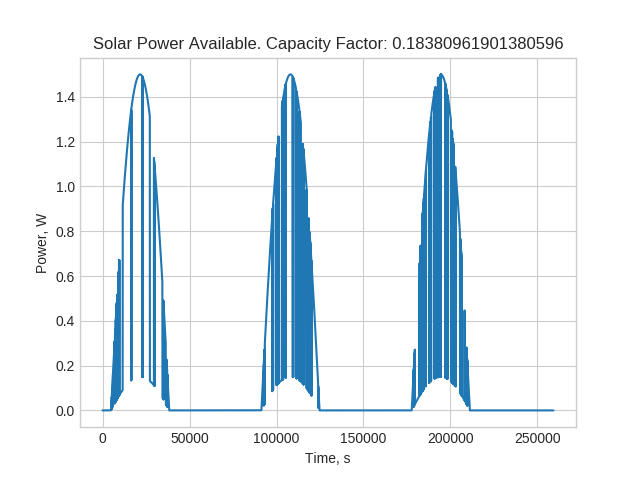
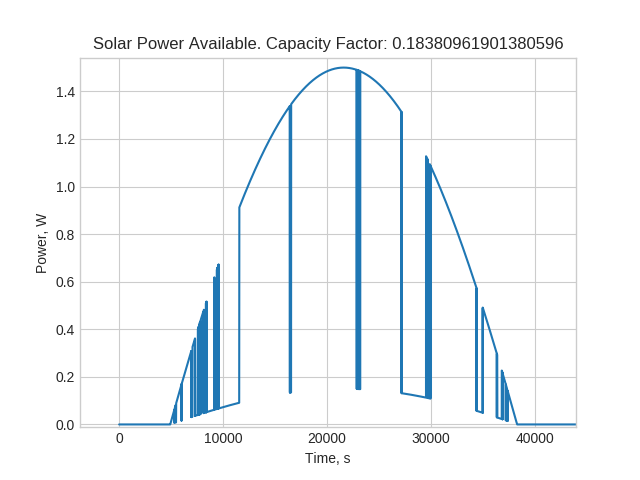
The solar energy model is fairly simple but still capable of representing many real-world phenomena. The user provides a rated power of the panel, which is meant to represent maximum realistic power. Depending on the orientation of the solar panel, this may not be equal to the datasheet value. A very simple peak possible power curve is provided for now, as shown below. The time offset and alpha values can be used to shift the time and season, respectively.
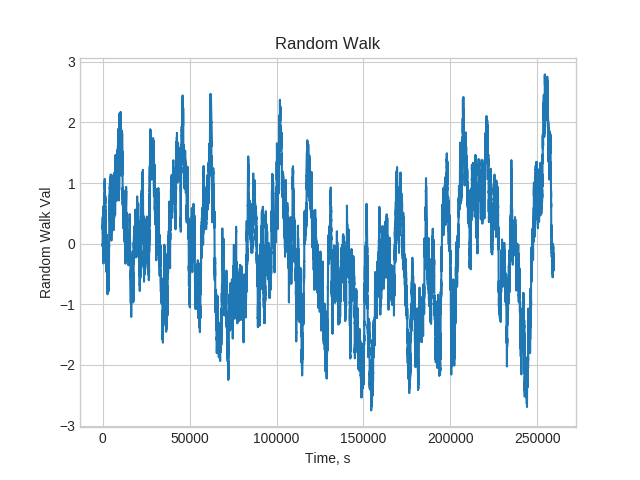
A simple model for cloud cover is also included. The available power is reduced to 10% of the sunlight if under clouds. This is a reasonable value based on my SOL sensor. The presence of cloud cover is determined by whether or not the absolute value of an exponentially correlated random walk process is outside of some set bounds. This process is set up as follows, where g is drawn from a normal distribution with zero mean and standard deviation of one.
The time constant can be used to tune the frequency of clouds, and the threshold value can be used to adjust how much of the day is covered by clouds. The random walk process and corresponding solar power profiles are shown next.
Discussions
Become a Hackaday.io Member
Create an account to leave a comment. Already have an account? Log In.