 Mark Gilliland
This project started as a class project for school, but I expanded on it to make it into a full-fledged "Bench Buddy" that aids in sourcing and measuring signals on your EE workbench.
Background
For my PCB Design class at the Colorado School of Mines, we were given a schematic for a power supply with the following characteristics:
- 0-10V, 0-1A adjustable (by potentiometer) output
- 12V wall-wart input
- VU-meter style current/voltage meter (an LED bar graph)
We drew the PCB design ourselves in EAGLE.
My Additions
I decided to add my own tweaks to the design, so I added a Data Acquisition daughter board that features:
- USB control of the power supply
- Measurement of the voltage and current sourced
- Conditioned AINs
- Digital I/O
- "FGEN" output (High Speed DAC)
- Isolated USB control (so USB ground can be ±100V (ish) above or below the power supply GND without causing issues)
On the main board, I added:
- 3.3V and 5V regulated supplies (just a 1A rated linear regulator)
- PTC fuses to protect the wall-wart supply
- Control to switch between PC-controlled and manual-controlled power supply
PCB
The PCBs were designed in EAGLE and the files are available on GitHub here
Code
I wrote the firmware for the DAQ in C (arduino), and it is linked in the project and can be accessed via git here in the folder BenchBuddyArduino
I wrote the Graphical User Interface in Visual C# (with Visual Studio) and it is linked here, in the same git repo but in the directory BenchBuddyUI
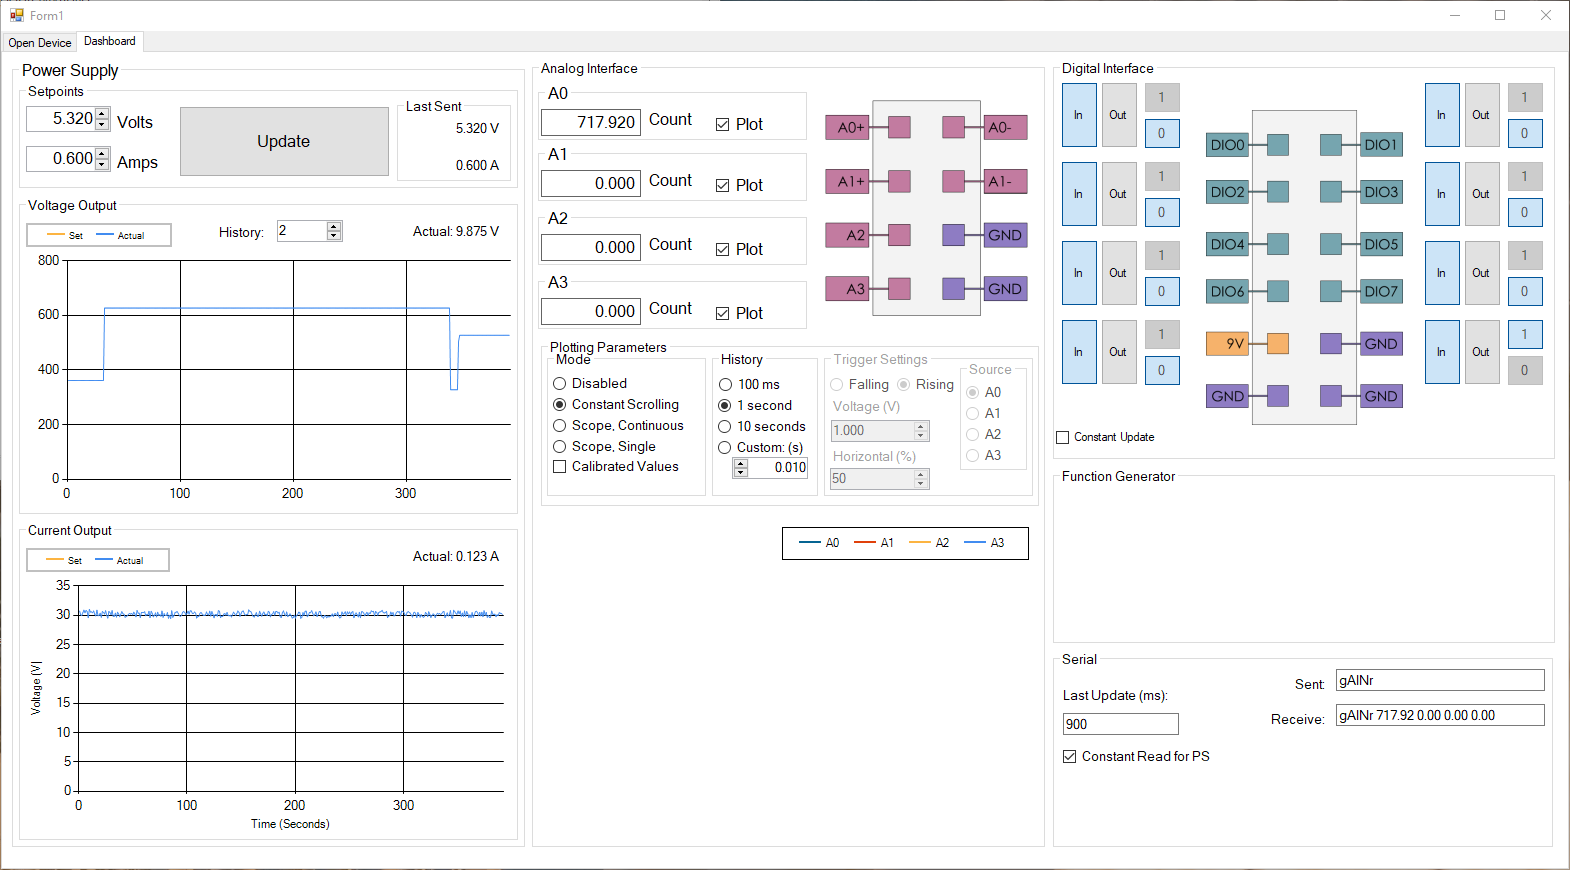
Code that is finished:
- 0-10V 0-1A power supply
- Has calibration constants implemented for output, not for readback
- Can be changed via the GUI
- The value can be measured and shown in the GUI
- A graph of the actual value is shown in the display
- Raw analog display in the GUI.
- A little more work is needed to get the (calibrated) value in volts to update in the GUI, but the calibration is mostly implemented in the firmware.
- The value is automatically updated in the GUI (just in ADC counts right now)
- Multiple readings are taken, then an average is taken and communicated, adding a little more resolution to the AIN measurements.
- Digital I/O, both direction and state can be set in the GUI
Code that needs to be finished:
- Plotting of the analog values over time (similar to a low-speed oscope)
- Most of the "analog plotting" section of the GUI
- Baud switching was implemented in my python testbed, but it is buggy in the GUI.
- The DAQ board starts up in 2400 baud but a command can be sent to switch it to higher bauds. This was successfully implemented in my python testbed code custom_serial_tools.py
 Ben Holmes
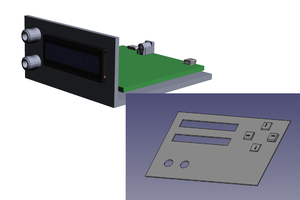
 Ashley Robinson
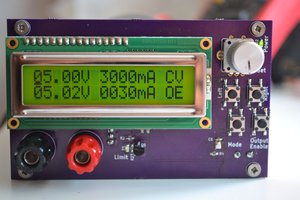
 Elia
Elia
 oneohm