 alex.miller
Story
I’d like to share my experiment on how to easily create your own tiny machine learning model and run inferences on a microcontroller to detect the concentration of various gases. I will illustrate the whole process with my example of detecting the concentration of benzene (С6H6(GT)) based on the concentration of other recorded compounds.
To my mind, such simple solutions may contribute to improving the air pollution problem which now causes serious concerns. In fact, the World Health Organization estimates that over seven million people die prematurely each year from diseases caused by air pollution. Can you imagine that?
As such, more and more organizations, responsible for monitoring emissions, need to have effective tools at their disposal to monitor the air quality in a timely way, and TinyML solutions seem to be the best technology for that. They are quite low-energy and cheap to produce, as well as they don’t require a permanent Internet connection. I believe these factors will promote the mass implementation of TinyML as a great opportunity to create AI-based devices and successfully solve various challenges.
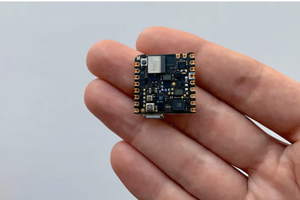
Therefore, in my experiment, I take the most primitive 8-bit MCU to show that even such a device today can have ML models in it.
Dataset description:
My dataset contained 5875 rows of hourly averaged responses from an array of oxide chemical sensors that were located on the field in a polluted area in Italy, at road level. Hourly averaged concentrations for CO, Non-Metanic Hydrocarbons, Benzene, Total Nitrogen Oxides (NOx), and Nitrogen Dioxide (NO2) were provided.
It is a regression problem.
Target metric – MAE (Mean Absolute Error). Target - C6H6(GT).
Attribute Information:RH - Relative Humidity
AH - Absolute Humidity
T - Temperature in °C;
PT08.S3(NOx) - Tungsten oxide. Hourly averaged sensor response (nominally NOx targeted);
PT08.S4(NO2) - Tungsten oxide. Hourly averaged sensor response (nominally NO2 targeted);
PT08.S5(O3) - Indium oxide. Hourly averaged sensor response (nominally O3 targeted);
PT08.S1(CO) - (Tin oxide) hourly averaged sensor response (nominally CO targeted);
CO(GT) - True hourly averaged concentration CO in mg/m^3 (reference analyzer);
PT08.S2(NMHC) - Titania. hourly averaged sensor response (nominally NMHC targeted);
You can see more details and download the dataset here: https://archive.ics.uci.edu/ml/datasets/air+quality
Procedure:
Model Training
The model was created and trained with a free tool, Neuton TinyML, as I needed a super compact model that would fit into a tiny microcontroller with 8-bit precision. I tried to make such a model with the help of TensorFlow before, but it was too large to run operations on 8 bit.
To train the model, I converted the dataset into a CSV file, uploaded it to the platform, and selected the column that should be trained to make predictions.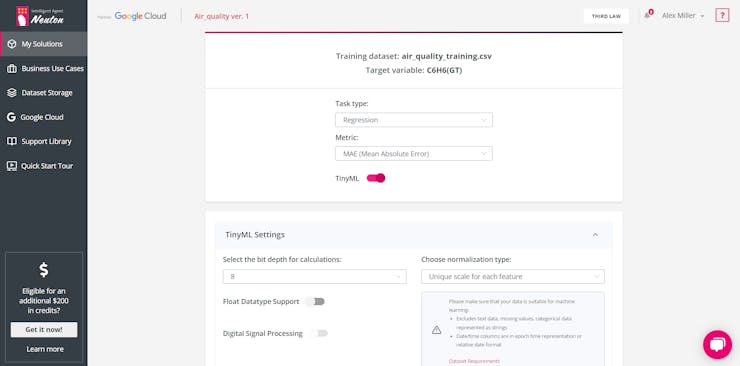
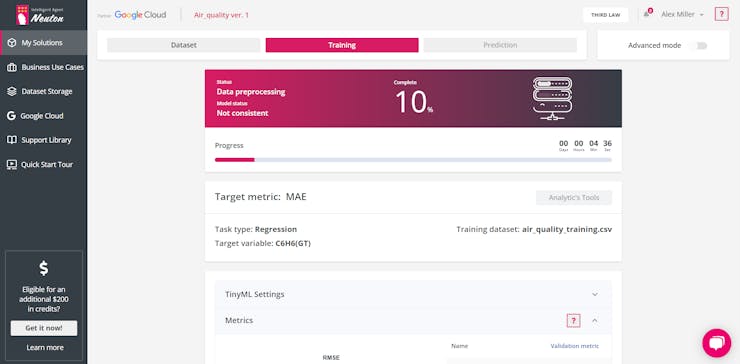
The trained model had the following characteristics: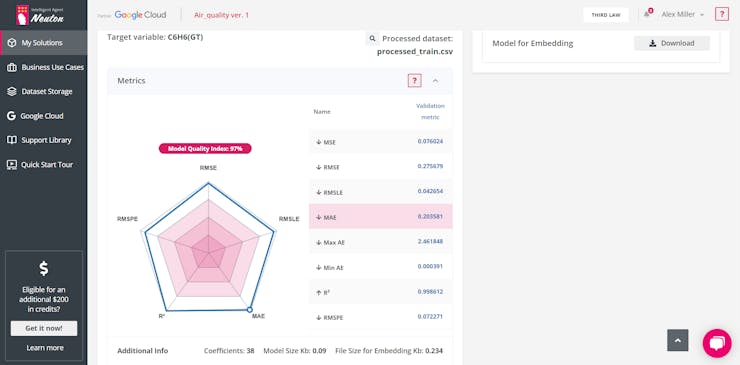
The model turned out to be super compact, having only 38 coefficients and 0.234 KB in size!
Additionally, I created models with TF and TF Lite and measured metrics on the same dataset. The comparison speaks louder than words. Also, as I said above, TF models still cannot run operations on 8 bits, but it was interesting for me to use just such a primitive device.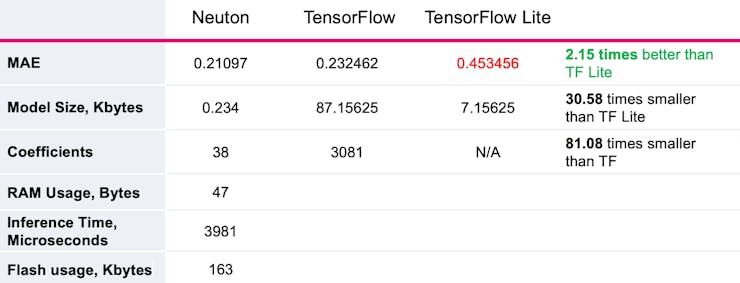
Embedding into a Microcontroller
Upon completion of training, I downloaded the archive which contained all the necessary files, including meta-information about the model in two formats (binary, and HEX), calculator, Neuton library, and the implementation file.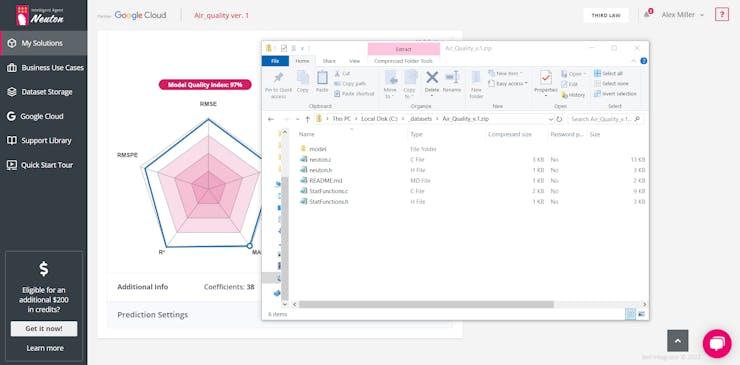
Since I couldn’t run the experiment in field conditions with real gases, I developed a simple protocol to stream data from a computer.
Step 3: Running Inference on the Microcontroller
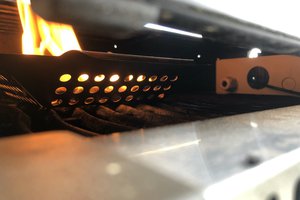
I connected a microcontroller on which the prediction was performed to a computer via a serial port, so signals were received in a binary format.
The microcontroller...
Read more »

 Stefan Blattmann
You could try to do your own project with Neuton on http://neuton.ai