It's very common to use a serial connection to your laptop for debugging with printf statements. This is usually okay when the stuff that is being done is slower than the serial connection. When working with interrupt driven code and fast signals the serial connection will cause disturbances and bugs that happen due to timing issues. In other words your debbugging code will be working against you.
Flipping pins to blink LEDs is another approach that works well for showing that a certain state in the program has been reached. This causes very little disturbance as it only takes one opcode to switch a pin state. However, when interrupts are happening at 10KHz, the human eye will not be able to perceive those blinks.
This is where it's good to have access to an oscilloscope or a logic analyzer. They can be found in schools, universities, hacklabs, and in Helsinki even in some libraries. Don't be afraid to ask for them, they are very often not in active use. In the scale of oscilloscopes a 100KHz TWI signal is slow, as they are often able to sample at several MHz.
When I'm debugging my TWI signal handler interrupts I'd switch the state of a pin every time an interrupt routine is entered and exited. From a programming point of view this is not different from blinking LEDs. Since I have access to an oscilloscope with many digital inputs I simply use a separate pin for every individual interrupt. This way I can very easily see on my oscilloscope screen when each of my interrupt routines are executing and locate errors. As I'm also showing the data and clock signals on the oscilloscope I can verify that operations happen when they are supposed to. Since I can capture a burst of signals and analyze it statically, my human eyes are well capable of understanding what is happening.
If you've never worked with oscilloscopes, do try it out. Learn how to use triggers and set it up to catch the part that you are debugging. This might be overkill for many projects but for some you just can't do without it.
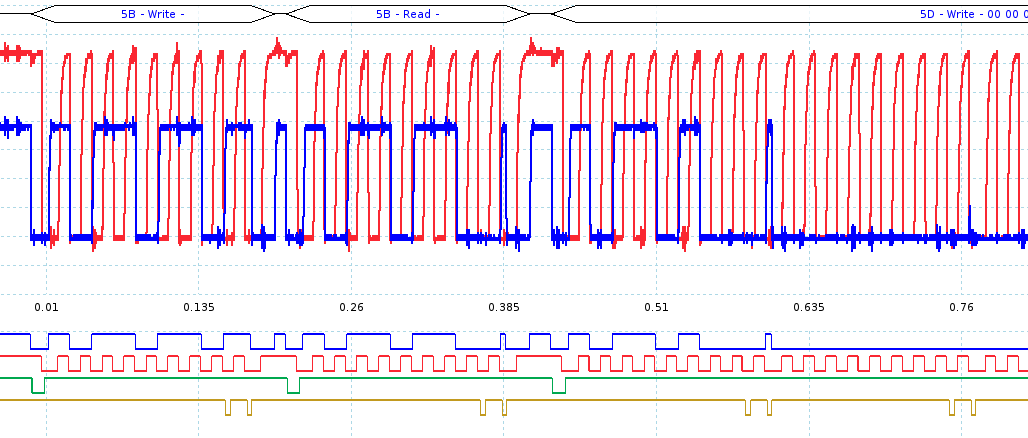
blue:SDA, red:SCL, green:TWI start condition interrupt, yellow:TWI byte/ack received interrupt
Discussions
Become a Hackaday.io Member
Create an account to leave a comment. Already have an account? Log In.