 Sam Griffen
As this project was accellerated by working on it as a self directed study during the final year of my degree, I have written reports detailing the process. This log effectively just summarises my Blade Design report, found here.
One of the most important aspects of a wind turbine is the efficiency with which energy can be extracted from the wind. A large part of this efficiency depends on the aerodynamic properties and configuration of the blades. It is therefore critical that any turbine design considers the impact of all relevant blade parameters, and implements some process to optimise aerodynamic efficiency.
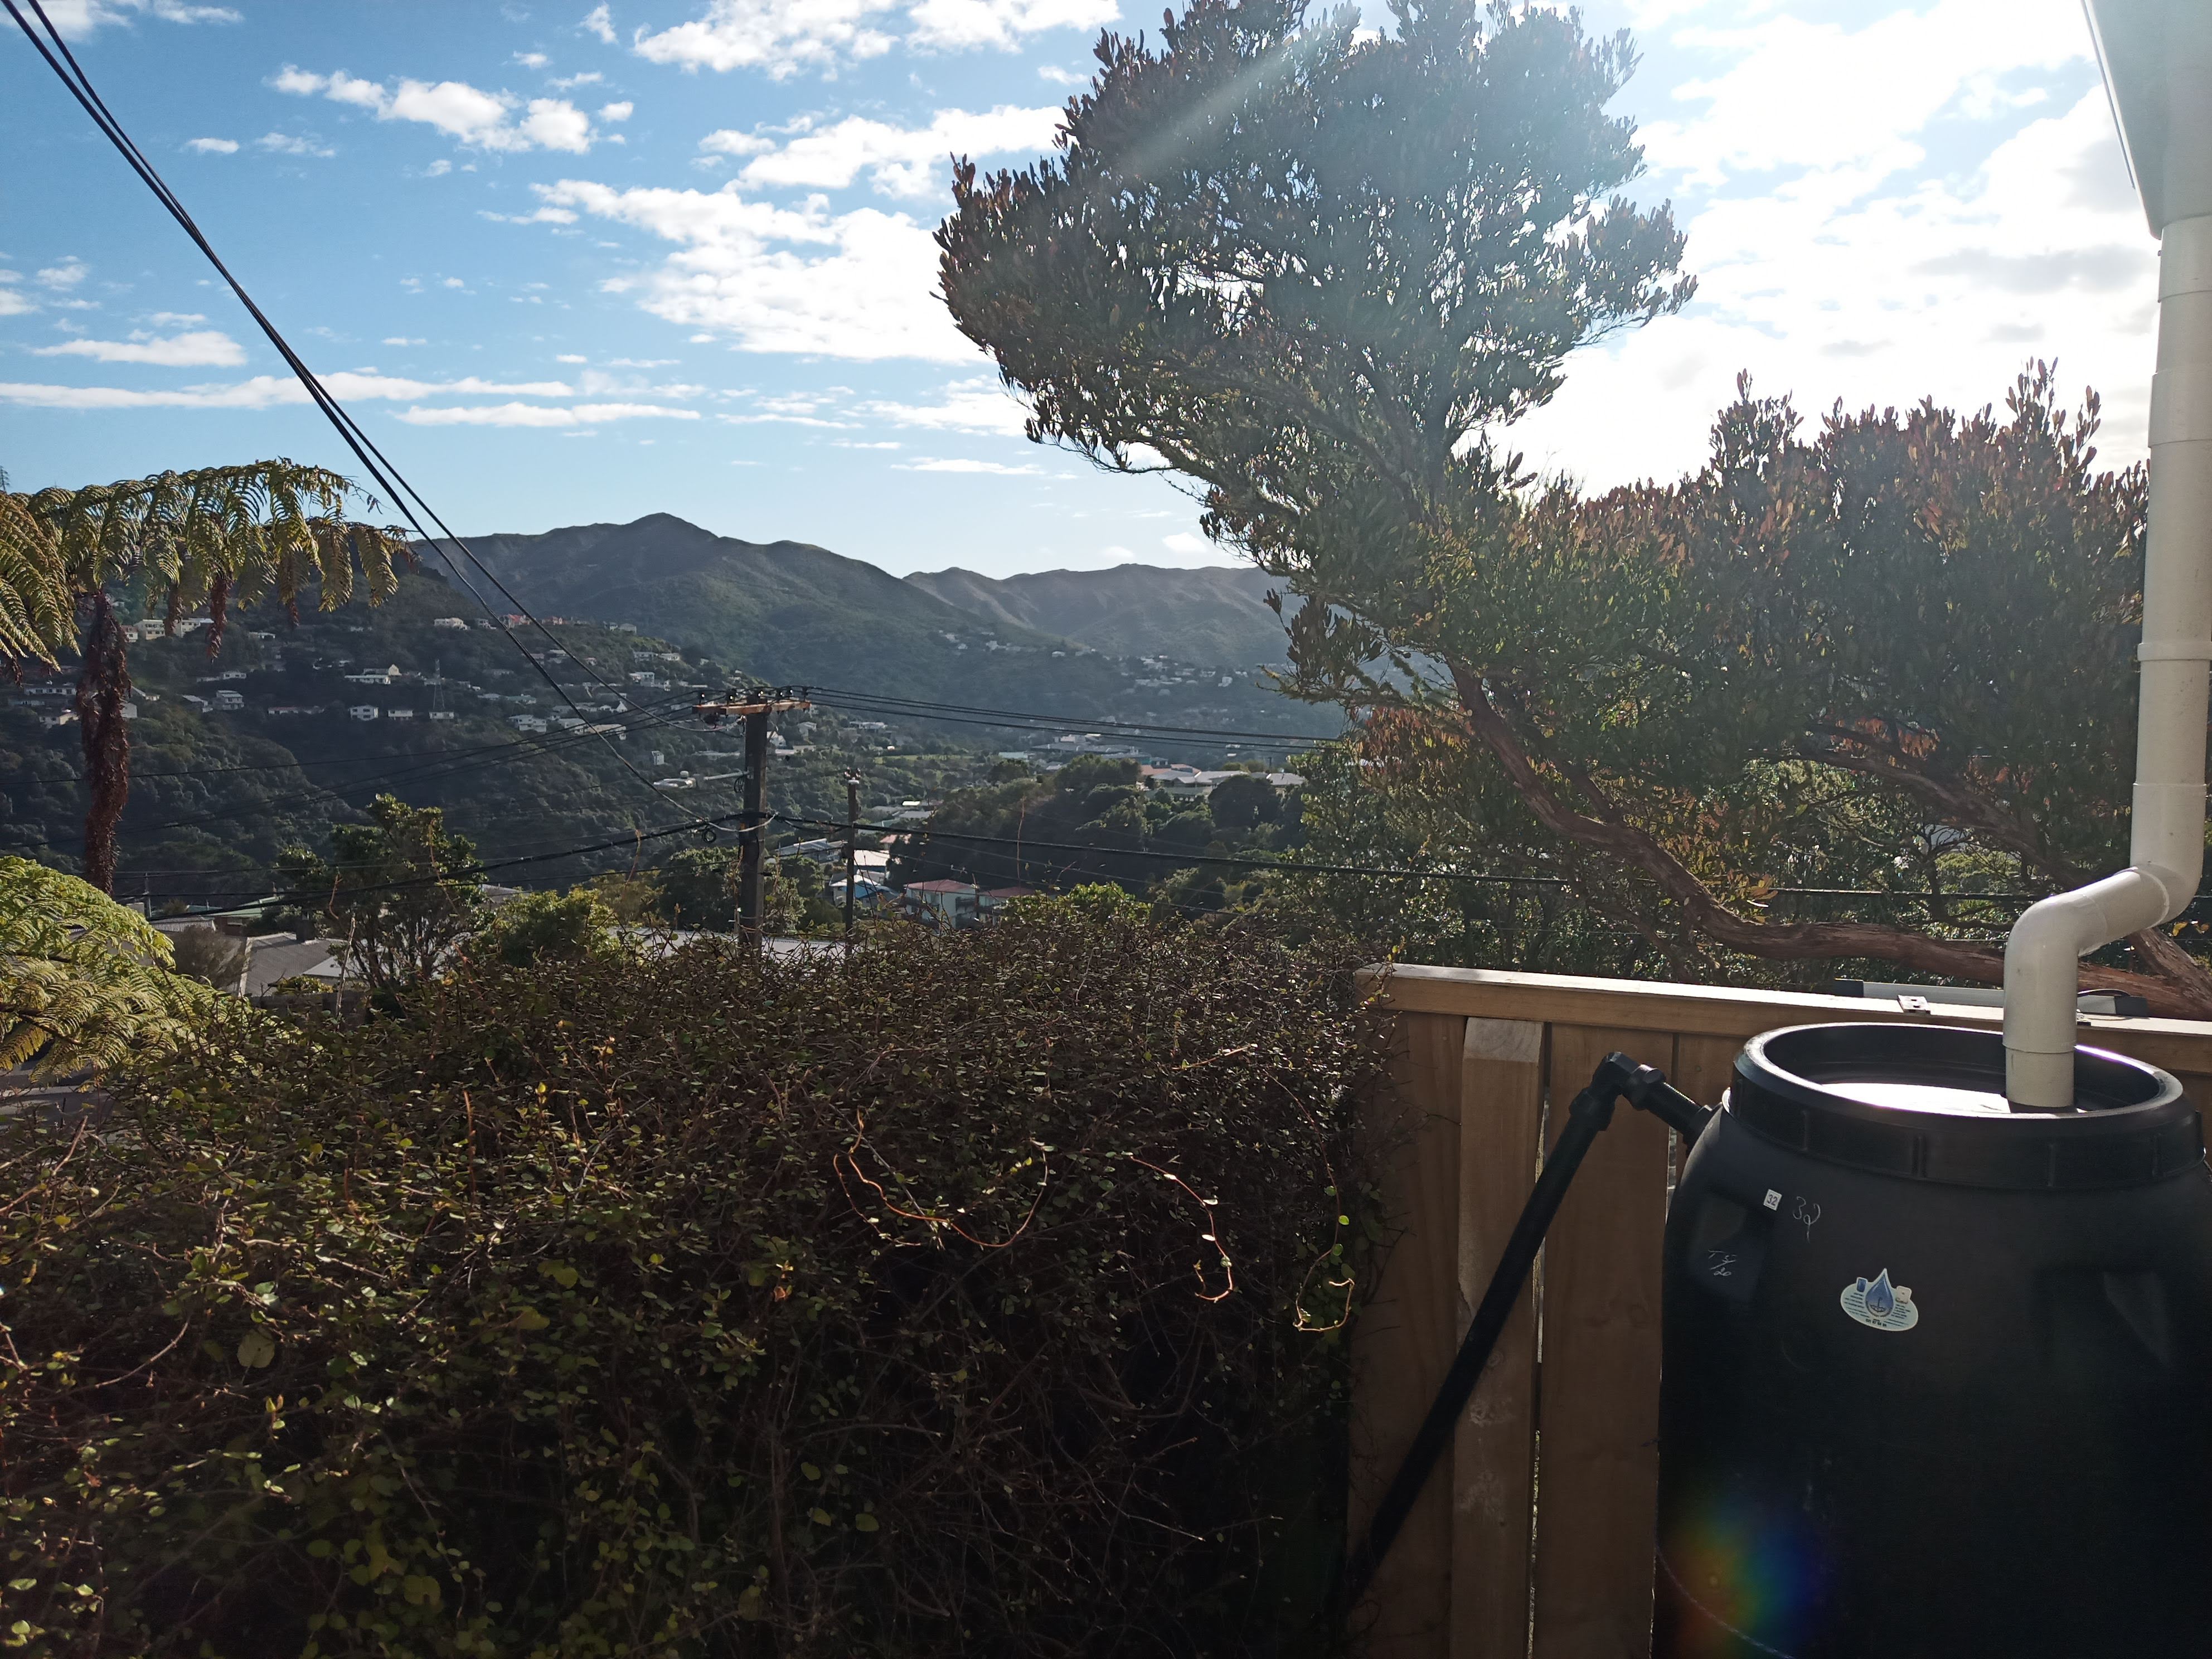
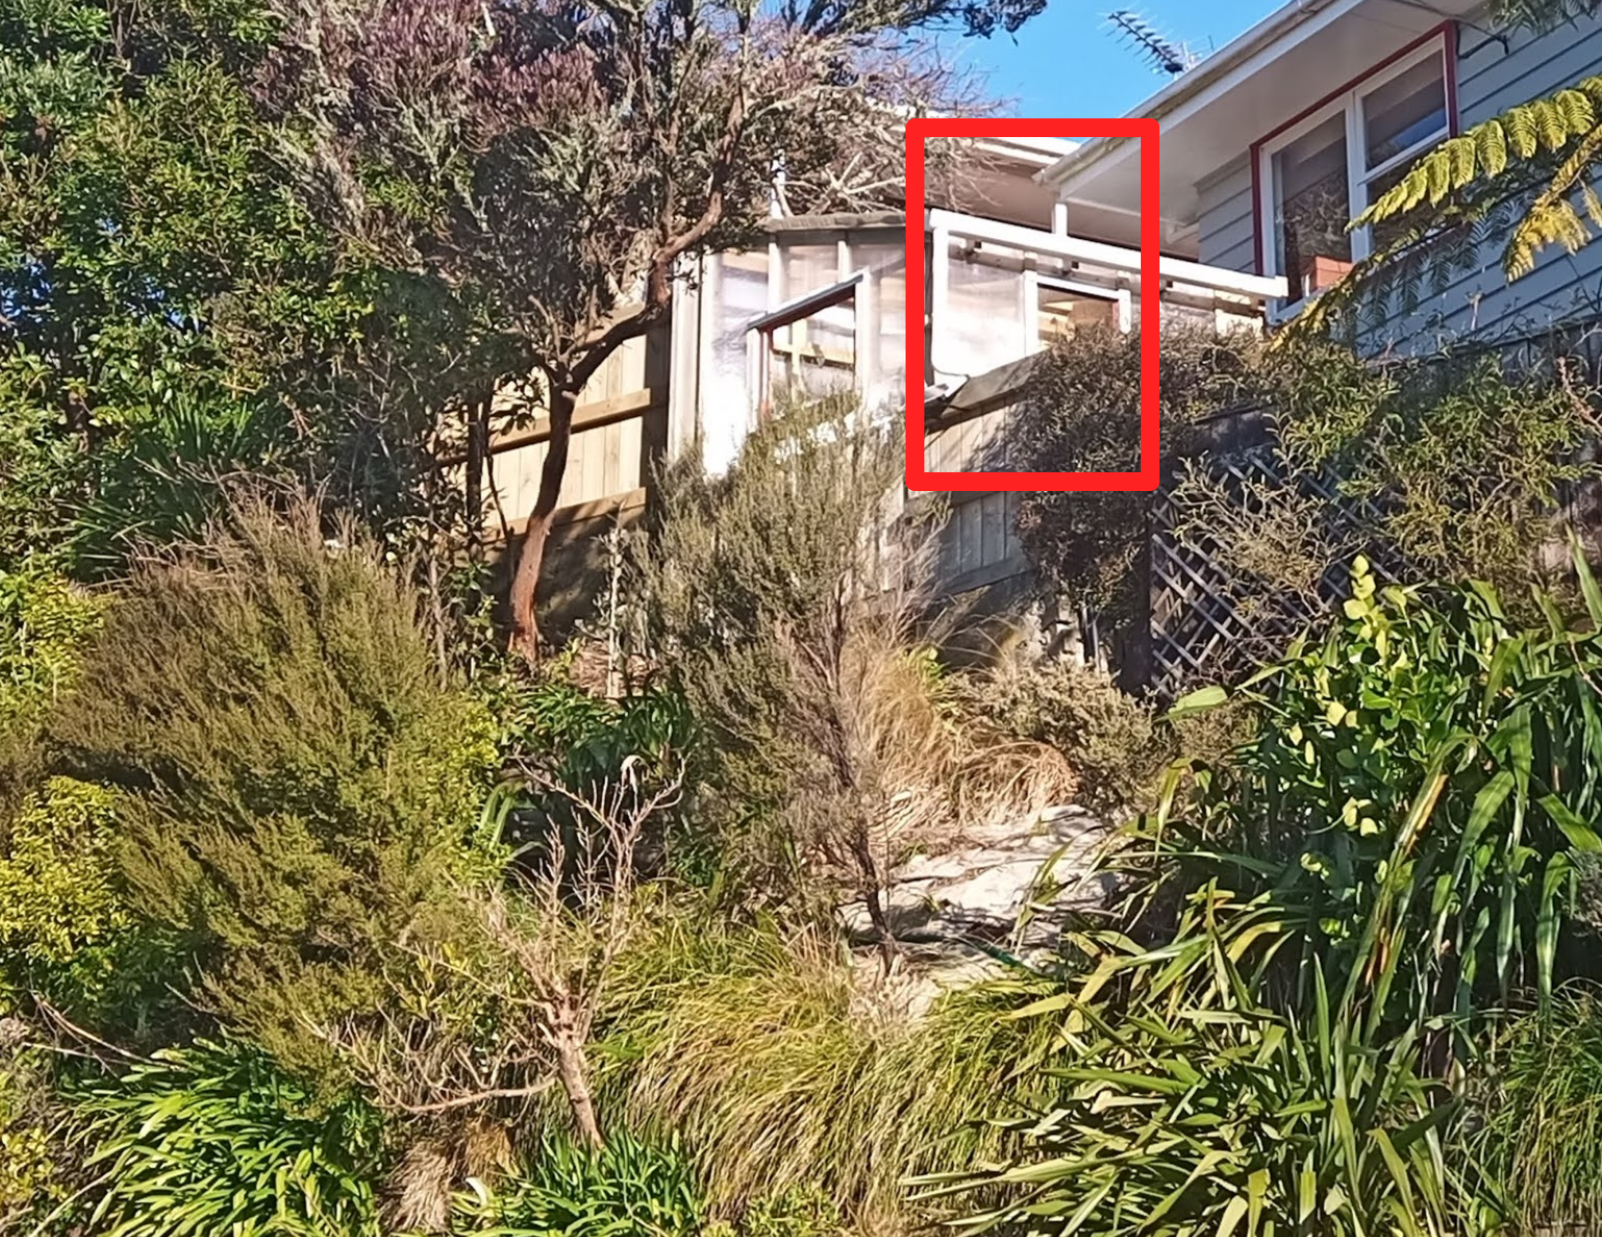
For the design of this turbine design there was one location suitable for installation. The goal of this setup is to provide power for a small greenhouse, and the fenceline adjacent to the greenhouse is exposed to a large amount of wind. There is no other really suitable location for a turbine on the property, and therefore there wasn't much opportunity to analyse various positions.
The images below show the location for installation:
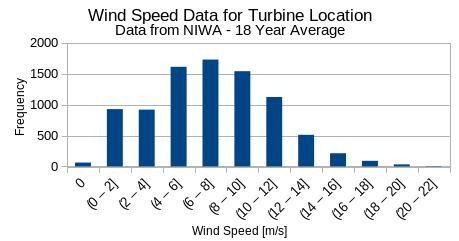
Analysis of the wind resource in this location couldn't be completed in detail, so NIWA data has been used for the local area to estimate an average windspeed. This analysis showed that the average windspeed is approximately 7m/s,
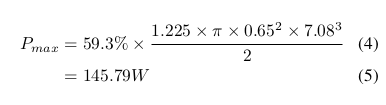
With this average windspeed analysis completed, the theoretical absolute maximum power output was calculated as 145W (Figure 4). This is significantly more than the greenhouse would need to operate, which is good as the turbine is unlikely to achieve a higher output than 50%-60% of this figure due to losses in the system.
Once I had a model for rough local wind behaviour, I selected a range of airfoils designed for small wind turbines, and airfoils that have been recommended for small wind turbines. For further detail on airfoil selection, refer to the full report, pages 5-6.
Each of these airfoils has been recommended as a turbine airfoil, however it was not feasible to fabricate a blade with each to test. Therefore a simulation package called QBlade was utilised to produce drag polars and glide coefficient vs angle of attack plots for each airfoil. These results are shown in Figure 6.
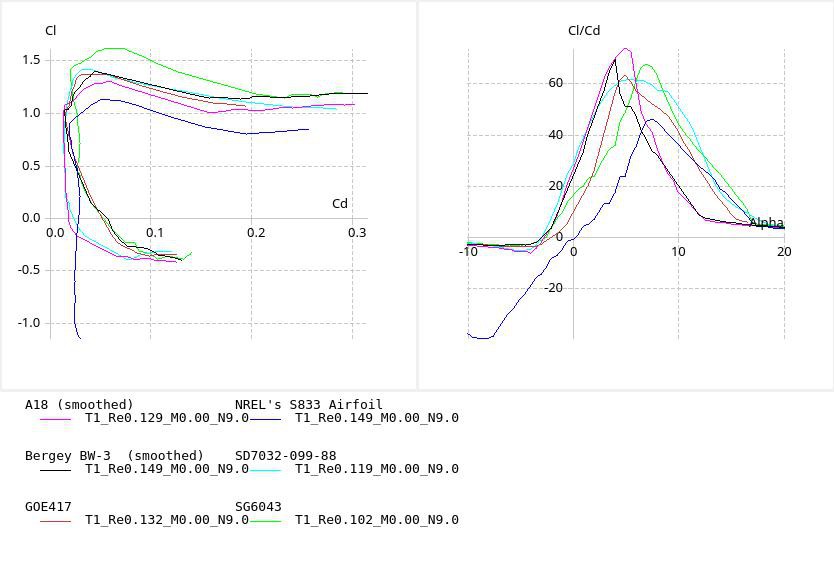
The first plot is referred to as a drag polar. This plot shows a relationship between coefficient of lift (Cl) and coefficient of drag (Cd). In the literature there is discussion of a wide "drag bucket" being a desirable trait for turbine blades, which leads to an minimal drag coefficient over a wide range of conditions. For more on this see page 6-7 of my report.
In the second plot, there is a more useful representation of airfoil behaviour. This plot shows how the glide ratio (Cl/Cd) changes with angle of attack (Alpha). Figure 7 shows how angle of attack is defined (for more detail see page 1 of my report). With these values in mind, the second plot shows for what range of relative wind vectors the blade will have maximum lift, and therefore produce maximum torque.
Airfoils with a high peak are good as they represent a larger lift output for the given windspeed. However, it is important to acknowledge the fact that a wide peak is almost as important. A wide peak means that the airfoil will have an optimal glide ratio (and therefore optimal lift) for a wider range of relative wind vectors. This is desirable, as the relative wind vector will change based on rotor velocity, which means that for varying windspeeds the turbine will have good energy output.
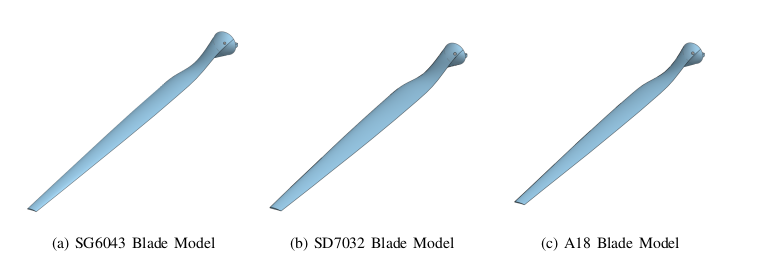
Of the airfoils analysed, three were selected to be modelled into blades and fabricated. These are shown in Figure 7. Chord length and twist angles vary along the blade, as relative wind velocity and angle vary for varying rotation radius. A set of equations was found in the book Wind Energy Explained (Referenced in my report). These equations give relative wind angle and chord length for a given distance from the center of the rotor. An excel spreadhseet was developed to calculate these parameters for 10 sections evenly spaced along the blade.
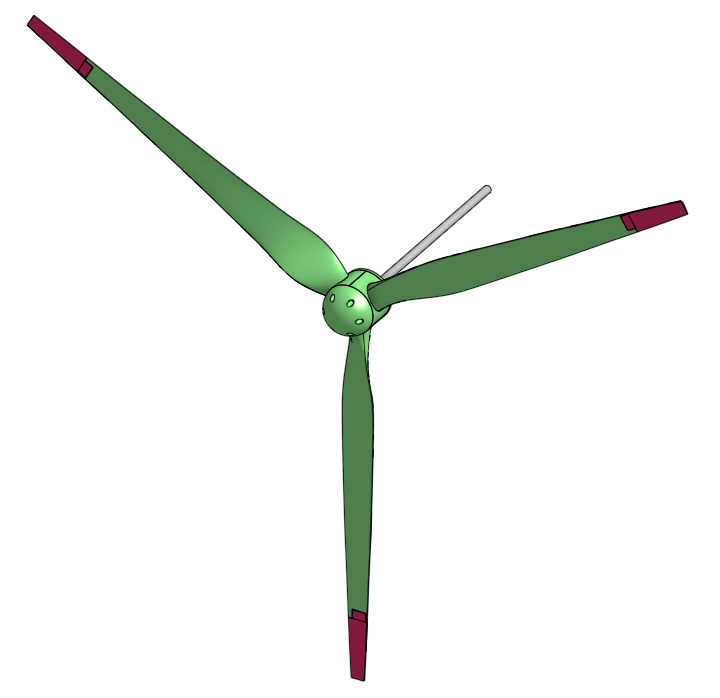
Blades were designed to be screwed into a rotor hub, which was designed to be reused in each blade test. This involved a system of securely bolting blades to the hub in a way that allowed them to be safely removed at a later date. Figure 8 shows blades connected to this rotor hub in the OnShape model (linked on the main project page). Details on this rotor hub can be found in the Integration Report.
With that, the blades were ready for testing. Check out my next log for details on testing the turbine, and the problems I have had.
Cheers!
Discussions
Become a Hackaday.io Member
Create an account to leave a comment. Already have an account? Log In.