One of the areas of sensing that I don't have a lot of experience with is atmospheric sensing. While I've become familiar with sensors for temperature, pressure, and humidity, I am largely inexperienced with the array of sensors available for sensing various gasses or air quality metrics -- in large part because they've appeared too large or too power hungry for a handheld device, and/or generally having issues with accuracy. But clearly measuring air quality is an important social topic, and very useful for science education, and so it'd be great to be able to do this reliably in a small handheld instrument in one's pocket.
I was excited last autumn to see Maxim release the MAX30105 Air Particle Sensor, an extremely small (~6x3x2mm) surface mount sensor listed as being able to detect air particles (they give the example of smoke detection on the product website). I was eager to see how this might work for detecting air particle measures like ambient dust level, or particle counts (e.g. PM2.5, a measure of how many particles are in the air that have a diameter of less than 2.5 microns), so I thought I'd run a few experiments.
A quick first pass
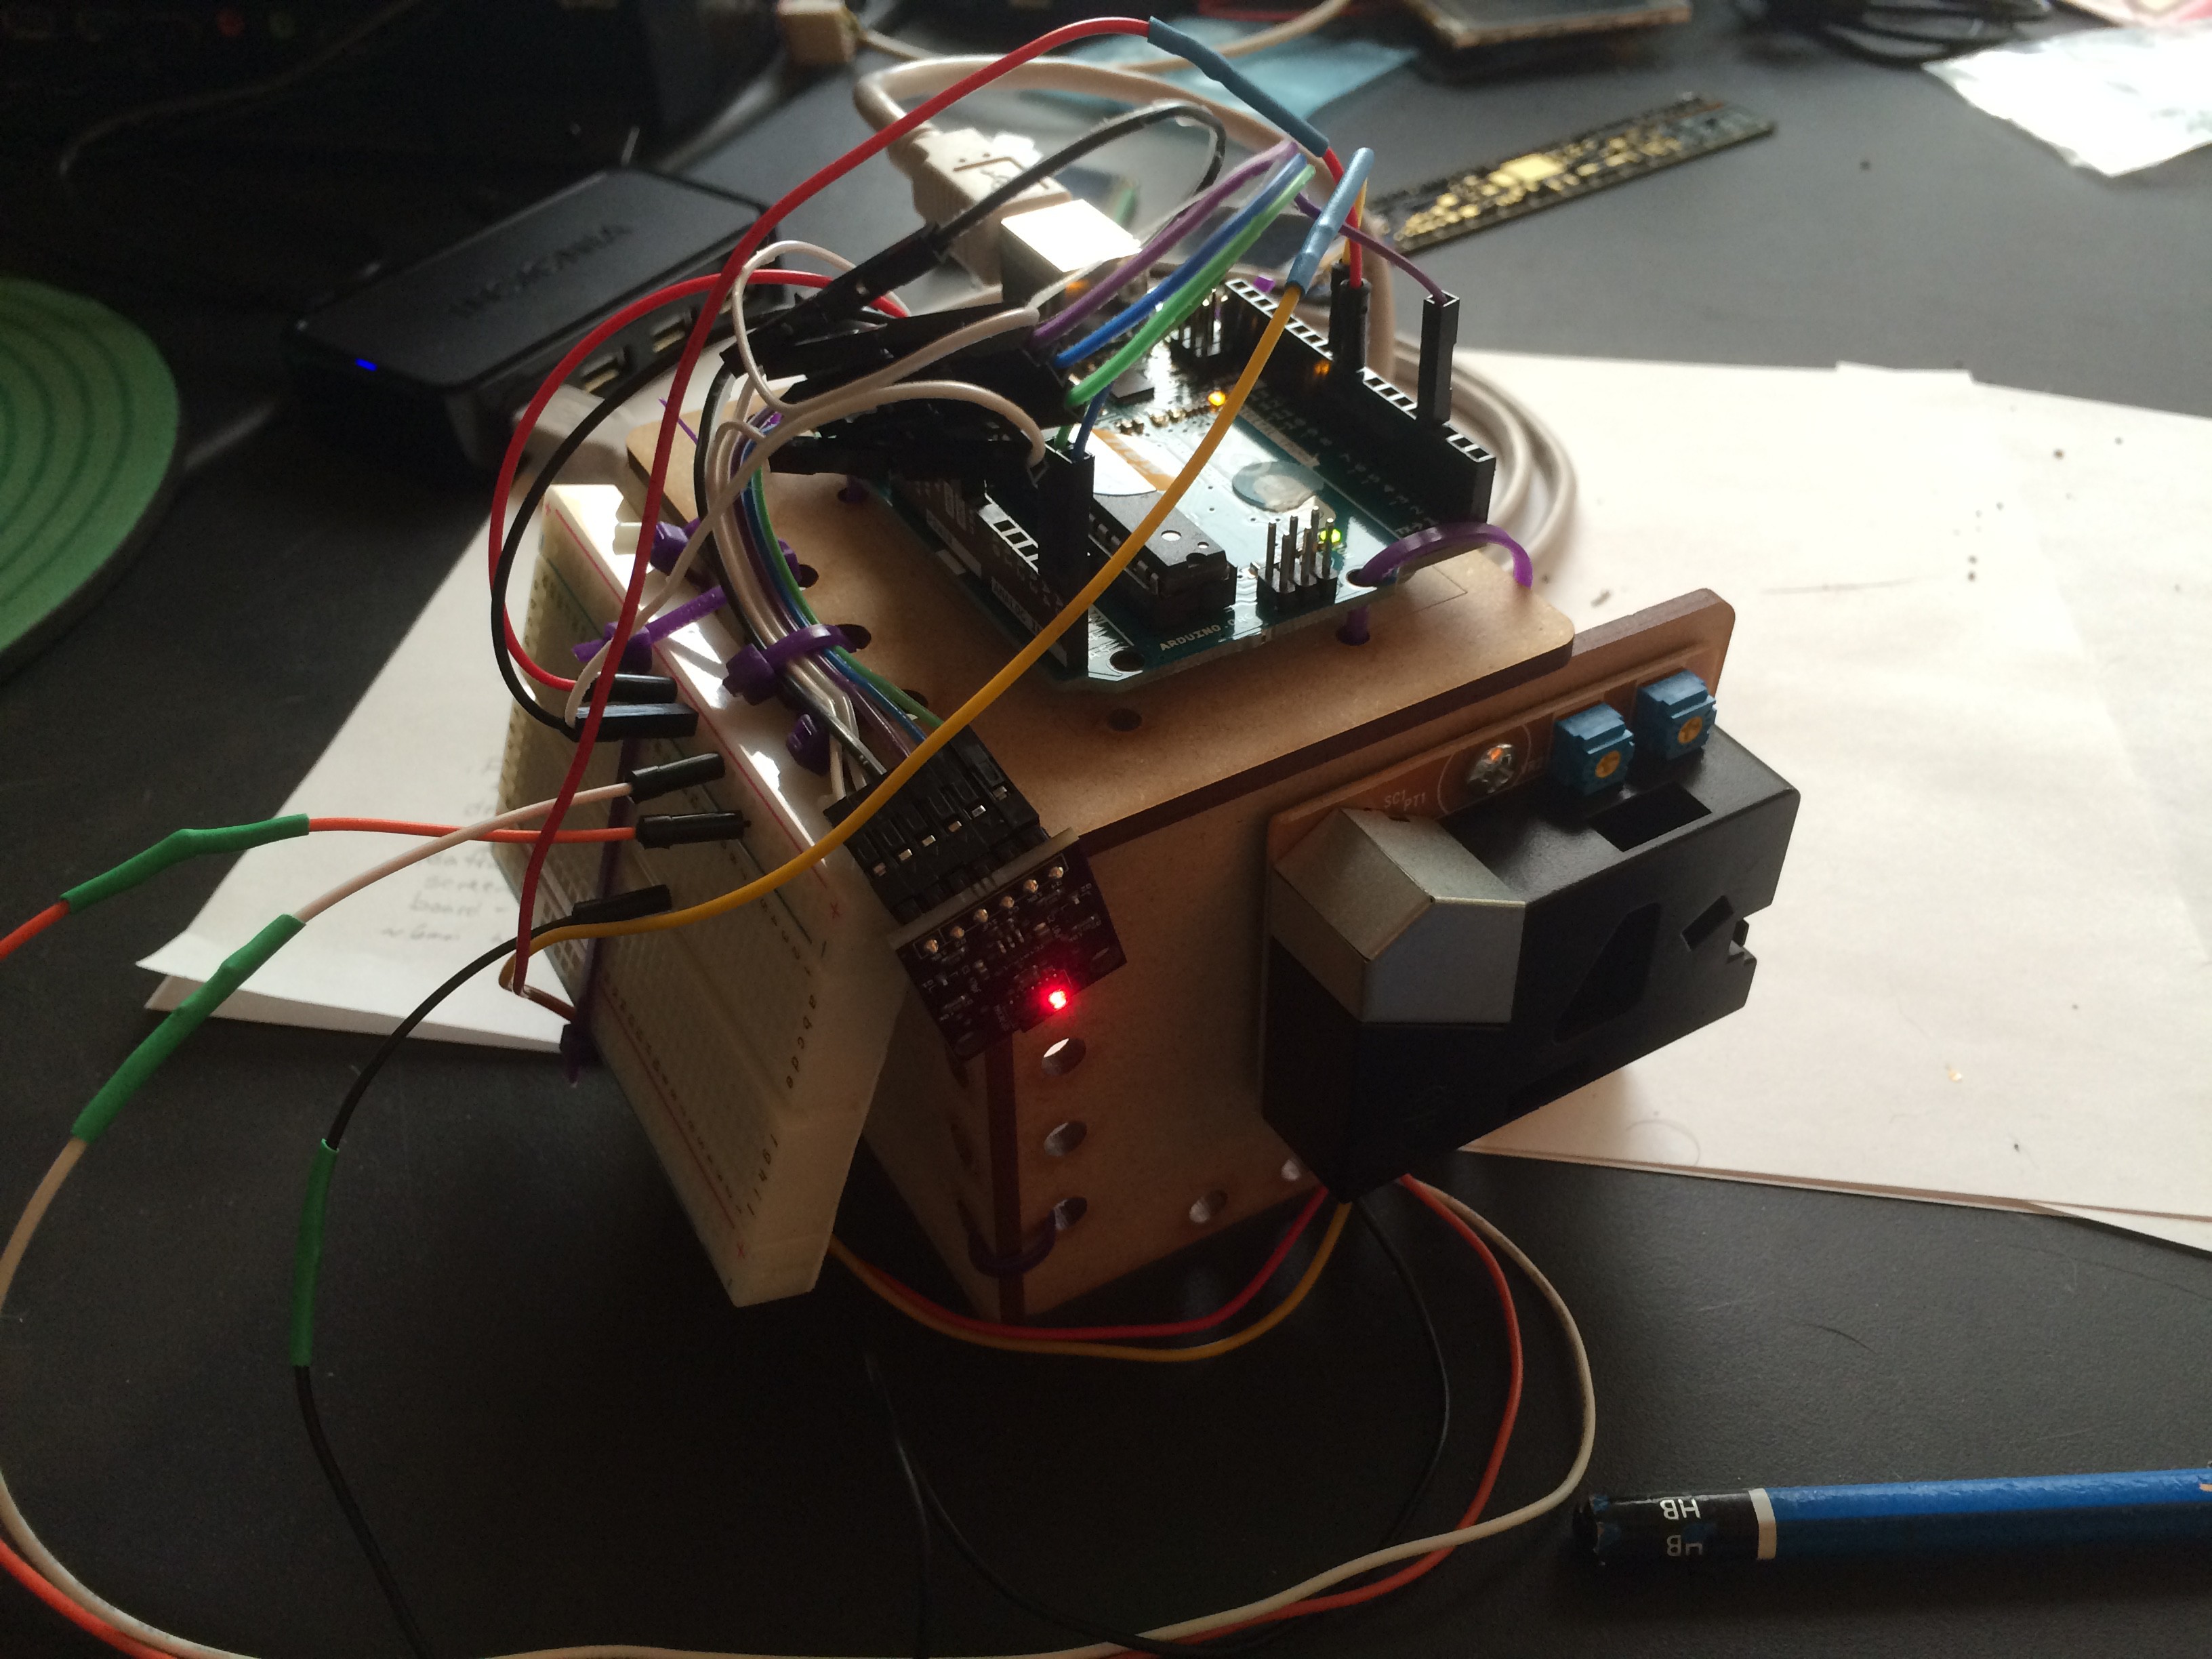
In order to see how well the MAX30105 compares with traditional air quality sensors, I ordered a few common air quality sensors (the DSM501A, above, and one of the popular Sharp line of sensors), and quickly cobbled together a MAX30105 breakout board to get a sense of what the data coming off the sensor looked like by eye. After about half an hour of recording in open air, I could easily notice changes in particle density from the DSM501A when (for example) opening up a window, but was not easily able to see these changes reflected in the MAX30105 data.

The MAX30105 has 3 LED channels (red, IR, and green). Above are histograms of the counts coming off each channel. Before seeing this, I hypothesized that particle detection might appear as follows:
- Hypothesis 1: A dust (or other particle) drifts by the sensor, partially reflecting some amount of light back towards the sensor, and shows as a (significant?) increase in the ADC count for one particular sample. Sampling over long periods of time then plotting a histogram, one would then expect to see a bimodal distribution -- a central bulge from returns where there was no reflection, then a smaller bulge of higher-intensity reflections, proportional to the dust sensity/properties of the air. (This is essentially how I understand the DSM501A functions -- using comparators to measure the number of counts over a certain threshold).
- Hypothesis 2: The air generally reflects some very small proportion of light that one shines at it, proportional to the particle/dust density in the air. The general intensity of the reflection will correlate with the dust density in the air. (This is essentially how I understand the Sharp ambient dust sensor works).
The above distributions look very close to unimodal Gaussian distributions -- so no extra overlapping distributions to support Hypothesis 1. The means also didn't seem to reflect Hypothesis 2, but I had very little data, and given the width of the distributions, any number of other issues could be at play -- noise from ambient light (though there is supposed to be some ambient rejection), improper mechanical placement, and many other issues.
The MAX30105 datasheet is very light on details about the particle sensing application, so I e-mailed technical support with my data to see if any additional help or application notes were available. They were only able to say that the MAX30105 requires "very smart algorithms" to function, and that they were happy to sell those algorithms through a third-party distributor. It seems unusual to me to sell an air particle sensor without describing how it can be used for particle sensing, but hopefully with some work one can characterize what air particle sensing tasks it's useful for, and how well it performs at those tasks.
A less quick second pass

To help control for as many variables as easily possible, I constructed a mount for the sensors to help (a) reduce the effect of ambient light on the sensor readings (if any), (b) contain all three sensors being tested, and (c) help ensure that all three sensors were being exposed to similar atmospheric conditions (without knowing enough about fluid dynamics to control for things like air flow). I ended up with this plumbing pipe from Home Depot, that contains a mount with the sensors in the middle, and two elbows on either end to dramatically reduce the ambient light inside the tube. An Arduino Uno using the open drivers for these sensors controls everything.
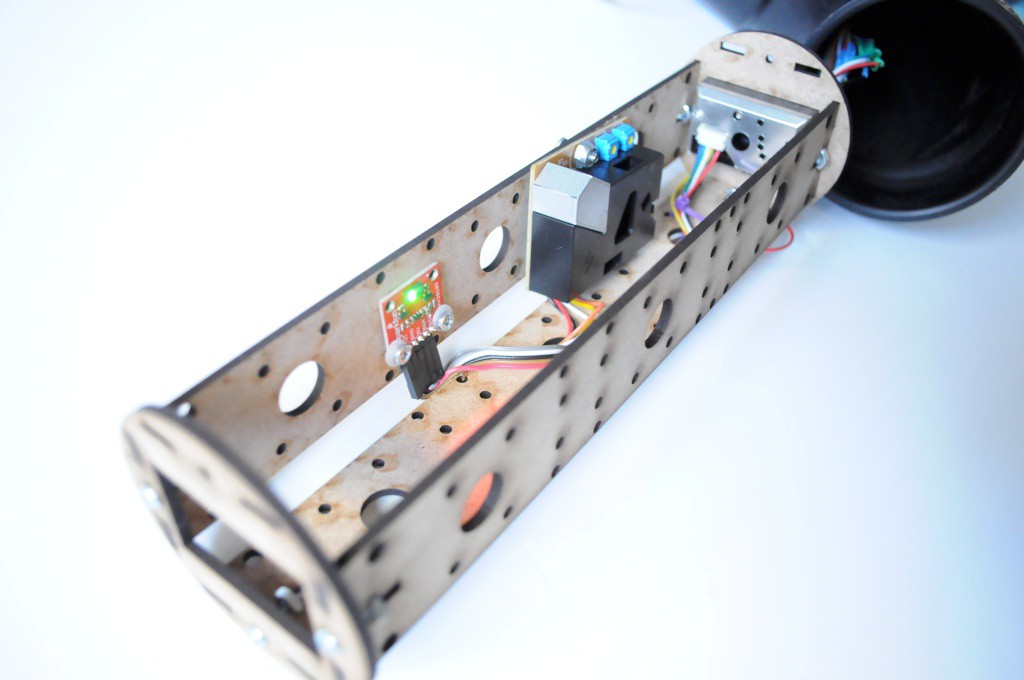
The mount (placed inside the tube) has the Sharp sensor mounted at the front, followed by the DSM501A sensor, and the Sparkfun breakout for the MAX30105 sensor last.

The tube also contains a fan on the bottom elbow that (very slowly) moves air through the tube, as well as the cables from all the sensors.
Data collection
I collected data from a small handful of locations:
- Data Set 1: Home, beside an open window while the neighbours were barbequing. I also collected a large data set over one day and one night, but there was not a great deal of variation in this latter data, and it was larger than Octave could easily load, so I did not include it.
- Data Set 2: Several hours of recording while placed at the local makerspace, Xerocraft, during open hours. The sensor was placed near the woodshop while it was stuffed full of woodworking enthusiasts generating a great deal of dust.
- Data Set 3: As above, but placed inside the woodshop (when it was less busy, and had a bit of room to spare).
- Data Set 4: Outside the back porch of Xerocraft. (Note: Someone had briefly plugged in a chop saw to the same outlet as the dust sensor, so there may be some electrical noise in this data).
The above dataset is available here in csv format (3 channels MAX30105, 2 columns from Sharp, and 4 columns from the DSM501A. The Sharp and DSM501A have both raw and interpreted values -- see code below).
For the sampling protocol:
- 10,000 samples were recorded from each of the red, IR, and green channels of the MAX30105 at a requested rate of 1000 samples per second. Because these were written to an SD card (which is a little slow on the Arduino), the actual sampling rate was likely about 10 times slower.
- Then, 10 samples from the Sharp sensor were taken, with only the final one used. (I noticed that the first few readings of this sensor were often much higher than subsequent readings -- which may signify an error in this sensor -- so I sampled for a while, then used the final reading, to see if this data made sense).
- Then, 10 seconds of sampling from the DSM501A, listening to output port 1 (O1), then another 10 seconds listening to port 2 (O2).
Ideally the sampling would have been simultaneous between all sensors, but for speed I was making use of the open drivers -- so here the readings between sensors may be delayed by as much as a minute or more. To reduce this effect, I throw out most of the 10,000 MAX30105 samples, comparing only the first 1,000 samples to the most recent Sharp and DSM501A data (hopefully delayed by only 10-60 seconds).
Here are the relevant configuration bits for the MAX30105 driver that this test used:
// The following are relevant configuration snipits for the MAX30105 from the test code

// MAX30105 Configuration

byte ledBrightness = 0x7F; //Options: 0=Off to 255=50mA
byte sampleAverage = 1; //Options: 1, 2, 4, 8, 16, 32
byte ledMode = 3; //Options: 1 = Red only, 2 = Red + IR, 3 = Red + IR + Green
int sampleRate = 1000; //Options: 50, 100, 200, 400, 800, 1000, 1600, 3200
int pulseWidth = 411; //Options: 69, 118, 215, 411
int adcRange = 4096; //Options: 2048, 4096, 8192, 16384

// Sharp, DSM501A drivers ...
// Setup() ...

// Main Loop
unsigned long loops = 0;
void loop() {

  samplesTaken = 0;
  Serial.println(loops);
  loops += 1;

  particleSensor.setup(ledBrightness, sampleAverage, ledMode, sampleRate, pulseWidth, adcRange); //Configure sensor with these settings
  while (samplesTaken < 10000) {
    particleSensor.check(); //Check the sensor, read up to 3 samples

    while (particleSensor.available()) {
      samplesTaken++;

      if (ENABLE_SERIAL_OUT == 1) {
        Serial.print(particleSensor.getFIFORed());
        Serial.print(",");
        Serial.print(particleSensor.getFIFOIR());
        Serial.print(",");
        Serial.print(particleSensor.getFIFOGreen());
        Serial.print(",");
        Serial.print(voMeasured);        // Sharp
        Serial.print(",");
        Serial.print(dustDensity, 3);    // Sharp
        Serial.print(",");
        Serial.print(lowpulseoccupancy); // DSM501A O1
        Serial.print(",");
        Serial.print(concentration);     // DSM501A O1
        Serial.print(",");
        Serial.print(lowpulseoccupancy2);// DSM501A O2
        Serial.print(",");
        Serial.print(concentration2);    // DSM501A O2
        Serial.println();
      }

      if (ENABLE_SD_OUT == 1) {
        dataFile.print(particleSensor.getFIFORed());
        dataFile.print(",");
        dataFile.print(particleSensor.getFIFOIR());
        dataFile.print(",");
        dataFile.print(particleSensor.getFIFOGreen());
        dataFile.print(",");
        dataFile.print(voMeasured);
        dataFile.print(",");
        dataFile.print(dustDensity, 3);
        dataFile.print(",");
        dataFile.print(lowpulseoccupancy);
        dataFile.print(",");
        dataFile.print(concentration);
        dataFile.print(",");
        dataFile.print(lowpulseoccupancy2);
        dataFile.print(",");
        dataFile.print(concentration2);
        dataFile.println();
      }

      particleSensor.nextSample(); //We're finished with this sample so move to next sample
    }
  }
  //particleSensor.setup(0, sampleAverage, ledMode, sampleRate, pulseWidth, adcRange); //Configure sensor with these settings


  // Poll sharp sensor
  delay(1000);

  for (int i=0; i<10; i++) {
    readSharpSensor();
    delay(1000);
  }

  // Poll DSM501A sensor
  readDM501A_fine();
  readDM501A_coarse();

  // Flush SD card
  dataFile.flush();

}
Data Analysis
I chose three methods for the analysis, based on the above hypotheses for how the measurements might reflect air quality. They're all based on determining the correlation between various measures from the MAX30105 and the Sharp and DSM501A sensors using Spearman's Rho. Assuming that the data from each of these sensors is linearly related, a correlation of 0 means that the below measures from the MAX30105 are returning completely different information than the measures from the Sharp and DSM501A sensors, and a correlation of 1 means that they're returning exactly the same information. I chose this measure because it should help control for issues like the relative sensitivity between each of the sensors. It would not control for cases where the data from the sensors has a non-linear relationship (e.g. exponential), but hopefully we'll be able to verify this by plotting the data.
Method 1: Correlations (Mean values of 1000 Red/IR/Green samples)
With this first method, I take the mean value of 1000 samples of the red, IR, and green channels from the MAX30105 (nominally about 1 second of data), and determine the correlation with the most recent output from the Sharp and DSM501A sensors.
Interpretation: Unfortunately in this case it doesn't look like the mean MAX30105 data is strongly correlated with the Sharp or DSM501A sensors. The small correlations on individual datasets wildly change magnitude and direction, further reenforcing this. This makes Hypothesis 2 unlikely -- that the air quality data is reflected in the mean of the distribution.
It's also interesting to note that there isn't much of a correlation between the Sharp and DSM501A sensors (or, between the two DSM501A channels, for that matter) -- further reenforcing the idea that these are measuring two different things (e.g. overall air dust level vs particle size counts).
Correlations:
Data Set 1: Beside an open window at home while the neighbours were barbequing
| Spearman's Rho | MAX RED | MAX IR | MAX GREEN | Sharp | DSM501A O1 | DSM501A 02 |
| MAX RED | 1 | 0.92 | 0.87 | 0.42 | -0.29 | -0.07 |
| MAX IR | 1 | 0.84 | 0.49 | -0.16 | 0.05 | |
| MAX GREEN | 1 | 0.42 | -0.24 | -0.30 | ||
| Sharp | 1 | 0.13 | 0.21 | |||
| DSM501A 01 | 1 | 0.10 | ||||
| DSM501A 02 | 1 |
Data Set 2: Several hours of heavy woodshop use at the local makerspace (from an adjoining room)
| Spearman's Rho | MAX RED | MAX IR | MAX GREEN | Sharp | DSM501A O1 | DSM501A 02 |
| MAX RED | 1 | 0.18 | 0.91 | 0.32 | -0.43 | -0.39 |
| MAX IR | 1 | 0.02 | -0.04 | 0.09 | 0.12 | |
| MAX GREEN | 1 | 0.39 | -0.58 | -0.51 | ||
| Sharp | 1 | -0.43 | -0.34 | |||
| DSM501A 01 | 1 | 0.42 | ||||
| DSM501A 02 | 1 |
Data Set 3: As above, but directly inside the shop
| Spearman's Rho | MAX RED | MAX IR | MAX GREEN | Sharp | DSM501A O1 | DSM501A 02 |
| MAX RED | 1 | 0.64 | 0.29 | 0.33 | 0.17 | 0.52 |
| MAX IR | 1 | 0.14 | 0.29 | 0.17 | 0.43 | |
| MAX GREEN | 1 | 0.55 | -0.51 | -0.09 | ||
| Sharp | 1 | -0.03 | -0.11 | |||
| DSM501A 01 | 1 | 0.57 | ||||
| DSM501A 02 | 1 |
Data Set 4: Outdoors on the back porch of the Makerspace
| Spearman's Rho | MAX RED | MAX IR | MAX GREEN | Sharp | DSM501A O1 | DSM501A 02 |
| MAX RED | 1 | 0.50 | 0.90 | -0.77 | -0.17 | -0.33 |
| MAX IR | 1 | 0.21 | -0.52 | 0.59 | -0.36 | |
| MAX GREEN | 1 | -0.59 | -0.48 | -0.45 | ||
| Sharp | 1 | -0.07 | 0.39 | |||
| DSM501A 01 | 1 | 0.57 | ||||
| DSM501A 02 | 1 |
Example Data:
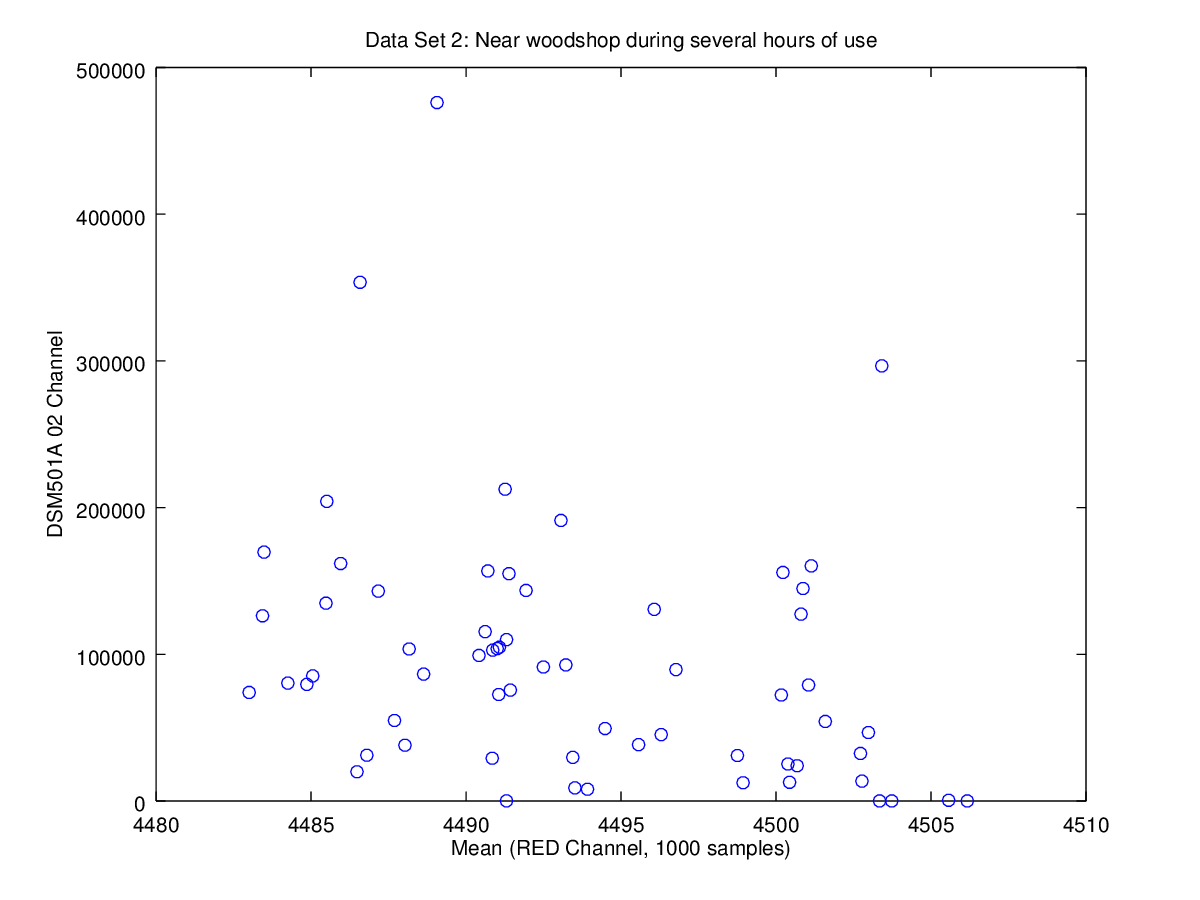
Above is a plot from data set 2 (near the wood shop), comparing the red channel from the MAX30105 with one of the DSM501A channels. Here the data is really all over the place -- It'd be very hard to draw a straight line that captures the relationship between these two sets of data, so the correlation is low.
Method 2: Correlations (Standard Deviation of 1000 Red/IR/Green samples)
My second method is largely a guess -- if the mean value doesn't appear to reflect the air particle level, perhaps the amount of variance in the distribution (i.e. the standard deviation) on short timescales (i.e. 1 second at 1000 samples/second) contains some of this information. This is largely a guess -- I can come up with a few physical reasons why this might be the case, but perhaps also just as many for why it likely wouldn't be the case (so definitely a post hoc test). Let's see what happens.
Interpretation: DSM501A: We actually do see a moderate-to-strong (0.52 to 0.75) correlation between the red channel of the MAX30105 and the DSM501A Output Channel 2 across all four datasets. There are also smaller correlations with the green channel of the MAX30105. There does not appear to be a correlation with the IR channel -- which is interesting, as it's my understanding that the Sharp and DSM501A sensors use an IR LED/photodiode for their detection (though perhaps of a significantly different wavelength).
Sharp: There does not appear to be a correlation between the standard deviation of the MAX30105 measurements and the value of the measurement from the Sharp sensor.
Data Set 1: Beside an open window at home while the neighbours were barbequing
| Spearman's Rho | MAX RED | MAX IR | MAX GREEN | Sharp | DSM501A O1 | DSM501A 02 |
| MAX RED | 1 | -0.17 | 0.71 | 0.27 | 0.28 | 0.58 |
| MAX IR | 1 | 0.08 | -0.12 | -0.03 | -0.06 | |
| MAX GREEN | 1 | 0.26 | 0.23 | 0.65 | ||
| Sharp | 1 | 0.13 | 0.21 | |||
| DSM501A 01 | 1 | 0.10 | ||||
| DSM501A 02 | 1 |
Data Set 2: Several hours of heavy woodshop use at the local makerspace (from an adjoining room)
| Spearman's Rho | MAX RED | MAX IR | MAX GREEN | Sharp | DSM501A O1 | DSM501A 02 |
| MAX RED | 1 | 0.04 | 0.82 | -0.40 | 0.77 | 0.69 |
| MAX IR | 1 | 0.14 | -0.08 | -0.01 | -0.04 | |
| MAX GREEN | 1 | -0.30 | 0.58 | 0.57 | ||
| Sharp | 1 | -0.43 | -0.34 | |||
| DSM501A 01 | 1 | 0.43 | ||||
| DSM501A 02 | 1 |
Data Set 3: As above, but directly inside the shop
| Spearman's Rho | MAX RED | MAX IR | MAX GREEN | Sharp | DSM501A O1 | DSM501A 02 |
| MAX RED | 1 | 0.60 | 0.72 | 0.06 | 0.56 | 0.75 |
| MAX IR | 1 | 0.77 | 0.35 | 0.08 | 0.43 | |
| MAX GREEN | 1 | 0.29 | 0.11 | 0.38 | ||
| Sharp | 1 | -0.03 | -0.11 | |||
| DSM501A 01 | 1 | 0.57 | ||||
| DSM501A 02 | 1 |
Data Set 4: Outdoors on the back porch of the Makerspace
| Spearman's Rho | MAX RED | MAX IR | MAX GREEN | Sharp | DSM501A O1 | DSM501A 02 |
| MAX RED | 1 | -0.40 | 0.95 | 0.05 | 0.47 | 0.52 |
| MAX IR | 1 | -0.26 | -0.52 | -0.78 | -0.79 | |
| MAX GREEN | 1 | -0.19 | 0.42 | 0.43 | ||
| Sharp | 1 | 0.07 | 0.39 | |||
| DSM501A 01 | 1 | 0.57 | ||||
| DSM501A 02 | 1 |
That looks promising -- let's combine these four datasets into one, and have a look at the data to see if the relationship between the MAX30105 RED channel and the DSM501A O2 looks roughly linear:
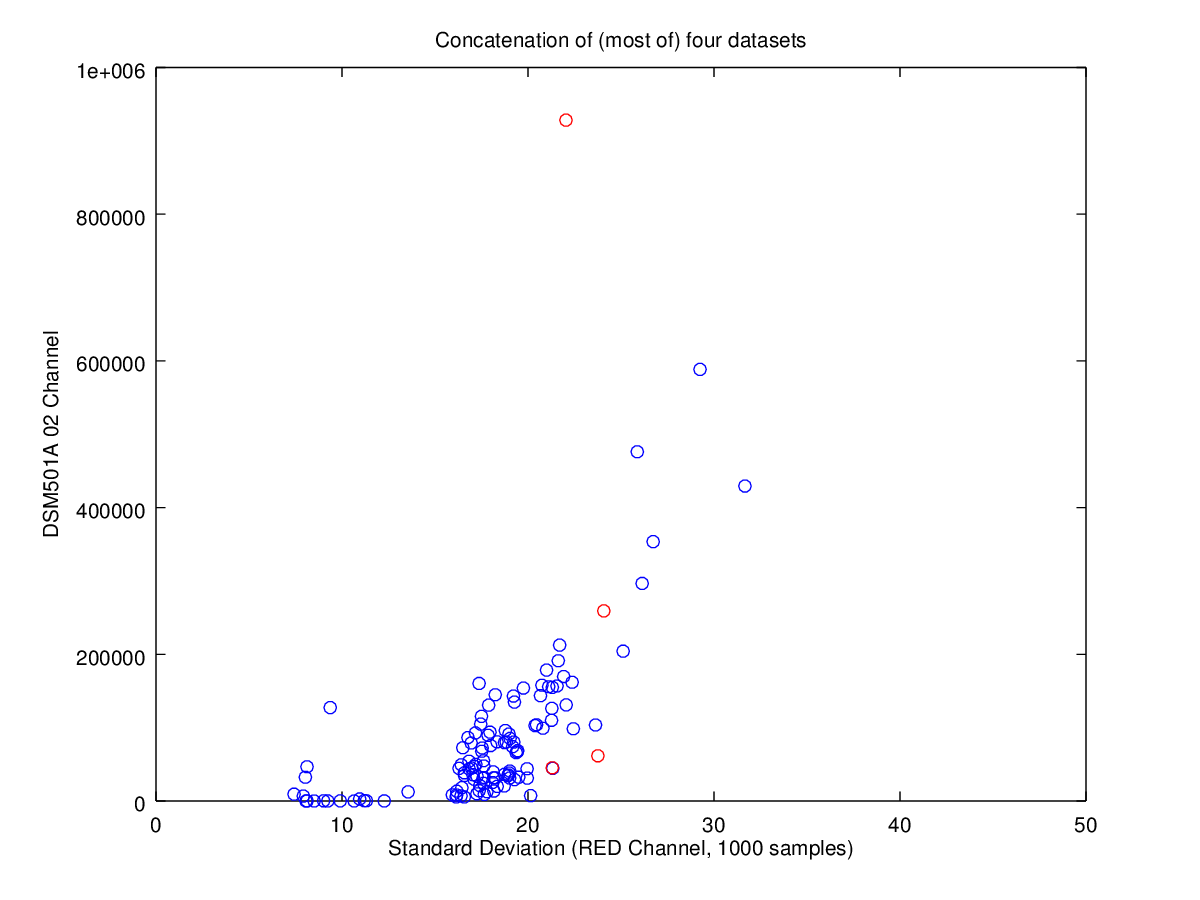
Note, the zeros from the DSM501A reflect 10 second sampling periods where no particles were detected. These are automatically removed from the data set before running the correlation, and are likely an artefact of the very short (10 second) sampling period used for the DSM501A. With simultaneous sampling of the MAX30105 and DSM501A, these sampling periods could be increased quite a bit without having to worry about the sensors sampling different conditions.
Aside from the zeros (outliers) that floor the distribution, the remainder of the distribution does give the impression that there is a linear relationship between the MAX30105 RED channel and the DSM501A O2. The correlation on this combined dataset (0.71, below) also seems to support this.
Concatenated Data Set: Most of all of the above datasets
| Spearman's Rho | MAX RED | MAX IR | MAX GREEN | Sharp | DSM501A O1 | DSM501A 02 |
| MAX RED | 1 | -0.12 | 0.82 | -0.11 | 0.63 | 0.71 |
| MAX IR | 1 | 0.02 | 0.10 | -0.21 | -0.14 | |
| MAX GREEN | 1 | -0.10 | 0.44 | 0.58 | ||
| Sharp | 1 | -0.32 | 0.02 | |||
| DSM501A 01 | 1 | 0.38 | ||||
| DSM501A 02 | 1 |
Method 3: Only looking at the tail mass
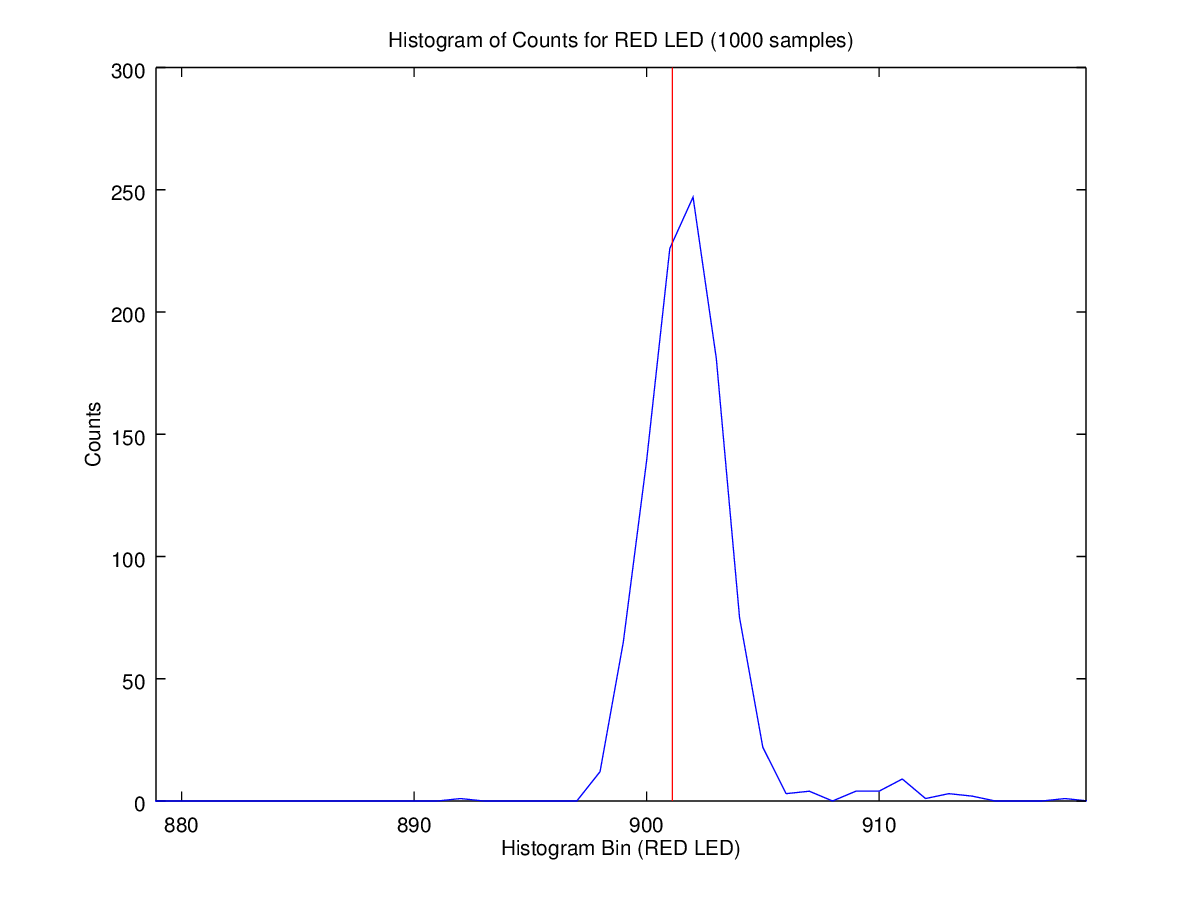
In spite of the above, I still feel like hypothesis 1 -- that particles moving in front of the detector should create a bimodal distribution, much like the detection methodology of the DSM501A sensor -- is a likely source of signal, and that we should be able to detect these cases by masking out the main bulk of the distribution, and looking only at the outliers. Histograms like the one below, where a small number of samples appear to the right (higher reflectance) of the main distribution, only make me think this might be where the majority of the signal is hiding, and that the standard deviation is just leaking some of this information through.
Masking out the main bulge (+/-5 bins from the center), and summing the remaining mass, this is the plot we get over ~80 sampling periods (below, using dataset 2, a long collection near the woodshop). If this truly reflects air particle level, it would be suggesting that there was a gradual dip around time point 30, and a steady increase up until point 80. This would make some physical sense, since (anecdotally) the woodshop probably became dustier as more folks came in to work on their projects.
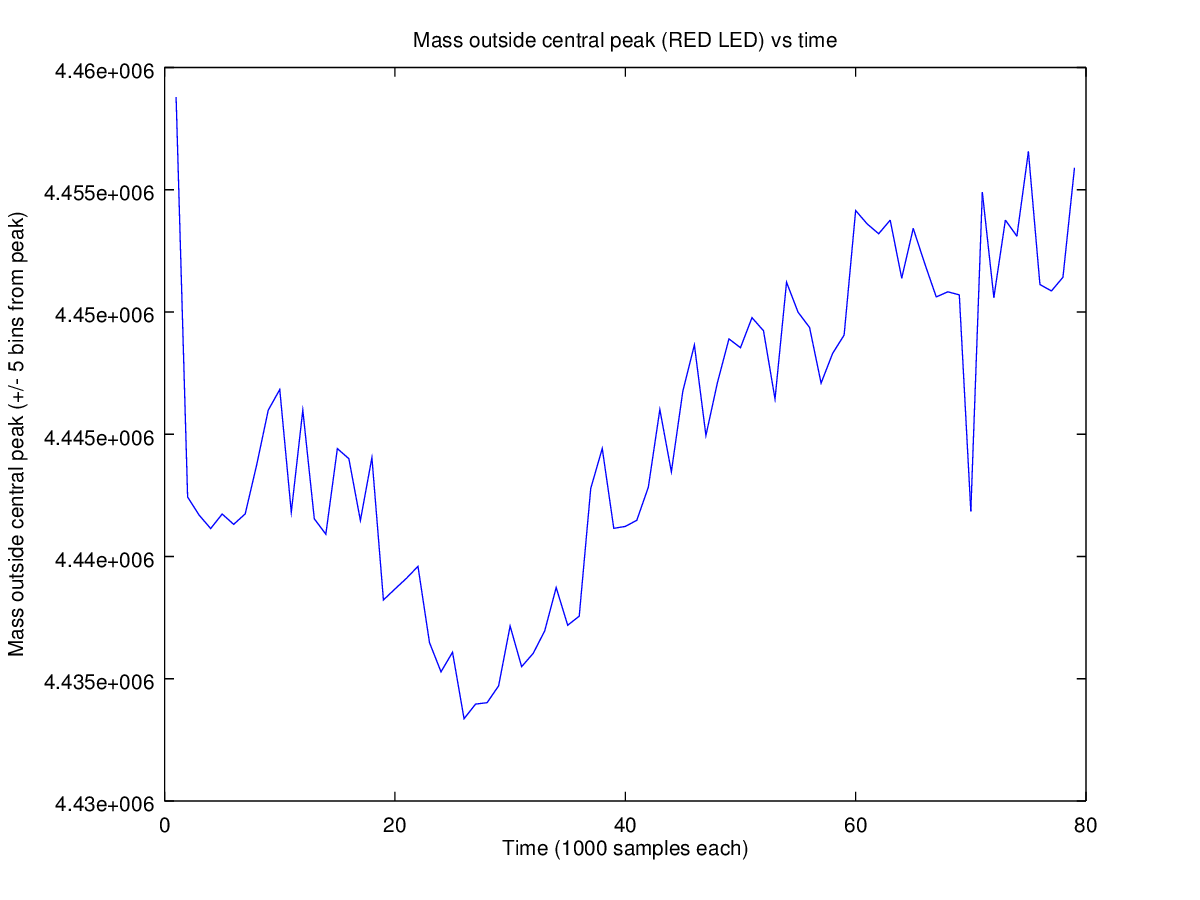
Unfortunately this isn't clearly reflected in the distribution from the conventional air quality sensors (the Sharp and DSM501A) in the plot below, or in the correlations between this measure and the Sharp/DSM501A values. To give a sense of this data, the DSM has a lot of high-frequency changes:
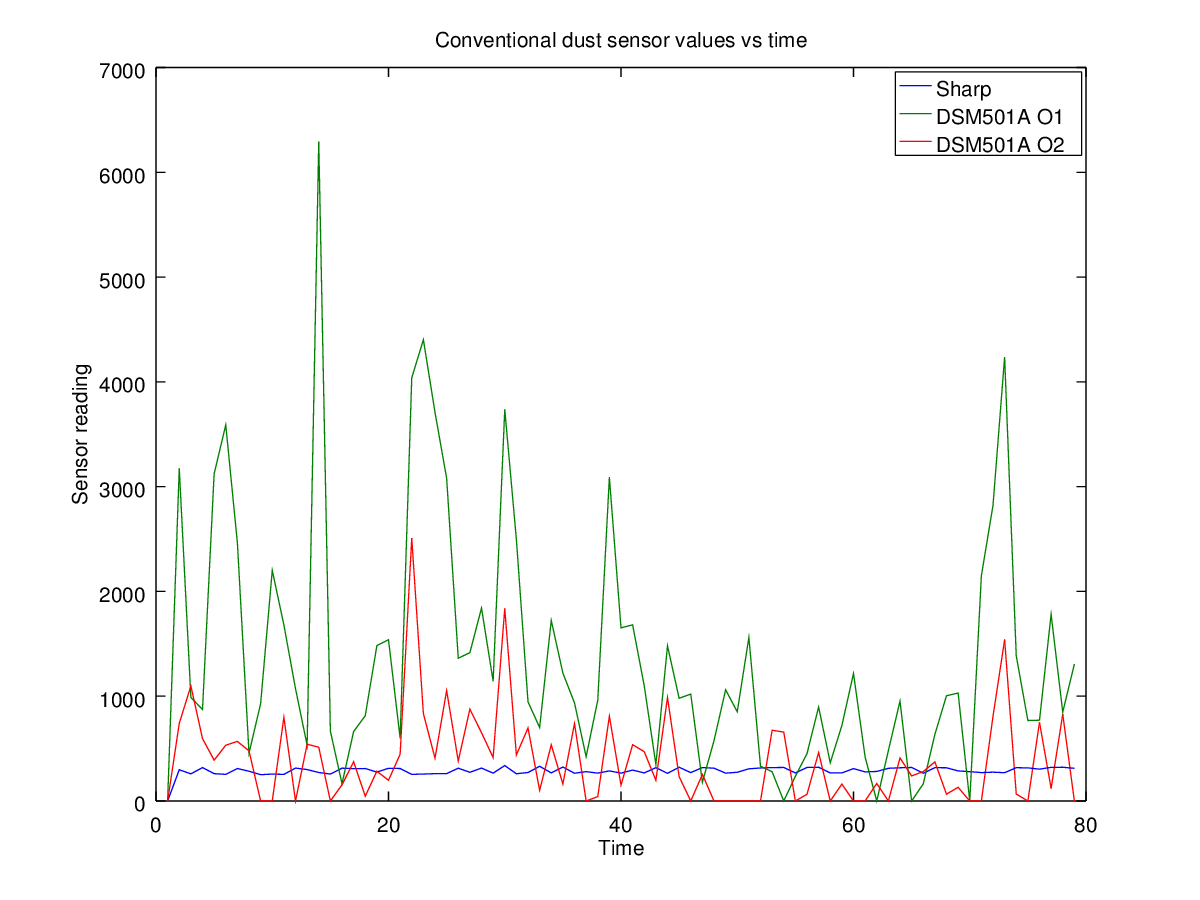
Where the Sharp generally reports a value that oscillates around a mean value:

And, to verify that the mean value of the Sharp sensor changes depending on the environment, let's have a look at the means for the different data sets:
| Data | Mean ADC Value | Mean Dust Density (mg/m^3)* |
| Data set 1 (indoors beside window at home) | 244.7 | 0.104 |
| Data Set 2 (near busy woodshop) | 287.2 | 0.140 |
| Data Set 3 (inside busy woodshop) | 287.4 | 0.142 |
| Data Set 4 (outside in dusty parking lot) | 264.2 | 0.124 |
(* the open source driver uses the characterization from http://www.howmuchsnow.com/arduino/airquality/ to derive the dust density)
Next Steps
This is a promising first step -- it looks like the MAX30105 may deliver measurements similar to the particle measurements from one of the outputs of the DSM501A (which I believe is sensitive to PM2.5 levels, though the datasheet is a little unclear about this).
There is a great post on Make by Tim Dye who characterized several inexpensive sensors with a professional air particle reference instrument, and showed that some inexpensive sensors tend to have a strong correlation of 0.7-0.8 with the reference instrument he used, under different particle conditions. If we consider this characterization of the MAX30105 as a promising first step, then ideally a similar characterization using a proper air particle reference instrument (rather than these inexpensive sensors) can yield a more full characterization of the MAX30105's capabilities under a variety of different particulate scenarios, and help enable inexpensive and millimeter-scale air quality characterization instrumentation.
Thanks for reading.
 peter jansen
Discussions
Become a Hackaday.io Member
Create an account to leave a comment. Already have an account? Log In.
Does anyone have a sample code to detect smoke using MAX30105?
Are you sure? yes | no
Love your work so far with the Max30105, I just order one of these boards. I also was eager to see how this might work for detecting air particle from smoke. I contacted the vendor and they also directed to a 3rd party for any algorithms. The only thing I got out of them was "Each type of particle reflects the three light wavelengths in different ratios, which can be used to identify particle type and concentration". Not much help.
Please keep me updated with any new developments. Again, great start keep going!
Are you sure? yes | no
Hi Peter - great job. I had a quick look at your dataset, and here are some impressions.
1/ You need to thermally compensate all three channels first - presumably that is why the MAX30105 has a temp register (0x1F–0x21).
2/ As a first step, subtract off the Mean[] from each data trace for the 3 optical channels.
3/ Run the channels through an ExponentialMovingAverage. You should see a nice modulated signal.
4/ Note that the sensor is based on differential scattering from differently sized particles, based on Mie scattering. So everything will be based on ratios, as with all devices of this type for the last century. Follow steps 1-3 for your dust4_xc _outsidebackdoor.csv dataset and then compute Ch1/Ch2. Enjoy.
Here are some compensation parameters for your dust4_xc _outsidebackdoor.csv
Background CH1: -46.6 + 68.55*Exp[-4.14^-6 x]
Background CH2: -24 + 38.26 Exp[-5.036*10^-6 x]
Background CH3: -6.48 + 20.49 Exp[-0.0000150077 x]
For each channel, subtract off the background, and then
particleDensity = (ch1corr + 30)/(ch2corr + 12.7).
I have absolutely no idea what units that is in; someone will need to figure out the actual temp comp parameters for the sensor, and then use calibrated particles to create a calibration lookup table for the sensor. I recommend to try to figure out the temperature compensation first.
The is another thing - the Datasheet for the sensor gives the quantum efficiency of the sensor. QE near 0.62 at 750 nm, worse left and right of that. Somehow the QE will need to be taken into account, too. The first step would be to read off the QE from the PHOTODIODE QUANTUM EFFICIENCY vs. WAVELENGTH plot in the data sheet, for the three colors, and then correct the sensor channels for the different QEs.
Jan
Are you sure? yes | no
what if the smoke does not change the temprature?
r.dastgheib2@gmail.com im eager to consult you about this sensor
Are you sure? yes | no
Great work. I am looking at using this sensor to measure dust levels in the atmosphere using rockets and/or balloons rather than the bulkier Sharp sensor. Keep it up!
Are you sure? yes | no
Hello,
I was researching some material on particle detection using the MAX30105 and I found you.
I am a student from Brazil and I want to use this sensor to identify particles, in the datasheet of the sensor it is informed that it is possible from 2μA to 16μA. You did a bele job, how can I keep up with the developments? Because I ordered a module in the sparkfun store.
My contact is r._cunha@hotmail.com.
Thank you friend,
greetings
Are you sure? yes | no