Close
0%
0%

Climate & Environment Monitoring Station

Create a monitoring station to measure weather, soil, seismic, solar, magnetic, and gravity conditions - focus best accuracy/dollar w/COTS.

Similar projects worth following
Create a system with commonly available sensors and hardware in conjunction with good engineering to get the best accuracy reasonable. How will this be different from the thousands of very good DIY weather station projects? I grew up "pre-digital" so am a bit obsessed with true accuracy and not just resolution. This project will attempt to include an error band estimate for any measurements. The overall goal will be to have a "meteorological" quality station that is in reach for any hobbyist. A second goal is to have the fun of adding other data sensors for the environment as well.

(placeholder photo by US National Weather Service [Public domain], via Wikimedia Commons)

An old saying from my mother was, "In for a penny, in for a pound". Since I have gotten accustomed to Hackaday.io as a workflow blog, I decided to put up another of my ongoing projects. This one grew out of my frustration with the expense, inaccuracies, and closed approach of various personal "Weather Stations". I have owned several Davis versions and, most recently, a Peet Bros. unit.

Afer one repair of the Peet Bros. temperature/humidity sensor and later when the display system died the other day, I had my fill and started building my own as a replacement. This was about 18 months ago, so this is another in medias res project. (Note to my high school English teachers -- see, I was paying attention even though you didn't think I was)

That means you will need to overlook the scattered approach to the first few postings as they were a data dump of that happened up to 2016.

Sadly I did not have anything ready on this for Hurricane Harvey.  Even my new calibrated tipping bucket rain gauge failed.  The old school approach was the 18ft swimming pool at the bunkhouse.  It was empty on Friday Aug 22 and full to the 42 inch line on Tue Aug 26.  Oh well, I will have it ready for the next one.

anemometer_counter_schematic-logisim.jpg

First prototype of gated counter. Simulated in Logisim-Evolution

JPEG Image - 81.96 kB - 01/14/2019 at 21:11

Preview
Download

  • 2 × ESP8266 Core MCU used for prototyping
  • 1 × DS1307 Real Time Clock (RTC)
  • 1 × SSD1306_128X32 OLED 128 by 32 dot OLED
  • 1 × Rainwise wired rain gauge Rainew 111 Tipping bucket wired rain gauge
  • 2 × SHT21 Temperature & Humidity Sensor

View all 9 components

  • System Summary - Revised

    sparks.ron01/18/2021 at 19:49 0 comments

    A quick overview of the revised plan for the system is required. Here are the changes since the first one:

    1. Wireless support has become ubiquitous due to the low cost ESP8266 and ESP32 boards.
    2. Raspberry Pi boards are now capable of routing
    3. Field installation realities have been identified to require remote mounting of some sensors, e.g., wind sensors (10 m or 33 ft high) and soil sensors (multiple may be desired).
    4. Microprocessor connectivity to wired Ethernet has become less common than WiFi.
    5.  Automatic data logging and processing can easily be accomplished by a Raspberry Pi or similar Single Board Computer (SBC).

    For this reason, we have begun to re-tool to use wireless in a restricted WLAN to connect various sensors to a base hub. This will also allow the hub to be removed from the sensor cluster(s) to avoid self heating effects. The new approach will now be:

    1. Raspberry Pi 3+ or 4 (Rpi) hub hosting Docker containers and bare-metal apps to include at least: hostapd, python, mqtt broker, influxdb, grafana, and node-red.
    2. Remote sensor interfaces running on ESP based modules with WiFi links to the hub and MQTT data outputs. Coding will be Arduino IDE compatible.
    3. Fixed sensors with complex post-processing will be interfaced directly to the hub by cable.
    4. Power for the system will still remain solar, but all power equipment will be handled and housed separately near the base of the main sensor pedestal.
    5. At this point we are looking at making a Stevenson Box optional, but our system will continue to use one due to local environmental and pest conditions.

    At this time we have one temperature/humidity module operating remotely to the RPi. It has been running with no issues continuously for 7 months. We did have one outage where the unprotected ESP board developed corrosion and a resulting leakage between pins on the PC board. Cleaning thoroughly with IPA resolved the problem. In a permanent deployment we now plan to conformally coat the PC boards.

    The load on the RPi 3+ has been averaging about 25% during this time. It seems to have plenty of processing capability for this project.

    Our test system is also interfaced to Home Assistant software which allows remote viewing of the data, and various automations to be performed.

  • Moving ahead

    sparks.ron01/18/2021 at 04:01 0 comments

    I know that this project has been dormant for a while, but 2020 and all. Anyway, I am back at it and finished the research and design portion for the soil sensors.

    That lead to a simple design that can use an ESP8266 (or Arduino, etc.).  The difficulty of this portion was that a simple resistive probe, like those commonly on Amazon, Ebay, Banggood, etc., was not accurate enough to use for agricultural quality soil measurements. This led to the packed gypsum Watermark probes. These are reasonably priced and are widely used by university research programs throughout the US. For that reason, proper calibration information is easily obtained.

    The more difficult part for me has been deciphering the technical math and determining how that relates to real world watering requirements. This obviously varies significantly depending on the type of plants and soil composition. However, the relevant research papers will get our sensor system close enough to create a usable starting point. Then if the user decides to take field calibration measurements for their specific situation, this sensor system should be able to be adjusted to that actual measurement.

    Obviously it will not replace good agri-management, but it should be a useful tool for that job.

    Once the prototype is tested and operational, I will post the relevant soil and Soil Water Potential (SWP) and other data to my github (txNgineer). All of my software will be up there as well.

  • High Humidity Sensors

    sparks.ron07/27/2020 at 16:56 0 comments

    One of the first things we came across was the inability of many humidity sensors to reliably report Relative Humidity (RH) above 75%. In particular the DHT21 style sensors saturated at about that point and were rendered useless until the RH dropped to the 50% range for an hour or more. That is completely unacceptable for a weather station that must operate in a coastal, tropical, or semi-coastal area.

    Thus a search was mounted to find a reasonably priced sensor without that problem. The Sensirion line were good candidates but their relatively high cost was problematic. However recently they have begun making a more value sensitive line and the SHT21 was selected for testing.

    At about the same time, TI began selling a good value sensor that looked appropriate, the HDC1080.

    We began using the ESP8266 platform that is planned for our Bee Hive Monitor and modified the software to allow a compile time switch to select between either of these sensors. Since then they have been tested outside in our particularly challenging Texas Gulf Coast weather. In general the RH hits between 95-100% each night and the following day rarely sees it below 60%. At the same time the temperature ranges from about 77F (25C) at night to 99F (37C) in the afternoon. This puts the heat index at around 113F (45C).

    You can see from that range that a good RH number is vital to calculating the heat index to determine the stress on bees, livestock, and humans.

    Our initial testing has discovered no major differences in "out of the box" performance of the SHT21 and HDC1080. A simple function routine was written to have both types present their data to the main loop in the same format, so there is little difference from a software perspective. Both have readily available ESP libraries and datasheets.

    We will be moving ahead with our Bee Hive monitors and use some of each type in the various initial prototype installation. That should allow a bit better "A to B" comparisons.

  • Integration with Bee Hive Health Monitor

    sparks.ron04/23/2019 at 17:10 0 comments

    Bee hive health is tightly linked to weather conditions. I am now beginning to ensure this Climate Station integrates seamlessly with our Bee Hive Health Monitor project.

    This new project as well as the ready availability of inexpensive ESP8266 modules has changed the system approach needed for the Climate Station. It is now obvious that the wind direction, anemometer, and rain gauge all need to be remote to the rest of the fixed weather sensors. That requires some form of linking and a separate module/power system.

    These requirements have moved the objectives for the system. In no particular order, they are:

    A. Set up a wireless link (ad hoc WiFi) for remote sensors to use to report data

    B. Use a single board computer (SBC), like Raspberry Pi as the "base" station. That can then communicate out to the world by either wirelessly or wired Ethernet.

    C. Continue to strive for best valance of value vs absolute accuracy in the sensors.

    D. Move some preliminary calculation to the edge sensors' MPUs. For example, dew point and heat index. These can be more rigorously calculated or compensated, if required, in the base station before final transmission.

    E. Use the MQTT protocol for all data interconnects, do round robin data storage in the NVRAM of the MPU for backup in the case of broken WiFi linkage or station outage.

    F. Power supply and solar design is now more complicated due to the distributed nature of the system. Where possible use LiFePO4 batteries. This means more complicated battery management systems (BMS) and voltage regulators (buck or boost or both).

    G. Probably most important are reliability, repeatability, and simple maintainability.

  • Anemometer & Wind Direction circuit

    sparks.ron01/14/2019 at 21:10 0 comments

    It has been several decades since I did a complicated Karnaugh Map to lay out a digital circuit. Which means it took a lot of time and review to get the knowledge brought back to the front of my memory and skill stack.  Anyway, the concept for the circuit was deceptively simple.  The way the sensor works it it has two magnets and two reed switches. One sensor physically aligned with north for the wind speed rotor and one for the direction vane.  The number of counts per minute of the rotor vane is a representation of the wind speed.  The wind rotor also has a magnetic shield that extends up into the direction vane.  This means the direction switch will close once each revolution when the rotor aligns with the direction.  The time difference between the two closures is therefore the proportion of the circle between north and the direction vane. Clever and patented.

    The beauty of this approach is the significant resolution improvement over more traditional multi-switch direction sensors or drag and friction in potentiometer sensors.  It allows the entire assembly to be completely sealed from the elements and corrosion.

    The circuit to use the Peet style anemometer needs to respond quickly, since at high wind speeds and directions near to north, the time between pulses can be very short.  In order to get the resolution I wanted, it was too short for an Arduino. It would likely work on the faster MCUs like the ESP series.  However, that still would not resolve any variability in processing timing to count the time. So I decided on simple "jelly bean" digital logic as an inexpensive and reasonably stable timing platform.

    I have attached my prototype circuit (done in Logisim-Evolution) and it will be the basis for the first breadboard circuit.  Once I have gone through the necessary datasheets and part selection I will include those parts in the list and do a Kicad schematic.

  • Statistics math is full of jargon - but useful

    sparks.ron10/23/2018 at 23:11 0 comments

    It has taken me a lot longer to understand the accuracy specifications of the various sensors I need to compare and/or choose from.  A lot of this is because the manufacturers leave details out of the datasheet when they specify accuracy. For example is the ± 0.1 ºC an absolute accuracy, a standard error, or what? And if they bin their sensors to fall within that accuracy, what sample standard deviation is allowed, etc.

    Thankfully Sensirion has that information available if you dig deep enough. It will not show up on a Google search or a search of their website.  However, I did finally find it in the certification part of the Quality Control section of their website.  From what I can understand, they use a 95% confidence error on a sample group to generate their specified tolerance.  Hooray for Sensirion! They are doing things right and I can now use their sensors with reasonable expectations of repeatability and proper accuracy estimates.

    This all is a bit esoteric and unnecessary for a simple home weather station. But since this project is aiming for a station that has calculable uncertainties, it is quite important. For example, each of the various sensors (e.g., pressure, humidity, temperature, etc.) generally output temperature.  Each has a different error band though.  By having statistically calculable error bands, all of these temperatures can be statistically compiled with a specified confidence interval and that will improve the station readings dramatically.

    All of that means better accuracy with a lower cost.

  • U.S. National Oceanic and Atmospheric Administration (NOAA)

    sparks.ron10/11/2018 at 22:14 0 comments

    Just found out about the Citizen Weather Observation Program (CWOP) hosted by NOAA. The have a wealth of data that I am working my way through.  In particular the previous project logs show my concern with accuracy for wind speed and relative humidity. It turns out that those concerns were well placed as they are difficult things to accurately quantify.

    From their information and other sources I have decided that I need to make this station in a way that allows aspirated temperature and humidity measurements.  My own experiments show that in the gulf coast U.S. (and other equatorial areas), humidity above 80% is common and becomes a real problem for nearly all "membrane" type electronic humidity sensors.  For that reason I am developing an aspiration method that will allow for three simultaneous sensors:

    1. Electronic digital temperature & humidity sensor
    2. Dry bulb digital temperature sensor
    3. Wet bulb digital temperature sensor

    Having a wet bulb system really adds to the complexity, but seems unavoidable if reliable low cost humidity measurements above 80% RH are needed.  On the other hand, the wet bulb system falls short of design goals for very dry (less than 15%) areas like deserts and for RH measurements below freezing.  My hope is that the membrane sensor will fill in those weaknesses.

    My current plan is to use common PVC fittings for the aspiration system because I don't want to take the time to learn enough 3D software to model it for 3D printing.

  • Anemometer input processing

    sparks.ron10/01/2018 at 17:51 0 comments

    Just finished concept review for the anemometer input.  As I noted, some form of input conditioning will be required (and maybe isolation?).  When I did the spreadsheet to look at the time intervals per rotation across the range of the instrument I found that a low clock speed counter is all that is required.  I also did an complex math curve fit to the calibration data from the manufacturer to allow me to look at the edge cases and what timing would be required.  What I found is that for this particular anemometer sensor the curve "bottoms out" at a smidgen above 1 mph.  But from my experience in the past I think that anything below 1.5 MPH (0.67 m/s) is unlikely to be useful.  Wear, bearing drag, dust/dirt, etc. all create a start-up drag that is unpredictable.

    The sensor is also unlikely to realistically survive at much above 100 MPH, so I looked at that and 120 MPH (45-54 m/s).  When using a period counter for timing, this upper speed limits the resolution at the top end and the starting speed creates the maximum count required without roll-over.

    By balancing these two factors it led to a clock speed choice of between 30-60 Hz and a 16 bit count.  This can be achieved with about $5 of logic level integrated circuits (ICs).  I found a nice clock generator with an inbuilt divider that is programmable from 0-22 bit with an internal clock.  When I put that in my spreadsheet for the anemometer, it gave optimum results with a divider of 15.  That will output a clock of 31.9824 Hz leading to a count range of 59,921 to 625 across the desired range.

    I plan to couple this with a Schmitt trigger and debounce input.  Then a parallel to I2C output finishes the process.  Also I selected a D-style latch that can be used to get the time count from the start of the rotation to the direction arrow pulse.  The time between these when compared to the time between speed pulses gives the wind direction (by multiplying that ratio times 360).

    EDIT:

    Oops, I just realized that the direction resolution will be dependent on the minimum number of clocks per revolution.  So I need to modify and re-validate my spreadsheet.

    Once the wiring schematic is roughed out I will order the parts to breadboard it.

  • Sensor information and status

    sparks.ron09/30/2018 at 22:27 0 comments

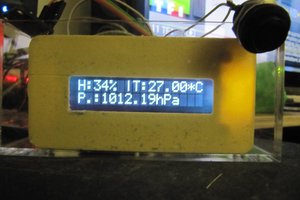
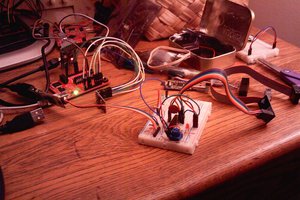
    I'm back on this project as a priority and making some headway.  I began prototyping MCUs and sensors a few weeks ago and have created the following test bed/prototype:

    • ESP8266 MCU (will be the controller of the Remote Terminal Unit)
    • 32x128 OLED display (local readings and menu)
    • Temperature/Humidity sensors (SHT11, DHT22 [AM2302], SHT35-DIS)
    • Real Time Clock (RTC)
    • AS3935 Lightning sensor

    and I have an HX711 load cell sensor working. The load cell will be used for a subset of this project and used for bee hive monitoring.

    All of the above components have been working together and I am now in the process of building a proper software framework for the final project code.  Things have now gotten complex enough that I have begun outgrowing the "quick and dirty" code in the Arduino IDE.  As a result I got an Eclipse instance working and installed the wonderful Sloeber plug-in.  My future code development will be there.

    I also have started a github repository where I will put any code that is not fully embarrassing, as well as project documentation and spreadsheets.

    Status - most recently I began real-world testing of the DHT22 sensor, thinking it would be a less costly option for the bee hives.  Sadly they fail fully in our weather.

    Here in the Houston, Tx area we often have long periods of very high humidity. I have placed several DHT22s outdoors. They are under a roof so they are not subject to rain, any direct moisture and we are too far inland to have salt air.

    Thus far all of them have begun giving false humidity readings after a day or two. Our typical day has been between 70% and 100% humidity with the temperature between 70F (21C) and 94F (34C).

    [N.B., yes that is correct, our dewpoint has not been below 21C for the last 4 weeks or more]

    In the failure mode the sensors continue to give humidity readings but the readings are about 15% RH too high.

    It appears this is a saturation problem and basically renders them useless for anything except air conditioned spaces.  I have not tried to recover them or recalibrate them because I want a reliable sensor and will not be using these for the foreseeable future.

  • Anemometer Calculations

    sparks.ron02/21/2017 at 18:24 0 comments

    I did a bit more thinking about the anemometer. The way the units I have (and have seen) work is by closing a reed switch with a magnet on the rotating cups. Both of them use the rotation speed to convert to wind speed. The interesting thing about wind speed versus rotation speed in an anemometer is that it is a "segmented" equation. In my mind I see it as analogous to a pump curve in fluid flow. What you see in both cases is a low flow regime where the inertia and friction forces dominate. In the middle region the movement is controlled by a "positive displacement" line. Then at the higher speeds you begin to see the effects of drag and edge spillage dominate.

    The anemometer I am going to re-purpose is from Peet Bros., but the concepts and equations would be the same for my old Davis unit or even one that was DIY. Only the constants would change. For my anemometer the change from "slow" to "middle" happens about 8 MPH. The shift from "middle" to "high" happens at 135-ish MPH. However, at that speed the anemometer would have long since self-destructed. Therefore I am only going to look at the range from calm to 110 MPH.

    When I do the math from the anemometer equations (which I will upload later in the project when I have cleaned up my ugly spreadsheet), I find that across the wind range of 1.5 MPH to 110 MPH, the output will vary between about 0.5 pulses per second (PPS) up to 145 PPS. That is too slow to easily measure as a frequency but will be easy to do as a period measurement which is then inverted in software to be a frequency.

    The bottom of the range at 1.5 MPH is likely below the speed required for the wind to overcome the friction in the anemometer and start it turning. 0.5 seconds is 2000mS and on the upper end of 145 PPS, that would be about 7 mS. That is a very large range for a sensor, but not a problem for software. Using a non-blocking interrupt counter on the Arduino will likely be all that is needed, apart from input conditioning.

    On the other hand, since the input will need some passives and a Schmitt trigger to condition the input, it would be very easy to add a gated counter and handle the counting at the input before "bothering the Arduino" with an interrupt. I need to look at the pros/cons of that. Any method used will need to gracefully handle a rollover condition in the counter for times when the wind is calm or too slow to turn the anemometer.

View all 15 project logs

Enjoy this project?

Share

Discussions

sparks.ron wrote 09/09/2017 at 03:19 point

I am having second thoughts about not doing this on WiFi.  I will post to the log soon and explain my new approach.  In essence the ESP8266 is a game changer for WiFi coupled with Ethernet.  I now plan to do both and use an MQTT publish method for data transfer.

  Are you sure? yes | no

sparks.ron wrote 12/08/2016 at 20:57 point

That would be pretty straight forward as a "Phase 2" once the prototype is working well and ready for expansion before committing to a PCB.  The option that pops to mind is the Adafruit FONA 3G Cellular Breakout (#2696) at about $80 US and can include free service from Ting mobile (which works on the T-Mobile or Sprint networks).

The big issue would be whether there is 3G network coverage in the area where the system is setup.  That is not a problem around cities, but in the areas where realtime data is sparse, network coverage may not be available/reliable and the data logging to a flash drive or card would be critical.  That is why I have been focused on the logging aspect first.

Thanks for the great suggestion, I will definitely look into it further once the version 1.0 is up and running.

  Are you sure? yes | no

Winston wrote 12/08/2016 at 14:42 point

You can fill what I see as a gaping hole in economical remote weather station monitoring by having your station send its data via cell phone SMS. Every economical and DIY weather station product I've seen always requires data network access by either wifi or a more expensive cell phone data service.

  Are you sure? yes | no

sparks.ron wrote 09/10/2018 at 00:15 point

Your comment was well taken.  I decided to investigate the options for wireless.  When I did, I found that the problem of communication method was only one piece of a huge puzzle.  The protocol, the packaging method, the server, the client, local data storage, time tracking, battery consumption, and many other pieces.  For now it looks easier to go wireless than to do wired, so that is what I have decided to do. Thanks for the suggestion.

  Are you sure? yes | no

Similar Projects

Does this project spark your interest?

Become a member to follow this project and never miss any updates