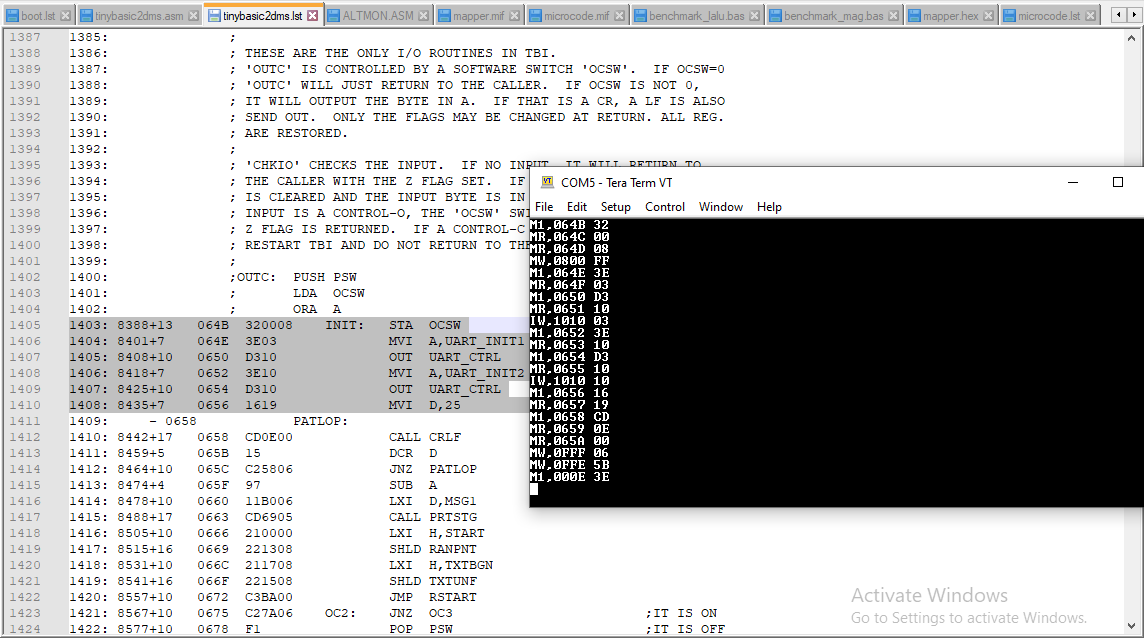
Much of the time developing any computer - related project is spent debugging. Hobby projects with FPGAs are no exception, if anything the debugging time is even more as the computer itself is defined in software.
In initial stages, simple LEDs are very useful for basic debugging (e.g. "does PC even increment?", "which microinstruction address is it executing" etc.), and switches and buttons allow for doing this cycle by cycle or at any speed. But at some point, more is needed. Luckily, very custom debugging circuits can be written together with the actual device and tailored to exactly its function.
In this case, a "debugtracer" component was added to the system. Its function is pretty simple:
- Upon reset (or special "load" signal), load the internal 5-bit reg_match register
- Each bit in the reg_match allows matching M1, MEMRD, MEMWR, IORD, IOWR signals (in other words, any combination of I/O or MEM cycles)
- If the match between reg_match and control signals on the CPU control bus is detected, lower the READY signal for CPU and "freeze" the cycle
- With CPU cycle frozen, start a sequence (driven by baudrate clock, in this case 38400) to sample state on the CPU bus (16 bit address, 8 bit data, control) and output that to provided serial TXD output
- Finish the record by sending CR and LF sequence for convenient text tracing (0DH 0AH)
- Check the continue signal, if low repeat (6) otherwise (7)
- Raise READY high (so CPU can continue with next cycle), go to step (3)
Given that the debugtracer already listens to (almost) whole CPU bus, it is easy to also respond to special instructions to turn on/off the tracing. This is useful in poll-type loops (example when waiting for a character from ACIA in the modified Tiny Basic source):
GETLN:  RST  2                          ;*** GETLN ***
        LXI  D,BUFFER                   ;PROMPT AND INIT.
GL1:    CALL CHKIO                      ;CHECK KEYBOARD
;------------------------------------------------------
    OUT 00H;    TRACE OFF
;------------------------------------------------------
        JZ   GL1                        ;NO INPUT, WAIT
;------------------------------------------------------
    OUT 01H;    TRACE ON
;------------------------------------------------------
        CPI  7FH                        ;DELETE LAST CHARACTER?
        JZ   GL3                        ;YES
        RST  2                          ;INPUT, ECHO BACK
        CPI  0AH                        ;IGNORE LF
        JZ   GL1
        ORA  A                          ;IGNORE NULL
        JZ   GL1
        CPI  7DH                        ;DELETE THE WHOLE LINE?
        JZ   GL4                        ;YES
        STAX D                          ;ELSE SAVE INPUT
        INX  D                          ;AND BUMP POINTER
        CPI  0DH                        ;WAS IT CR?
        RZ                              ;YES, END OF LINE
        MOV  A,E                        ;ELSE MORE FREE ROOM?
        CPI  BUFEND AND 0FFH
        JNZ  GL1                        ;YES, GET NEXT INPUT
Here is a sample trace matching all signals (every CPU bus cycle). The format is:
<type>,AAAA DD<cr><lf>

Tracing with symbols
With a well-structured trace text records it becomes possible to intercept them, match them up with assembly listing file and display them in rich symbolic format. This is possible by running a simple utility on the host which:
- Loads the selected listing file from disk (path can be specified on command line or prompted for using the standard windows file select dialog)
- Parse the file into a dictionary with AAAA DD (address and data) as keys
- Open a COM port to listen for incoming tracer messages
- If a message comes in, parse it, extract M1 records and match with the dictionary in memory
- If there is a match, display full line from listing file otherwise just the raw trace record
- allow flipping RTS COM signal to start / stop tracing
Here is the event handler that fires on every received character from COM port (note that LF (presumed end of trace record) triggers the action:
        static void Port_DataReceived(object sender, System.IO.Ports.SerialDataReceivedEventArgs e)
        {
            string received = comPort.ReadExisting();

            foreach (char c in received)
            {
                if (c == LF)
                {
                    // leave out the previous CR (TODO - check assumption it was a CR...)
                    string traceRecord = sbTraceRecord.ToString(0, sbTraceRecord.Length - 1);
                    string[] traceValuePair = traceRecord.Split(',');
                    string recordType = traceValuePair[0].ToUpperInvariant();
                    switch (recordType)
                    {
                        // see https://github.com/zpekic/sys9080/blob/master/debugtracer.vhd
                        case "M1":  // instruction fetch
                            if (traceDictionary.ContainsKey(traceValuePair[1]))
                            {
                                Console.WriteLine(traceDictionary[traceValuePair[1]]);
                            }
                            else
                            {
                                Console.ForegroundColor = ConsoleColor.Yellow;  // YELLOW for unmatched record
                                Console.WriteLine(traceRecord);
                            }
                            if (profilerDictionary.ContainsKey(traceValuePair[1]))
                            {
                                // increment hit count
                                profilerDictionary[traceValuePair[1]]++;
                            }
                            break;
                        case "MR":  // read memory (except M1)
                        case "MW":  // write memory
                        case "IR":  // read port
                        case "IW":  // write port
                            Console.ForegroundColor = ConsoleColor.Blue;    // BLUE for not implemented trace record type
                            Console.WriteLine(traceRecord);
                            break;
                        default:
                            Console.ForegroundColor = ConsoleColor.Red;     // RED for unrecognized trace record type
                            Console.WriteLine(traceRecord);
                            break;
                    }
                    Console.ResetColor();
                    sbTraceRecord.Clear();
                }
                else
                {
                    sbTraceRecord.Append(c);
                }
            }
        }
Note that the event handler above really only cares for M1 cycles. However it could be extended to handle all others and display a memory and I/O map in real time. Even if other devices in the system can modify the memory or I/O, this simple way still provides 100% accuracy at the read time (because by its nature always shows the state as it is read by the CPU).
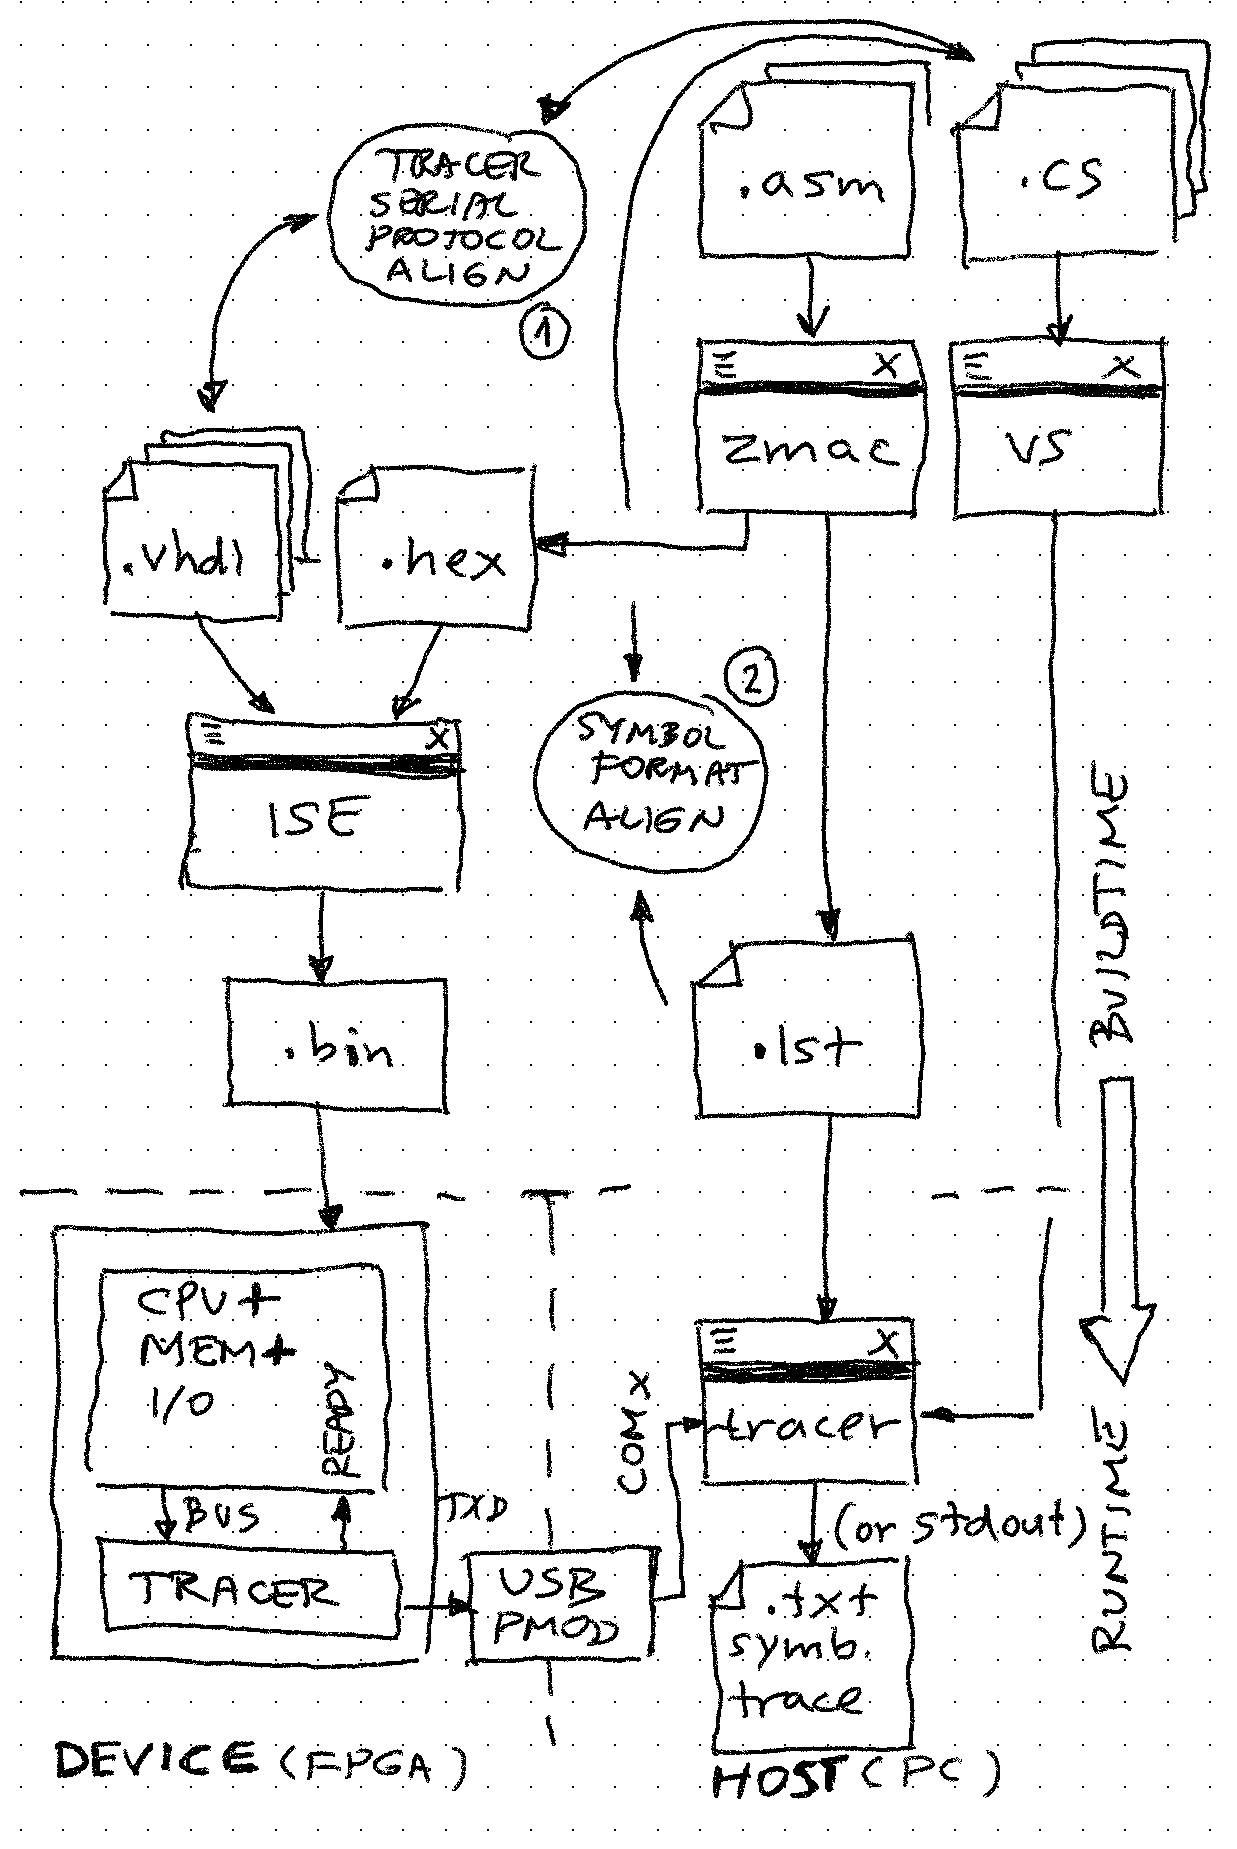
For all of this to work well together, all the files need to be synchronized during build time, as depicted in this toolchain flow:

 zpekic
Discussions
Become a Hackaday.io Member
Create an account to leave a comment. Already have an account? Log In.