 Kris Winer
09/23/2018
As part of my test of using a small solar cell and the BQ25504 breakout board to power an environmental data logger (using the SensorTile v.01g as a vehicle) I collected about six weeks worth of data. This is the longest stretch of data I have obtained to date. I am still not quite sure what to make of it. The data recorded on SPI NOR flash consists of ~11,000, 256-byte pages representing time and date, pressure, temperature, humidity, RGBW ambient light level in lux, eCo2 and TVOC air quality data, 3-axis acceleration, and battery voltage and state of charge. It's a lot of data for my free Open Office spreadsheet to handle and it is somewhat painful to produce graphs and analyze this much data with this free tool. I here Excel is better in this regard, but pricey.
Here is a small part of the data I managed to plot. First the pressure from July 15 to September 5, 2018:
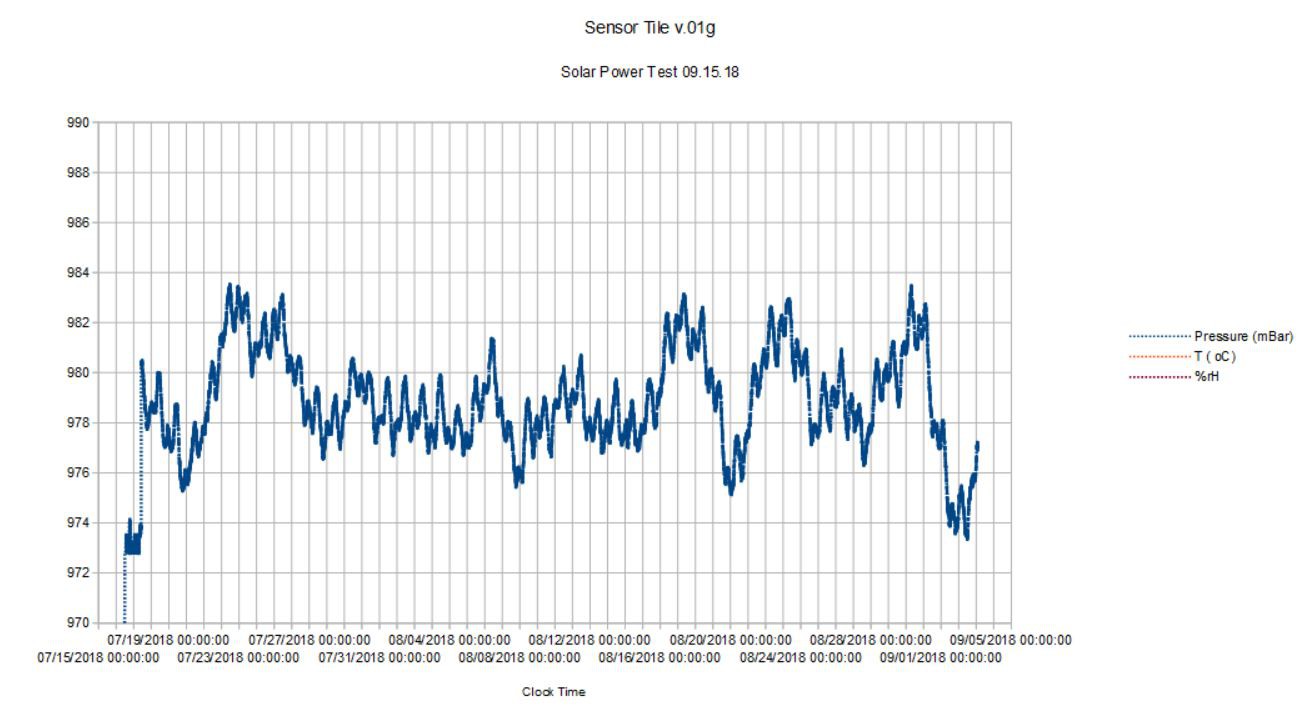
The first two weeks in August had remarkably steady air pressure; it wasn't until beginning of September that the pressure dropped significantly below Summer trend with the onset of somewhat cooler weather.
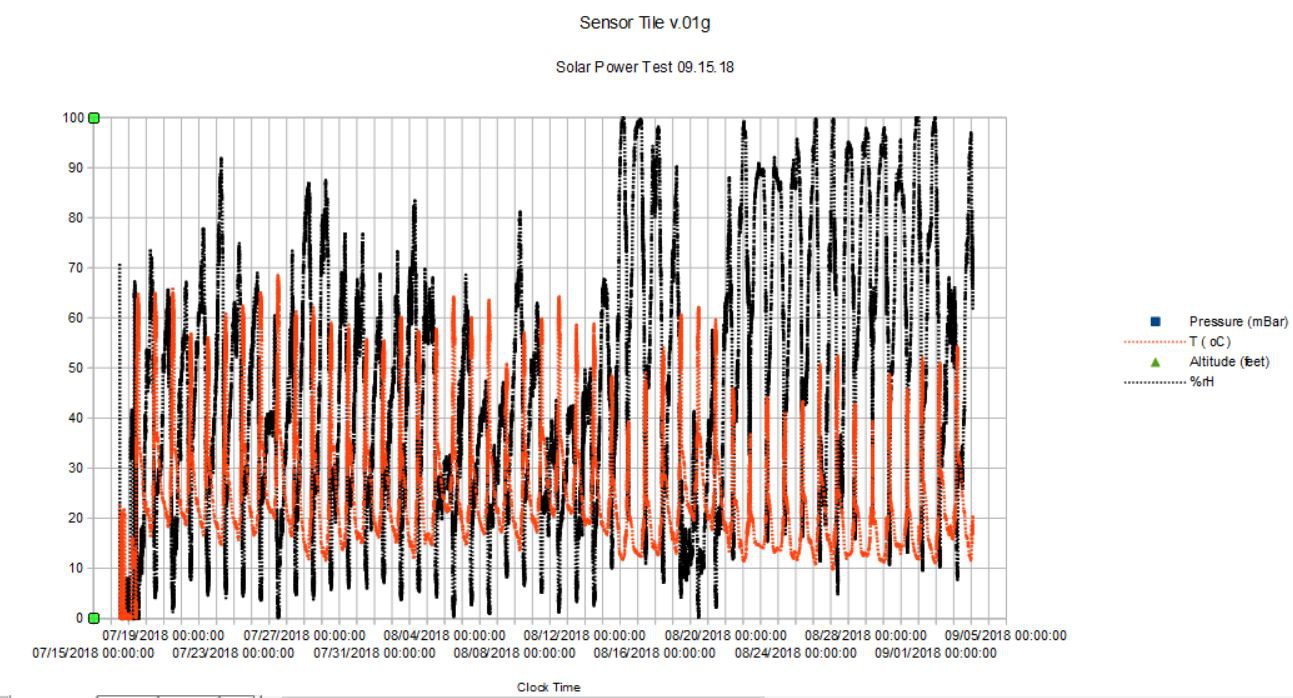
Here I am plotting the temperature (orange) in degrees Celsius and humidity (black) as relative percent. The device was placed in a glass jar and exposed to direct sunlight for a few hours a day (needed to generate power from the solar cell). Thus the temperature is somwhat unreliable due to the heating by direct sun exposure. Correspondingly, the humidity drops when the temperature rises (that's just how the sensor works). So in direct sunlight the temperature and humidity data are unreliable to say the least.
Interestingly, during the time the pressure remains in a tight band (first two weeks in August) the humidity is rather low, rarely breaching 80% even in the depth of night. And as the pressure starts to increase in variation around August 16 so too the humidity regularly reaches >90%; in other words, the data can detect a clear change in the weather pattern as well as the diurnal variations one would expect.
Best practice for the next test would be to mount the solar cell and Sensor Tile apart from each other, obviously. Likely with the solar cell mounted on top of an open-bottom container with the Sensor Tile protected from the elements and direct sun and the solar cell exposed to direct sun.
The only reason the SensorTile data was interrupted shortly after September 5 is that the humidity became saturated causing the BME280 to stop functioning (presumably by shorting VCC to GND) and the Sensor Tile MCU stopped even though the battery had plenty of charge left. This is a know problem (or at least I have seen this before) and I hope partially protecting the Sensor Tile inside of a container will prevent this from happening in a future test. We'll see.....
Discussions
Become a Hackaday.io Member
Create an account to leave a comment. Already have an account? Log In.