 Kris Winer
07/08/17
The latest experiment was a partial success. I essentially repeated the last experiment but placed the Sensor Tile outside the house, near the threshold on a portico support pillar out of the sun. Disappointingly, the first several hours of data recorded on the SPI flash were all zeroes, so something is going wrong in the packet construction. I will have to sort this out. I got 53 hours of actual data when I should have gotten ~80.
This time I recorded the equivalent CO2 (eCO2) and total volatile organics (TVOC) from the CCS811 measured at 60 second intervals, as well as the usual pressure, humidity, temperature, etc. The temperature data look familiar:
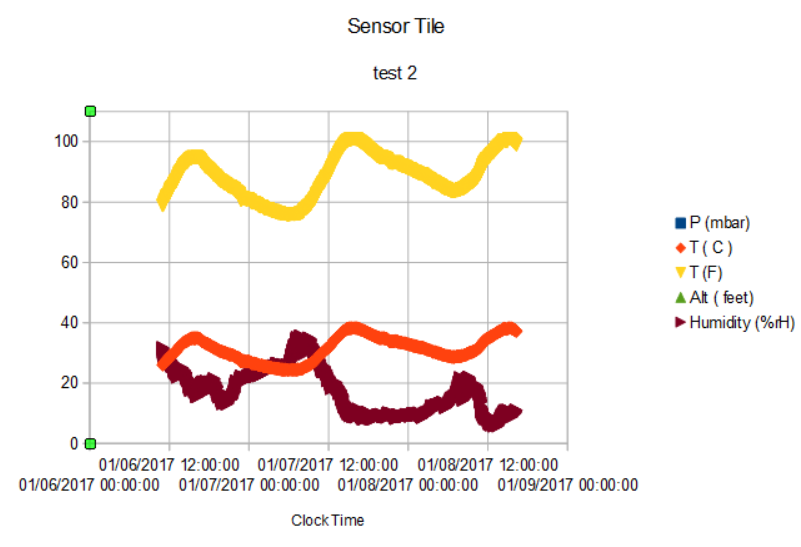
showing peaks at ~2 pm and troughs at ~4 am every day (again, this should be July not January! I have to find and fix this problem too).
The eCO2 and TVOC data are interesting:
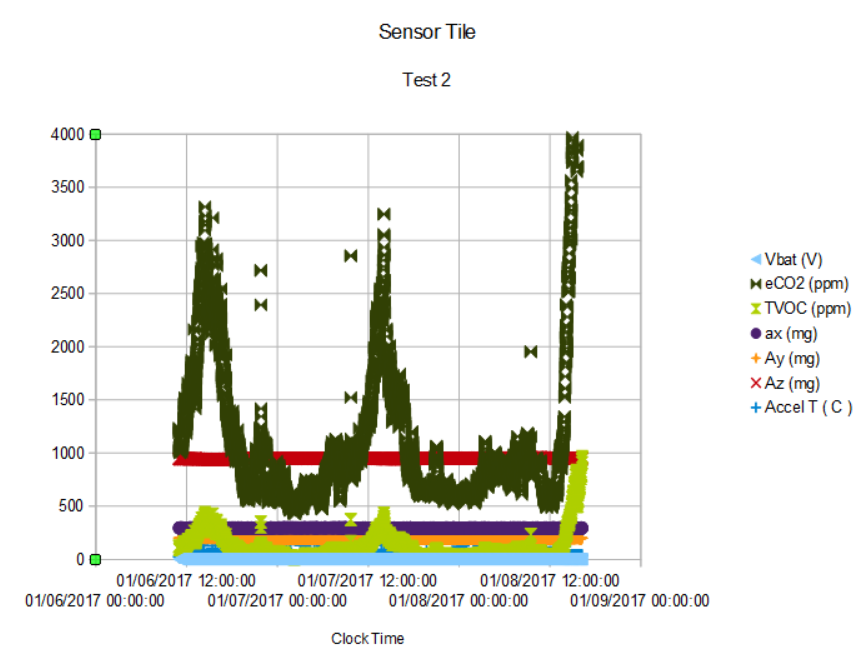
The eCO2 and TVOC levels shows a lot more sensitivity than I would have expected. Since I am compensating the CCS811 resistance measurement with current temperature and humidity data I am wondering if the large variation in eCO2 and TVOC levels is an artifact of the underlying variations of these instead. Although it makes intuitive sense that pollutants in the air would be maximum 1) in the middle of the day when people and machines are maximally active, and 2) that the volatiles and pollutants would be maximum at the hottest part of the day since this would be the condition for maximum outgassing of rotting vegetation, etc. I think the shorter duration excursions at ~10 pm and ~10 am are due to our old car arriving for the night or leaving in the morning, respectively. The Sensor Tile is close to where we park our cars.
I recorded all data at 10 second intervals but the CCS811 has a new measurement only once every sixty seconds. Yet, this was enough to capture the relatively rapid change in the eCO2 and TVOC levels. I probably do not need to measure the temperature, humidity, and pressure at 10 second intervals so I might reduce the data logging interval to sixty seconds generally since SPI flash writes use up some power. Also, with eight 32-byte samples per page and 4096 pages, there is a lot of data (even when half of it is lost) and Open Office is having trouble crunching all of it.
Astute observers will note that I have recorded the components of acceleration as well. These were pretty boring in general. I need to configure the accel with a high-pass filter and then interrupt on significant motion to see if I can capture vibrations above ambient. I have the second interrupt already configured as a tap detector. With the high-pass filter I should be able to analyze any high-frequency acceleration data with a FFT to extract normal modes. This is an outline for an earthquake detector when logging environmental data as in this experiment, or as a diagnostic for equipment faults in an industrial application.
Lot's to do yet...
Discussions
Become a Hackaday.io Member
Create an account to leave a comment. Already have an account? Log In.
I've been experimenting with one of these sensors recently and see a similar periodic trend in CO2 which I believe is a flaw with the sensor. 3000ppm is a dangerously high concentration of atmospheric CO2...enough to cause headaches and nausea.
Are you sure? yes | no