 Kris Winer
08/5/17
I ran another test of the SensorTile2 correcting some of the power issues and integer cast issues I had on the last test.
First, I disabled the power-on green led, turned off the microphone, and changed the BLE output rate to once every ten seconds. Even so, the SensorTile2 ran for just 100 hours, so an average power usage of 1.5 mA. This is almost exactly what I estimated I might save (2.1 mA from the last test - ~570 uA estimated savings ~ 1.5 mA) but still this is a little disappointing; I have to remember that the air quality sensor uses ~550 uA all by itself, and outputting BLE every ten seconds instead of every second doesn't seem to drop the power used by the nRF52 (BMD-350) module very much. I used up the 4095 pages of SPI flash for logging after ony ~80 hours. Well, everytime I run one of these tests I learn how to use the device better.
At least I am reliably getting a lot of data over a long enough time to be interesting. All of the initial trouble I was having with lost flash data, incorrect dates and times, etc is gone. Here just a reminder of what kind of data I am getting:
 and I am not even including the accelerometer data, which is available in the log, or any audio data which is not. I am still thinking how to use these vibration/sound sensors for environmental logging.
What's interesting about the eCO2 data above (SensorTile2 placed just outside my front door again in a covered location) is the changed characteristic of the signal starting at ~6 AM on August 1. The eCO2 level transitions from a subdued 500 +/- 100 ppm level for most of two days to spiking well above 1000 ppm and remaining generally higher thereafter. The transition coincides with a falling pressure (most easily seen with the pressure-derivative altitude rising from 900 to 1000 feet) and a general cooling trend. So the change in the weather seems to be able to affect the pollutant (CO2 and TVOC) levels. Looks like there is a lot that can be learned by correlating disparate data; I need to either add a larger SPI flash for longer data logging or figure out how to get a continuous stream of data for long-term logging. More on this in a minute.
I also fixed the integer cast error I had in analyzing the ambient light sensor (VEML6040) data and now I am getting much more sensible output with no negative light levels! Here is what the data look like:
 I am plotting total light received in lux as well as the red, green, and blue components in uW/cm^2. Remember the SensorTile2 was placed in a covered location so these values are quite low compared to the ones I showed in the previous log when the VEML6040 was exposed to the open air and direct sunlight for part of the day. Interestingly, the peak lux drops noticeably on August 1 corresponding to the increase in eCO2 levels, all due presumably, to the change from clear skies to cloud cover.
Zooming in we can see the relative components of the ambient light:
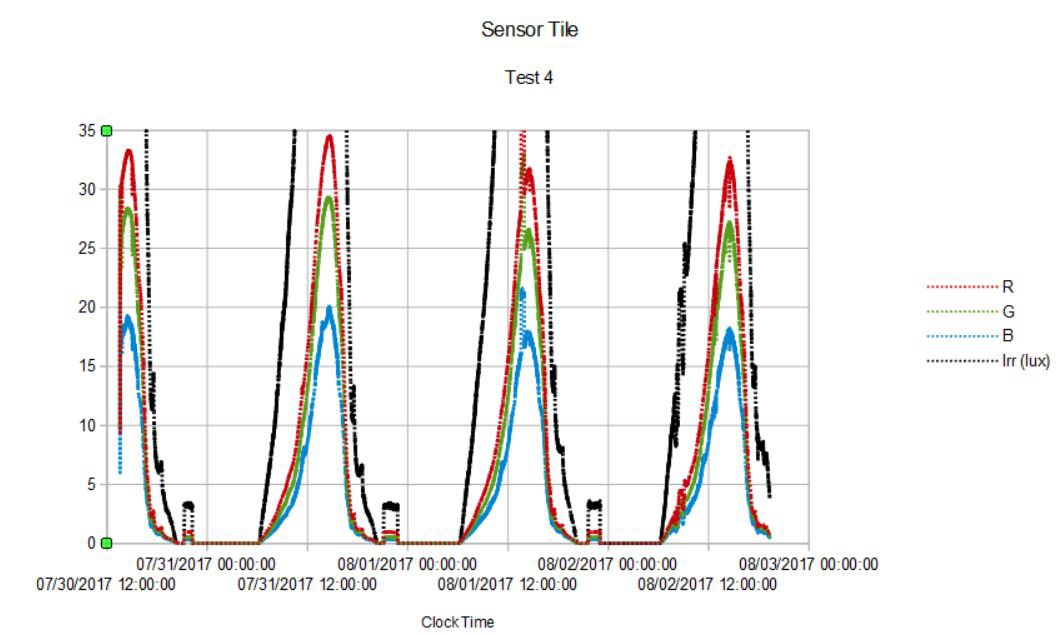 Somewhat to my surprise red and green seem to dominate the shadows; I guess this makes sense since all of the light the Sensor Tile2 sees in this covered location is scattered light and red is scattered most (that's why the sky is blue). The small excursion at ~10 PM each day is when the front porch lights are turned on.
Since I have a nifty battery monitor on the SensorTile2 and I want to see if I can have a perpetual environmental sensor the next experiment will use a BQ25504 boost converter and a solar cell to run the SensorTile2. I am particularly interested to capture the charging/discharging behavior in a location with only a few hours of sun each day. So I will essentially repeat this experiment using one of these and report results in a week or two.
Discussions
Become a Hackaday.io Member
Create an account to leave a comment. Already have an account? Log In.