 Chris Johnson
The internet has a dizzying amount of information on EC and pH. After sifting through it, I found some potentially interesting links that are detailed below.
The DIY EC meter project that inspired the original EC portion of this design
A DIY EC sensor project with with lots of great information and links
The Difference between EC and PPM
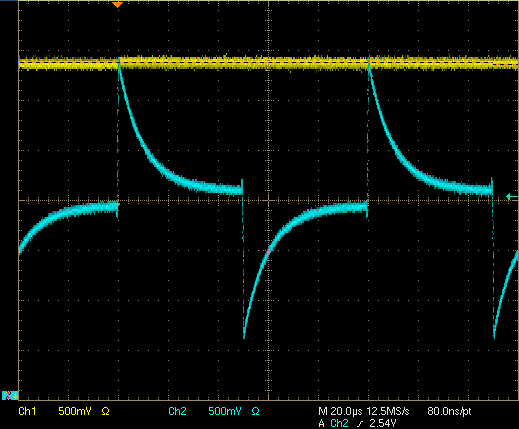
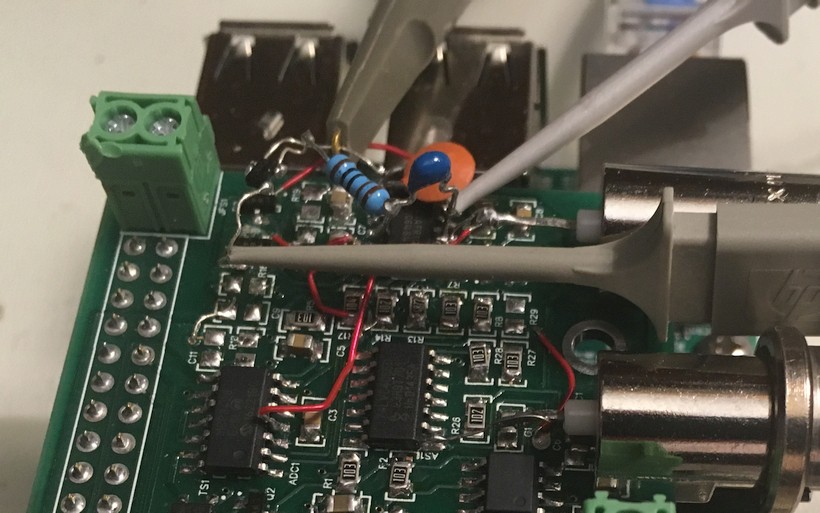
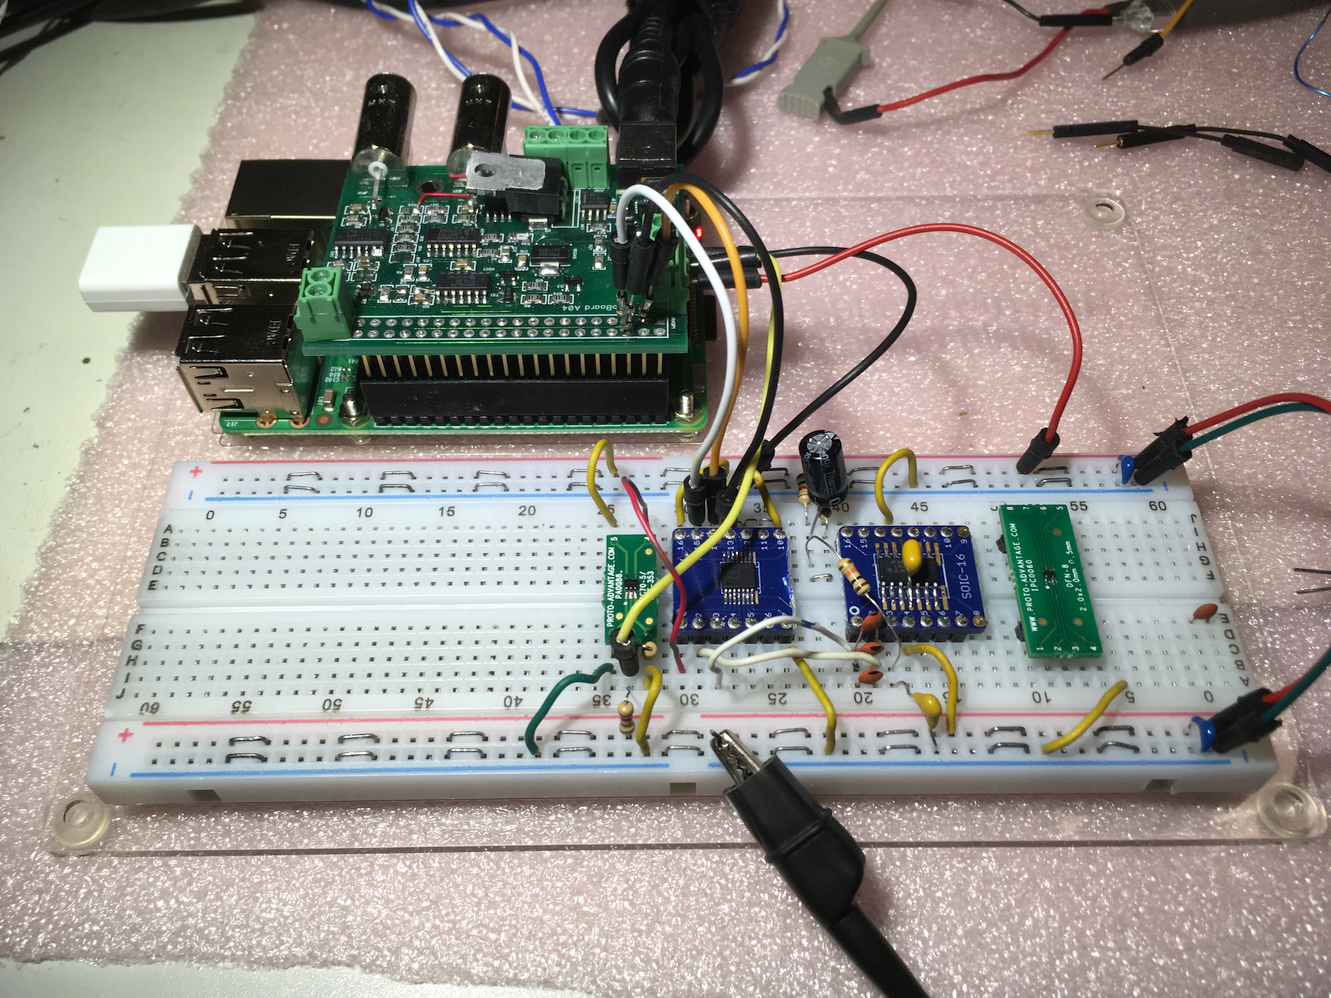 After wiring up the test circuit and figuring out how to get programmable frequency square waves out of the RPI, I started testing the digital pot and ran into the anomalous glitch shown below.
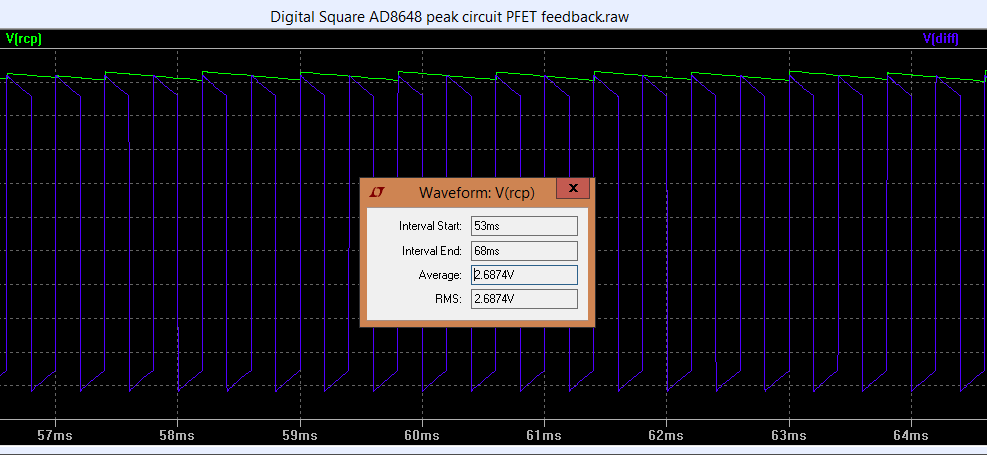
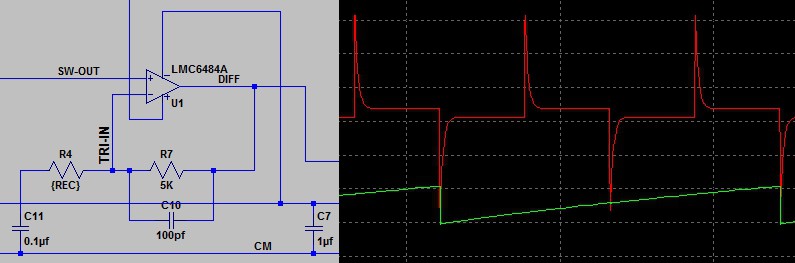
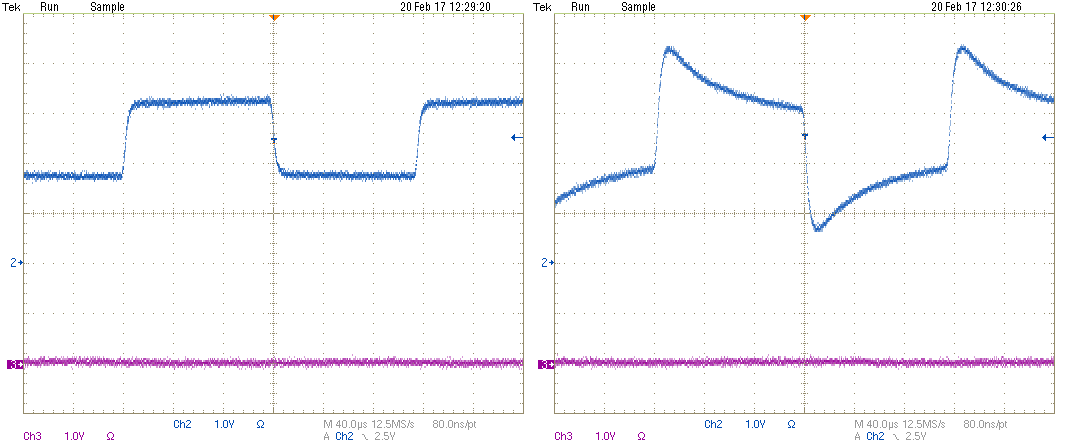
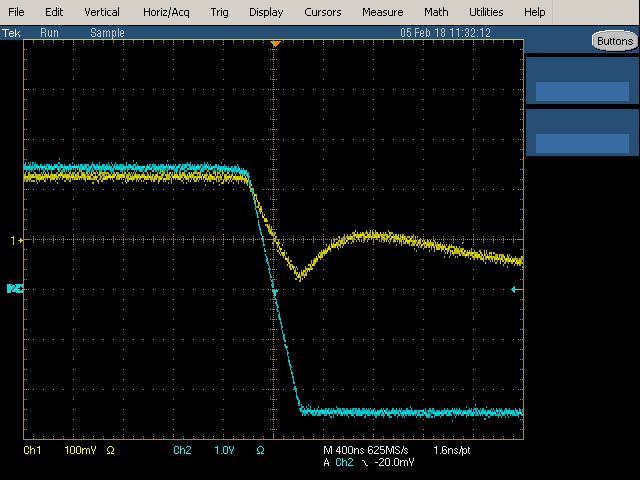 The blue trace is the 5V 12V/uS edge rate square wave from the comparator op amp output. It drives one end of the MAX5387 and the other end is connected to GND. The yellow trace is the wiper output with the MAX5387 set to divide the 5V amplitude down to about 200mv It took a while to figure out that the glitch is likely caused by capacitive feedthrough. There must be a small end-to-wiper series capacitance that allows the square wave edge to feed through to the wiper output. The wiper drives the input to the EC amplifier, so the feedthrough causes a glitch in the edges of the square wave at the output. The output glitch causes an incorrect peak voltage measurement and thus an incorrect EC measurement.
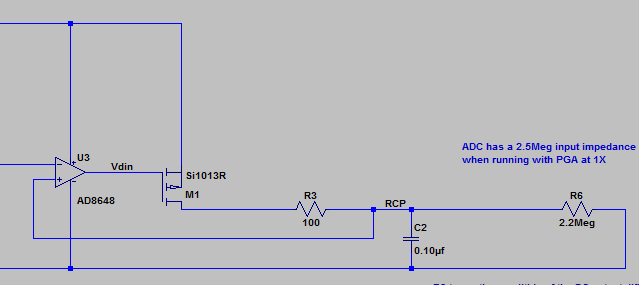


 Mitsuru Yamada
 Burkhard Kainka
 Grant Giesbrecht
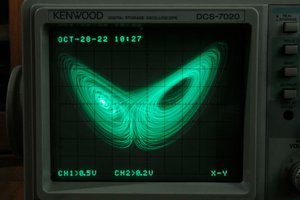
 CheeenNPP
Wow, I know I'm late to the party, but just wanted to see where this project is at. Do you have any updates on how well it works/worked? I'd be very interested in recreating this