 Chris Johnson
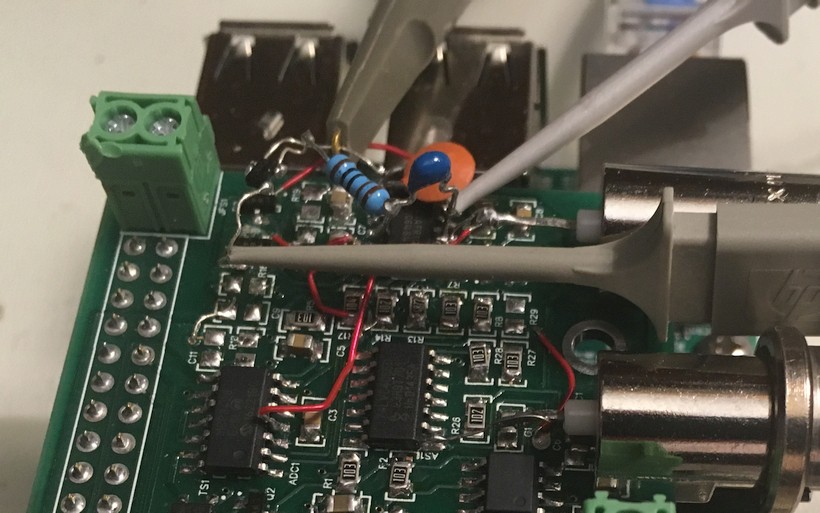
Below is a picture of a patch that gates the input to the ADC so that it is only looking at the value from the EC probe at the end of the square wave pulse, after the initial transient has settled out. It works really well, dutifully recording the voltage at this point for each pulse and averaging the values together with an RC filter. Unfortunately, this does NOT provide the correct EC value. After a lot of Googling, head scratching, and teeth gnashing, I think have a better understanding of how to measure EC.
To measure the correct value for the EC, instead of measuring the voltage at the end of the pulse, you need to measure the peak voltage at the start of the pulse. As shown below in a snippet from an LTSpice schematic, you can simulate the effect of a real EC probe by putting a capacitor (C11) in series with the simulated EC resistance (R4). In the plot to the right, the red trace is the DIFF output from the op amp and the green trace is the output of the subsequent peak detect stage. The average value of the peak detect is very close to the lower voltage peak of the DIFF output. The peak DIFF voltage is due to the current that initially flows through the solution as the ions begin to separate due to the voltage across the EC probe. As the solution "charges up", the current flow through R4 drops. Eventually the op amp behaves like a voltage follower, since R4 is essentially an open circuit. The DIFF level at the end of the pulse is thus the same as the 100mv square wave that drives the non-inverting input. Note that the peaking effect is most pronounced with high conductivity solutions.
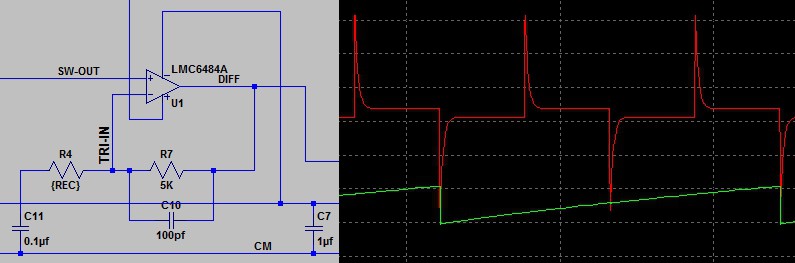
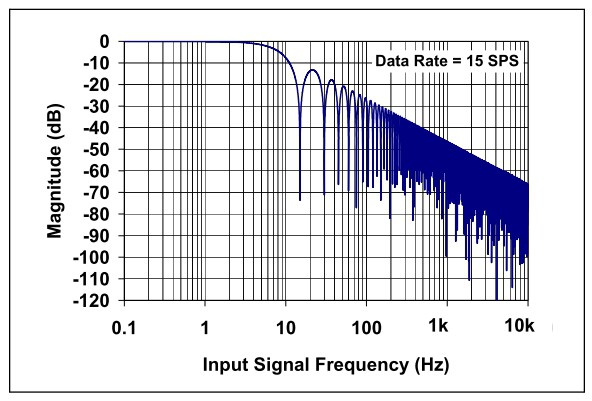
In the above circuit, the pulses are running at about a 500 Hz rate. In the final circuit, in order to provide a more accurate peak detect function, the pulses will run at about 5 KHz. As you can see from the frequency response plot for the MCP3428 ADC, the low pass filter has about 60dB of attenuation at 5 KHz. As a result, the ADC will record the average value of the peak detect voltage without any additional external filtering.
Discussions
Become a Hackaday.io Member
Create an account to leave a comment. Already have an account? Log In.