 Thatcher Chamberlin
Here's some big news - I've verified that my concept will work! As I've written before, I'm initially testing my touchscreen device in one dimension (along a line), not two (across a surface). This is because the initial circuit I built on a ProtoShield did not give me space to add a third sensor. It's just as well, though, because testing the device in one dimension takes some sources of error out of the equation. In this log I'll show you how I tested the device, what the results were, and where I'll go from here.
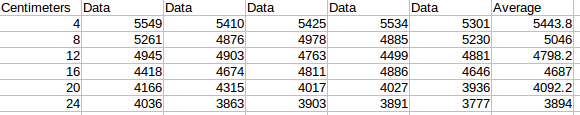
This is the spread sheet in which I gathered data and made a chart.
Test Setup
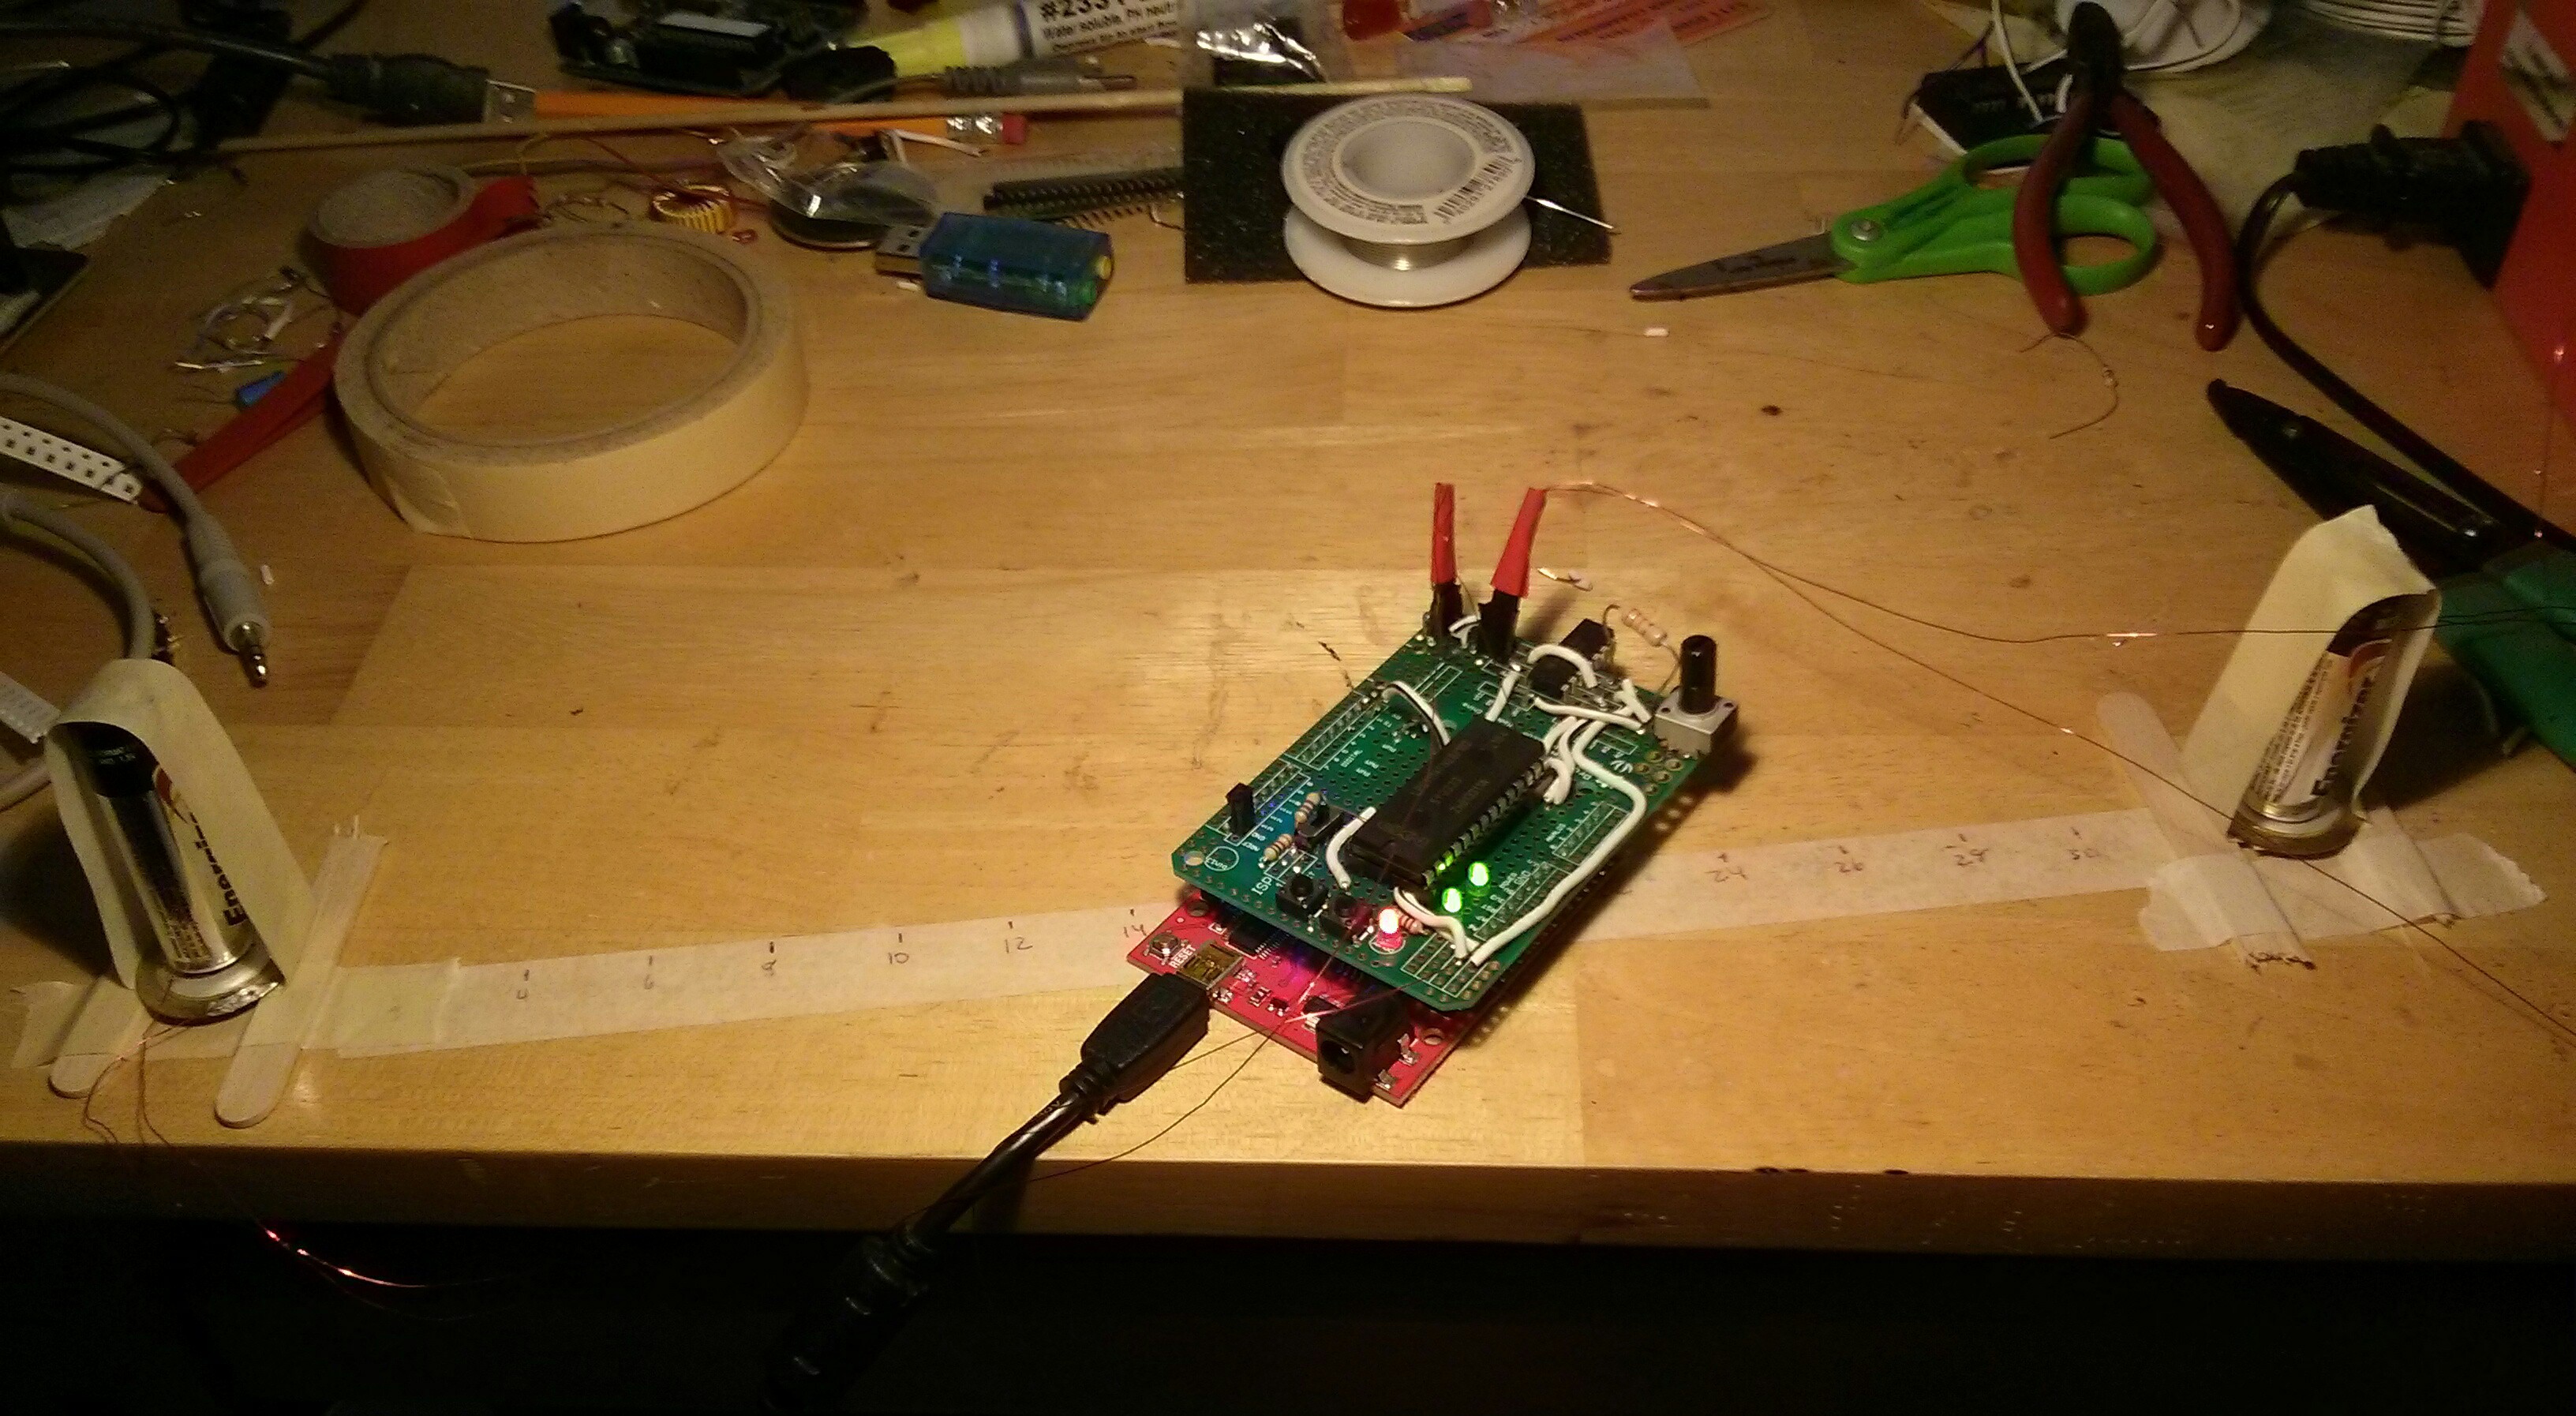
I set up the board comprised of an Arduino, a protoshield with the LPC1114 ARM chip, and some op-amps with the inputs of the op-amps connected to the piezo disc sensors. You can see this circuit in the project's current schematic. I taped some AA batteries on top of the piezo disc and rested the disc on broken-in-half popsicle sticks. Having a relatively large mass on top of the discs with a space underneath allows them to flex more with incoming vibrations and produce a higher voltage. The effect is that they are made more sensitive.
The two discs were placed just over 30 cm apart. Between the two discs I put some tape and marked every two centimeters. The tape will be used for calibration and testing. Here's what the whole thing looked like:
 I modified the code slightly so that it printed the difference in times between the two sensors in microseconds, not seconds, and printed them with tabs following them, not carriage returns. These two changes made entering the collected data into a spreadsheet much easier.
Data Collection
Once everything was set up, I started collecting data by choosing a centimeter mark to tap on, tapping on it five times, copying the data from the serial terminal into a spread sheet, and then choosing a new centimeter mark. I did this process for six points along the piece of tape. Here's what I got:
It's important to note that I did NOT do an outliers test like a Q-Test, Modified Z-Score, or similar. That means some of these data might be erroneous. Later on I'll do such an analysis on the data. However, the purpose of this test was to acquire some sore of linear relationship from the data.
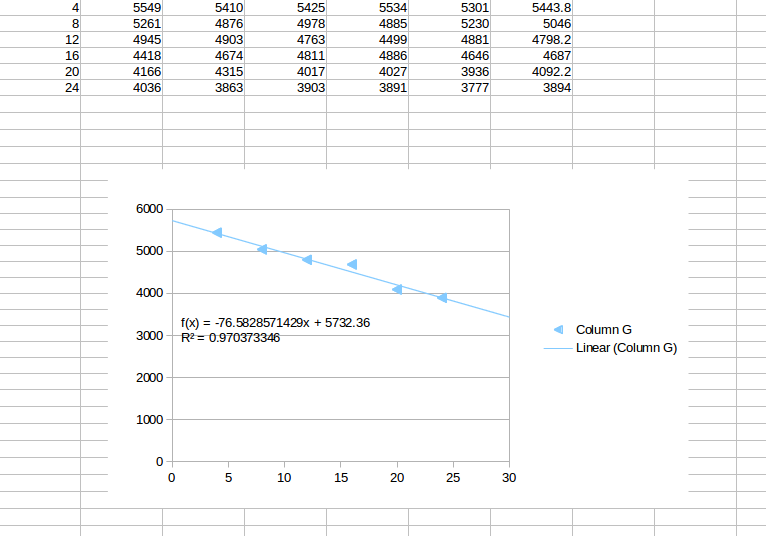
To get that linear relationship, I make a scatter plot of the Average vs. Centimeters columns and inserted a trend line. Here's that chart:
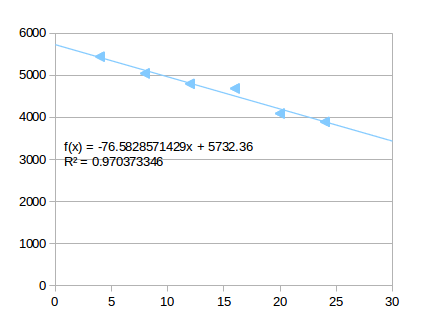
As you can see, we got an f(x) equation and an R-squared value. The R-squared value tells us how precise the line fit was - a R-squared of 1 indicates a perfect fit of the line to the data. The .970 we got indicates a strong relationship, which is good enough for me. In science one would typically strive for .990 or better, but this was just a quick test. Any outliers, which were not accounted for, could have caused the slightly low R-squared. The f(x) equation is what we're really after though: it tells us what the difference in delays should be for a given point on the line between the two sensors. With this information, we should be able to determine the point of origin of a specific vibration based on the delays in detection of the piezo sensors.
Pretty cool!
What's Next?
More tests! One test will look at the outliers of a test similar to this one. A test like that would hopefully yield a better R-squared value and a more-accurate f(x) equation. The other test (which will be more fun) will be to write a program to convert a delay printed out by the microcontroller into the location of that vibration's origin. This would be the proof of concept I need before moving on to the 2D version of this device. Stay tuned!
Discussions
Become a Hackaday.io Member
Create an account to leave a comment. Already have an account? Log In.