 PAM
PAM05/05/2017
The person is wearing the bracelet during the day.
But how could he know the level of CO and O3 during his distance?
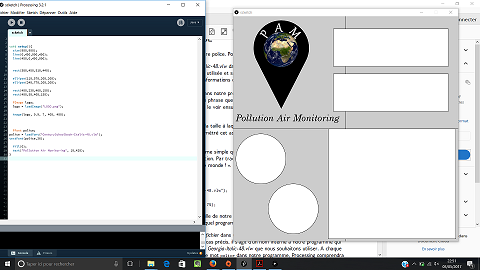
So we thought about creating an interface.
This is the muddle head below.
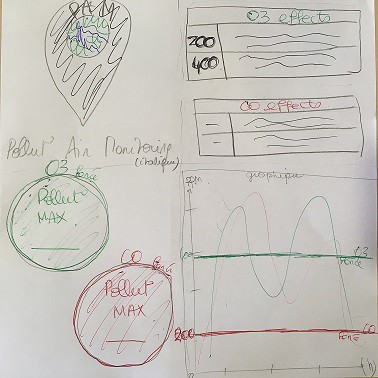
We got our logo on the left side and our quote.
We using the colour red and green, red-one for the CO and green-one for the O3.
A graphic will be created, so the person will understand the level of pollution that he used to meet during his path.
By the way, the maximum of pollution will be known, after that we will compare those informations to our tables to sensibilize people on the effects.
That is what we already made.
Thank you for reading !!! ;)
Discussions
Become a Hackaday.io Member
Create an account to leave a comment. Already have an account? Log In.