 Wassim
zigbee2mqtt is a main module in Home Smart Mesh, yet it is not that easy to fulfill a reliable netwrok where a lot of situations do not match the intuitive expectations. As examples
- manually removing devices before pairing again
- manually activating joining if a router had to be out of power
So understanding what's under the hoods allows to work around such issues and maybe even help improve it.
I added the same diagrams in my raspi github as svg and original .graphml : https://github.com/HomeSmartMesh/raspi/tree/master/zigbee
The svg format of the following diagrams can be found in the link above, unfortunately hackaday does not support/allow svg, which is important for zooming such diagrams:
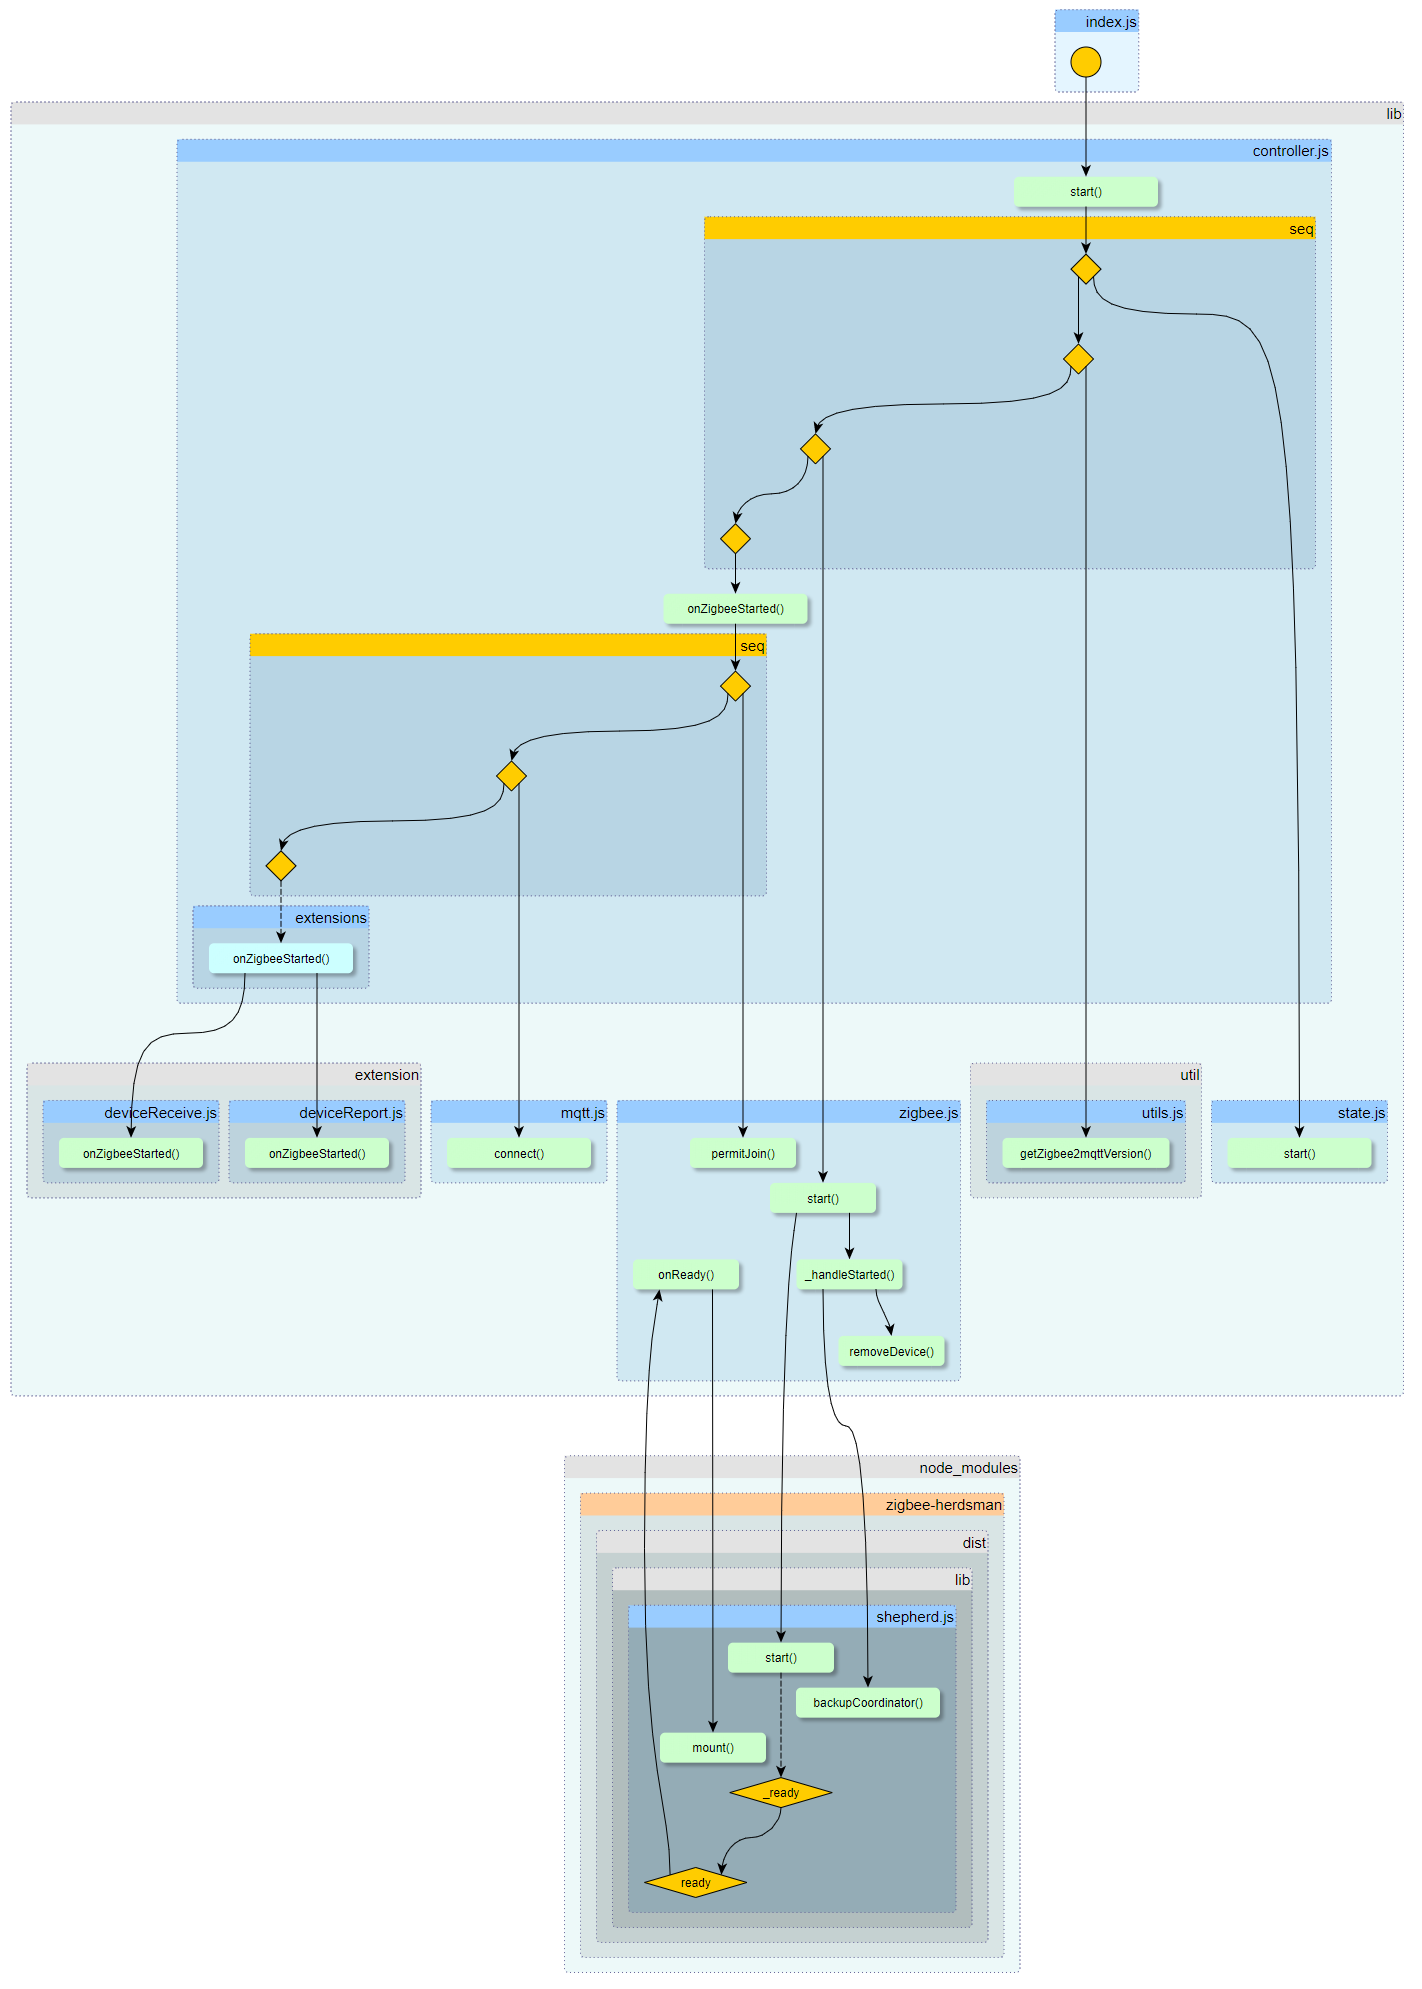
Startup
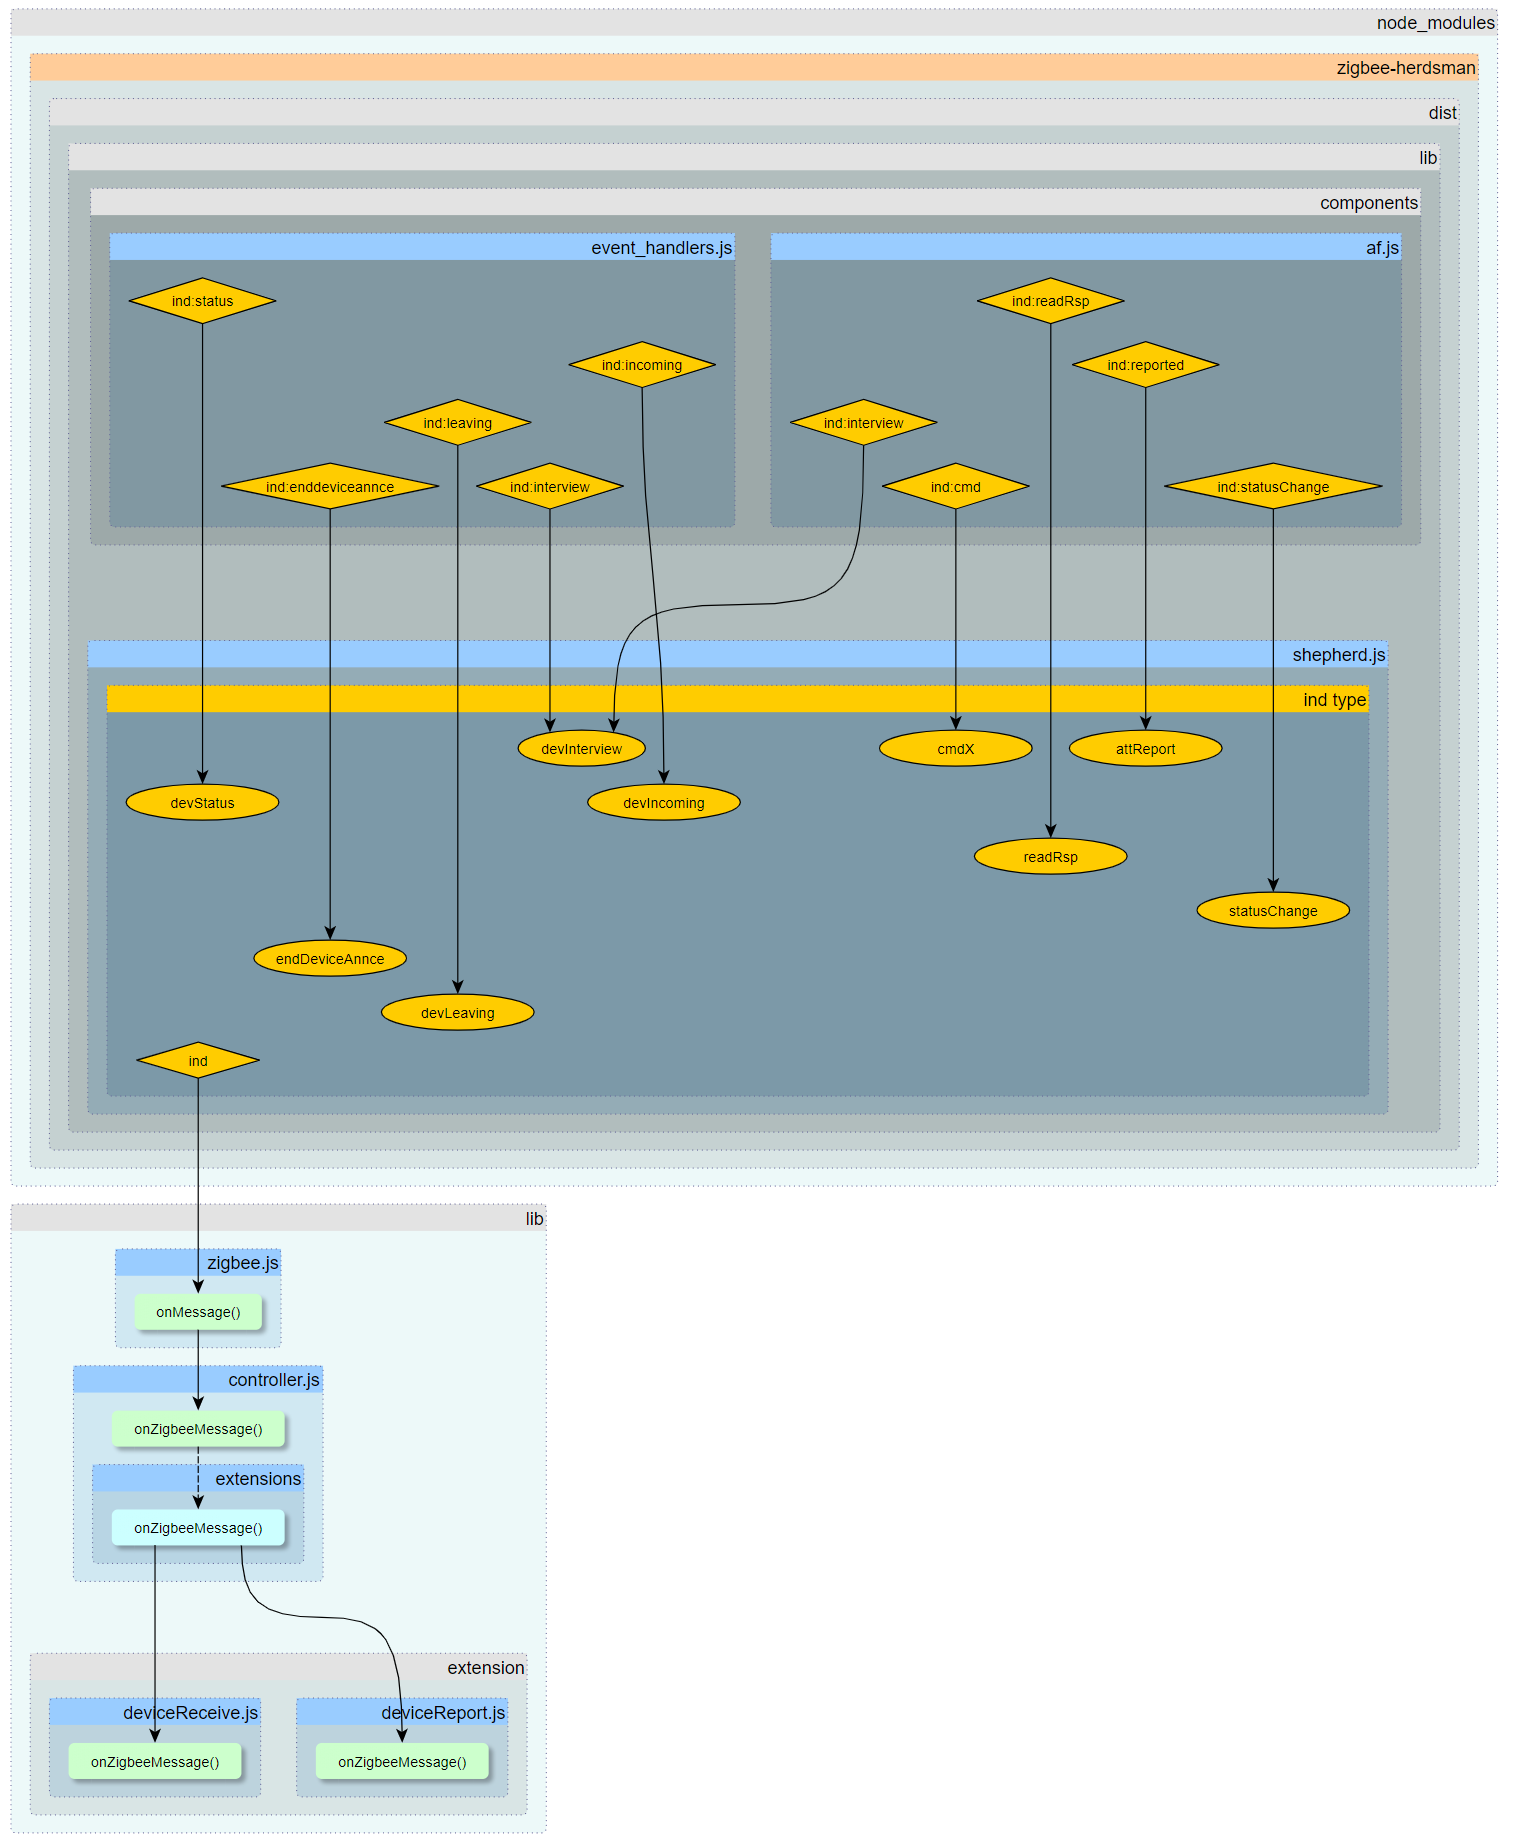
Message Events
Python to dot
what can be found in the repo is also a python tool that retrieves the graph info and store it into a file. The python is relatively unpractical in comparison to the superseding webtool of the next section
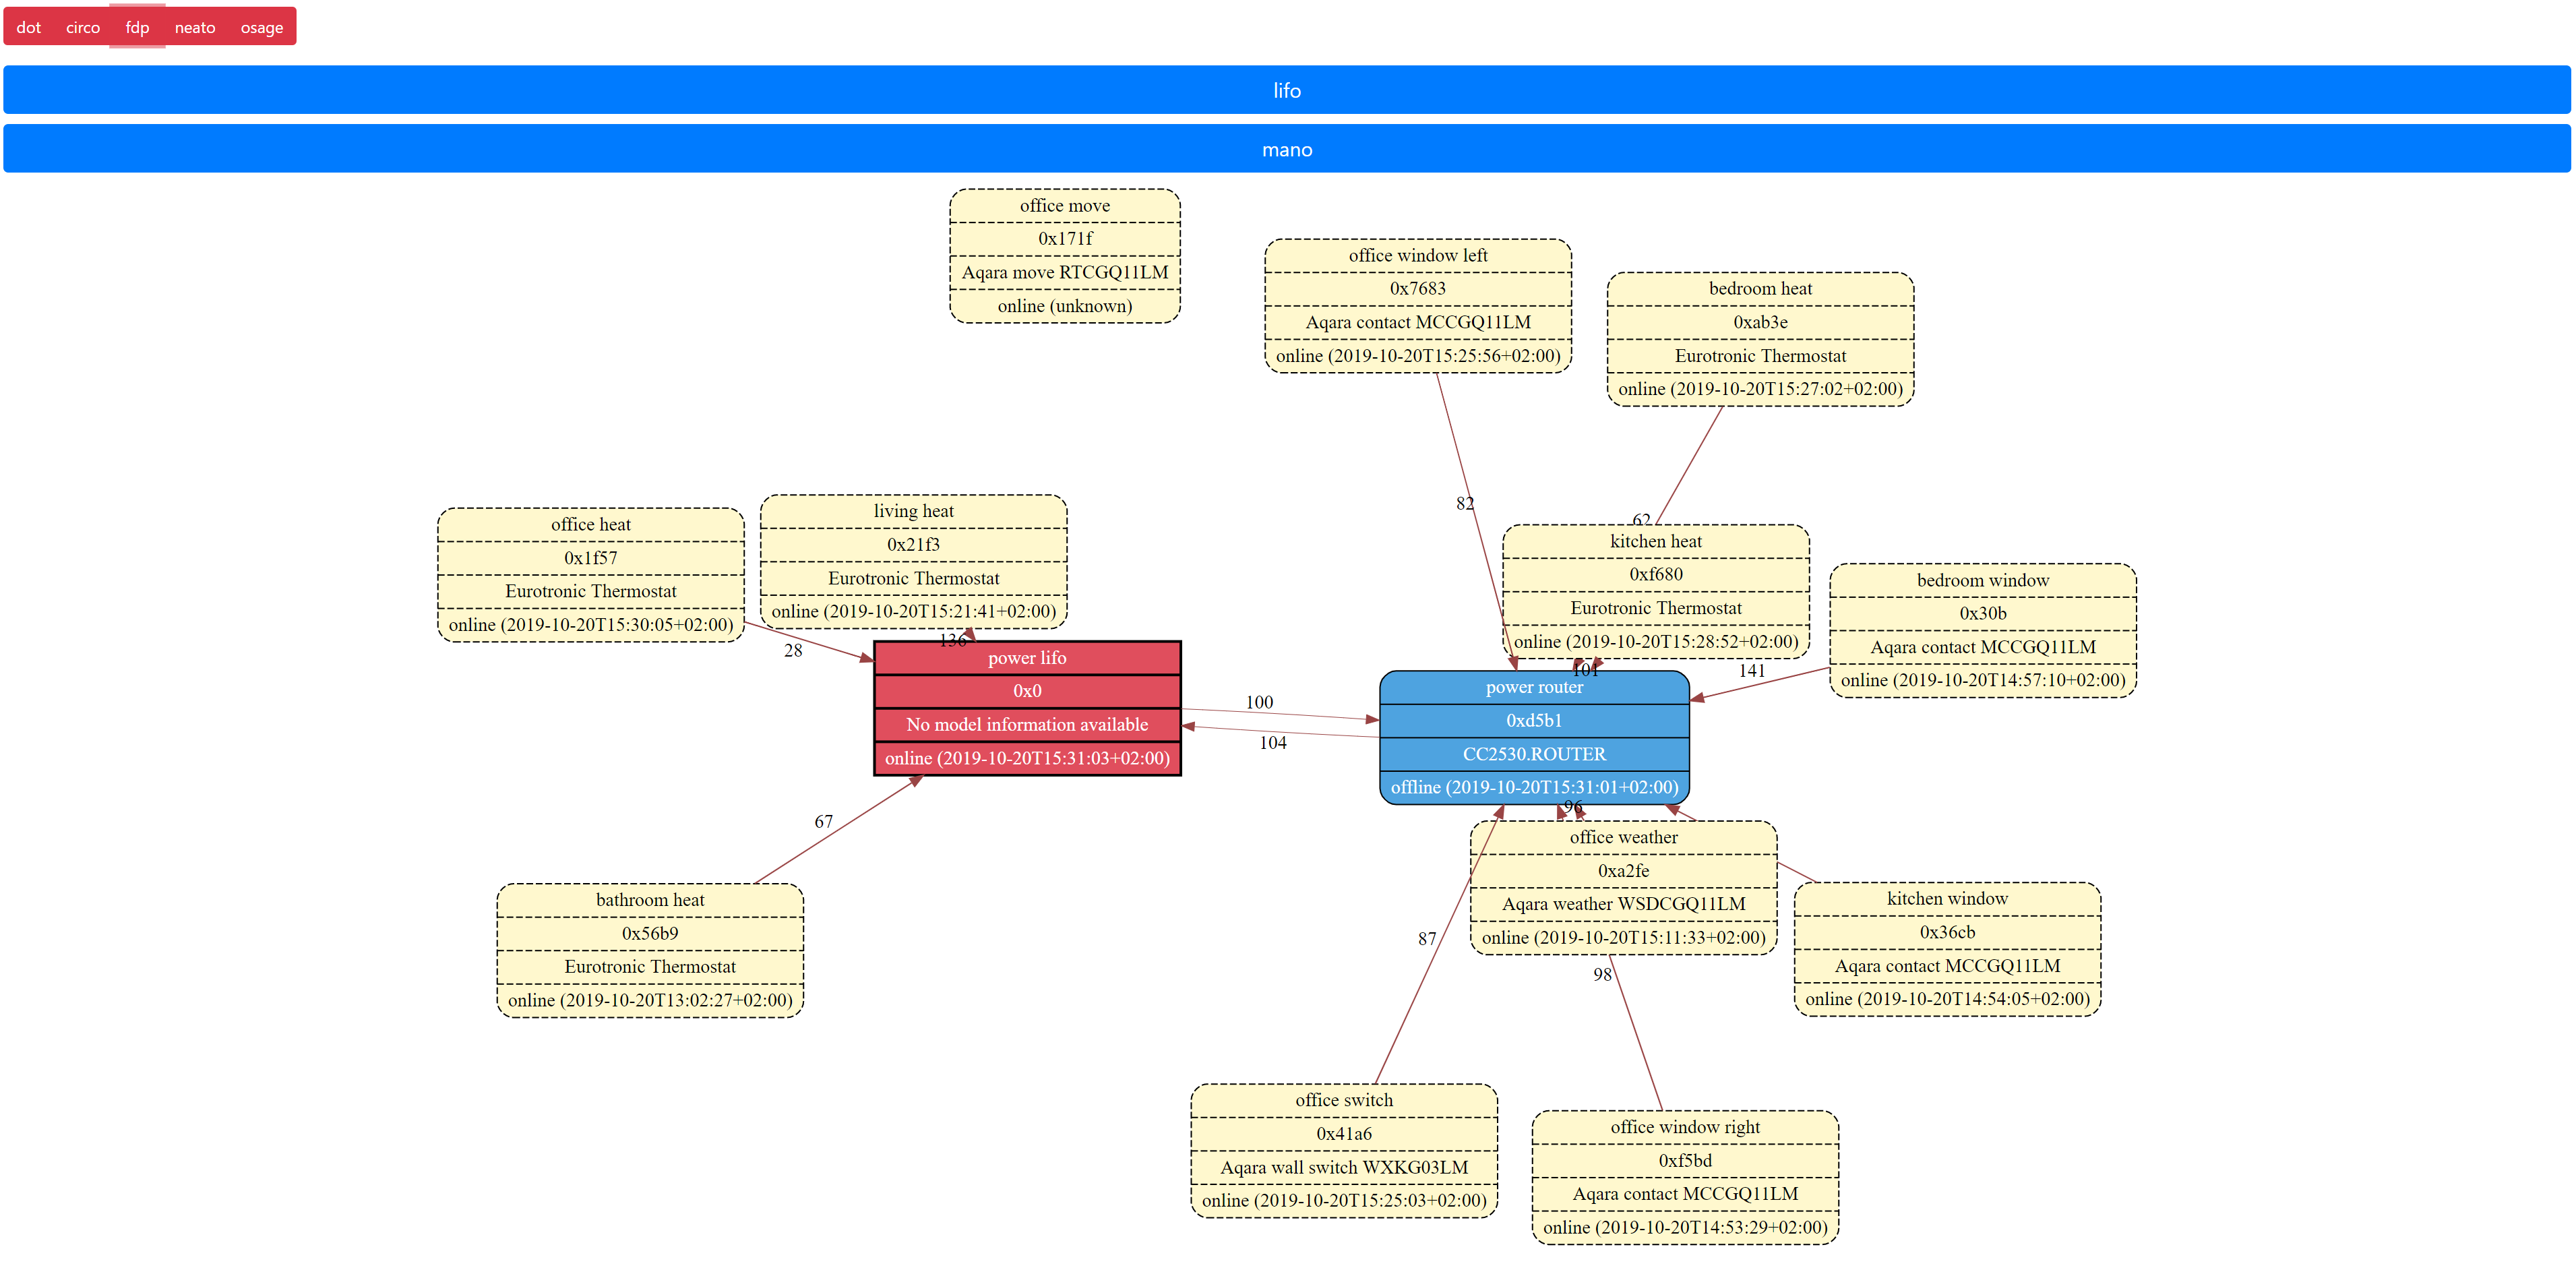
Zigbee network web viewing
This small tool is not anyhow thought to rival https://github.com/yllibed/Zigbee2MqttAssistant. But to be honest, I still did not manage to use the Zigbee2MqttAssistant due to the constraints it requires (prebuilt binaries, c sharp, lack of configuration of the prebuilt).
A mosquitto command line interface is enough for most interactivity with zigbee2mqtt, adding some aliases alos helps, so this small tool fills the gap of the last missing needed GUI for my usage, and it also brings some advantages :
- interactive SVG integration, can pan and zoom to see graphs that are huge with tiny text
- can change the graph algo layout on the fly without asking zigbee2mqtt again which produces a network scan for nothing. Different algos are more adapted to different networks
- neato : good organisation but non compact
- fdp : best average result
- circo : best for complicated graphs but explodes in large space
- can add custom buttons for those who have multiple zigbee2mqtt instances
- can add a specific algo per instance
- can add a renaming so win space as graph viewing is all about space
Discussions
Become a Hackaday.io Member
Create an account to leave a comment. Already have an account? Log In.