 Joan Horvath
 So far, we saw that derivatives measure the slope of a curve and tell us how fast things are changing along that curve. We also saw that an integral is just the area under a curve. One of Newton's big insights was that taking the derivative of a curve and finding the integral are what a mathematician would call an inverse operation- they undo each other, just like addition and subtraction. (Purists will note some details here where that is not quite true, but we will get to that later. There is a constant floating around we will need to deal with.)
This insight goes by the grand name of The Fundamental Theorem Of Calculus. We spent some time thinking about how to show this in a hands-on way. We decided to do some specific examples.
So if I started with a derivative, and integrated it, I would get back the original curve.
If I started with an integral function and took its derivative, I would get back the original curve.
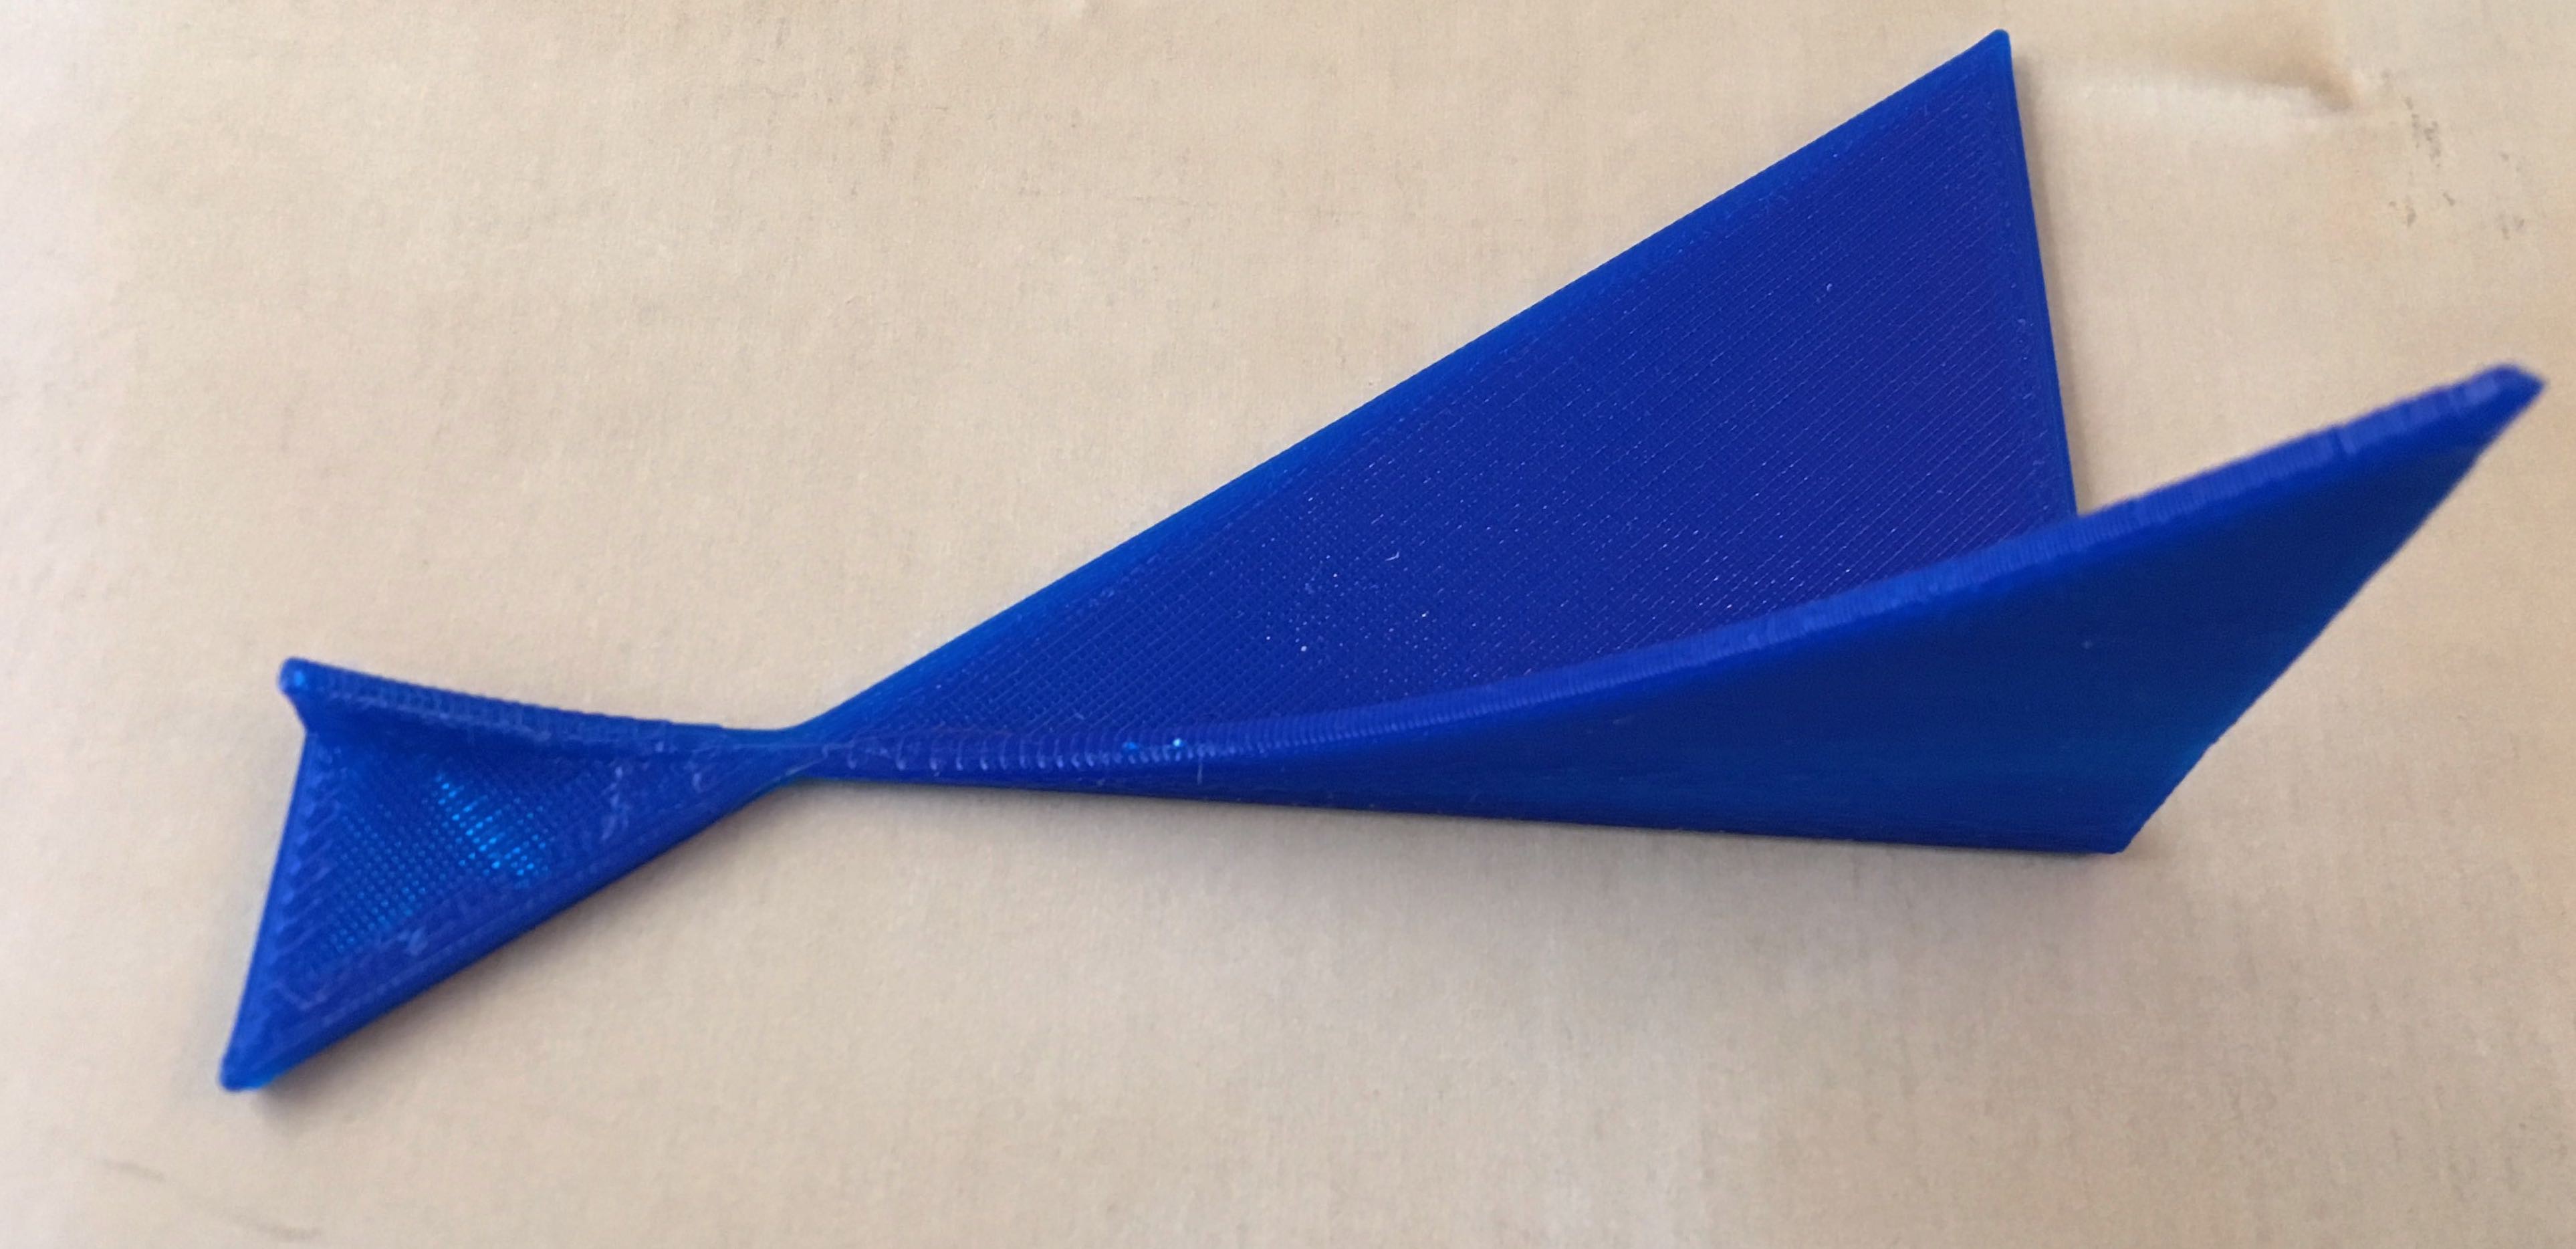
We can look up in tables of integrals and derivatives (we will walk through some common examples in a later log) that the integral of a straight line is a parabola. Or to put it another way, the area under a straight line builds up in a way that turns out to be a parabola. The picture above shows this.
Or, the slope (derivative) of a parabola is a straight line - the slope is negative when the parabola is headed downward to its minimum, and is positive when it is headed up.
Thus, the 3D model above shows a curve and its integral, or a curve and its derivative, depending on which way you want to think about it. This curve could be printed flat, more or less like it is lying on the table here.
Here is an animation (also done in OpenSCAD) of the integral of the area under the line building up as a parabola.

Next, here is a sinusoidal case to think about. Sines and cosines are special in that their derivatives and integrals are other sinusoids, with some fussing around with the signs.
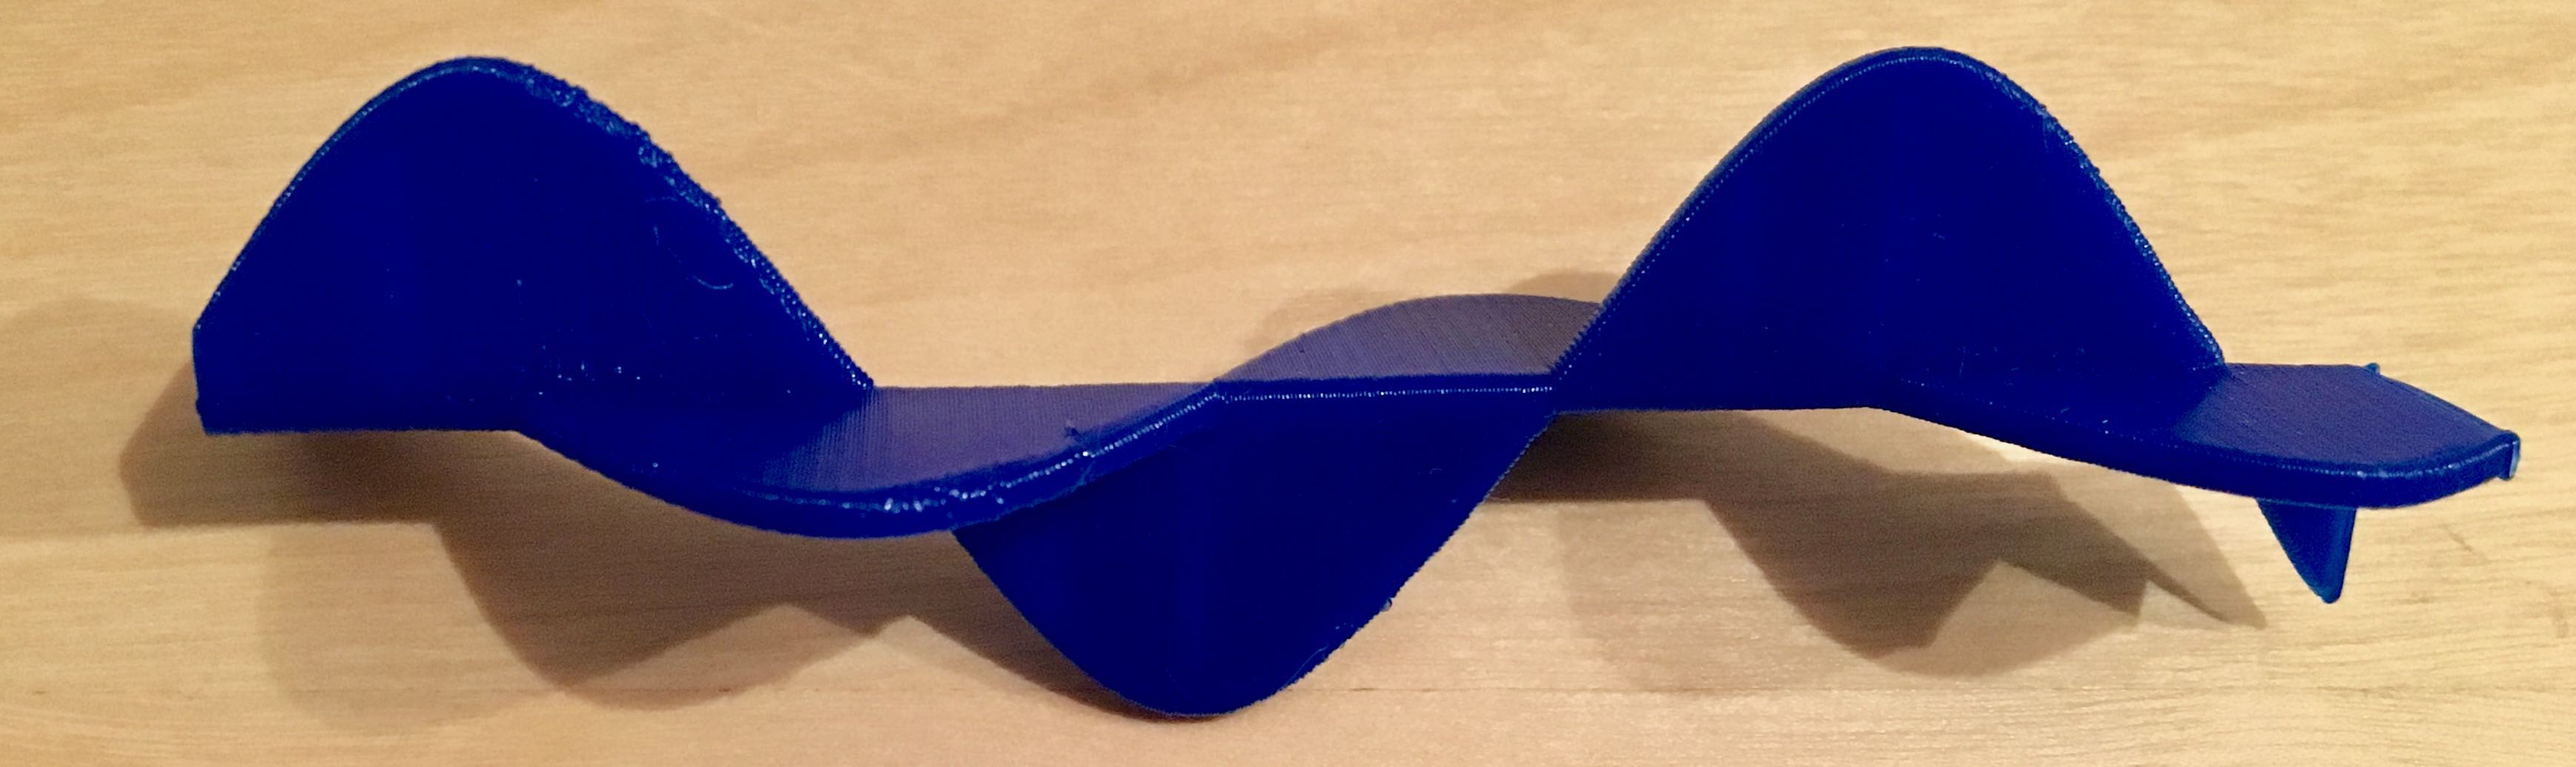
If we think of the vertical curve as the original curve (say, a sine wave starting at 45 degrees) then the slope is the cosine wave shown in the horizontal curve.
If we think of the horizontal (cosine) curve as the original curve, the vertical curve is its integral (sine). With sines and cosines, the signs flip with the integral so we have to be careful about orientation. Here's the animation:
We printed the sine and cosine waves here with the same amplitude, but if we were plotting sin(a*x), the derivative would be a*cos(ax), and the integral would be (-1/a) * cos (ax). To make it printable, we ignored this scaling (or you can think of it that we plotted the derivative and integrals with respect to a scaled and offset value.) This print was created vertically, with the side of the model on the left side of this picture on the platform. We used a brim to hold it down.
Lastly, we decided to print a special function, the exponential. The function takes the number e (2.71...) and raises it to the power x, which we can write as e^x. Exponentials have the property that their integrals and derivatives are also exponentials, with some scaling factors thrown in for some cases. We decided to print that as four copies of the exponential- if you keep turning it , you can keep integrating or taking the derivative. It just repeats! (x =0 is at the top of the picture.)

All these prints were created with a small OpenSCAD model which takes two functions and plots them at right angles to each other (with a bit of modification for the last model.) We will post this after we do a little cleanup.
We have included two STLs for the fundamental theorem in "Files"- one for the sinusoids here (print vertically with a raft or brim for best results) and another for the squared/cubed pair (photo in log #7) , probably best printed by rotating it for max surface area contact with the platform.)
Discussions
Become a Hackaday.io Member
Create an account to leave a comment. Already have an account? Log In.