 Marek
MarekThe stages of the project:
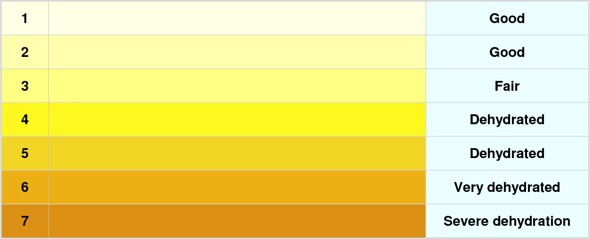
* Prepare detailed urine body hydration chart for Machine Learning. [done]
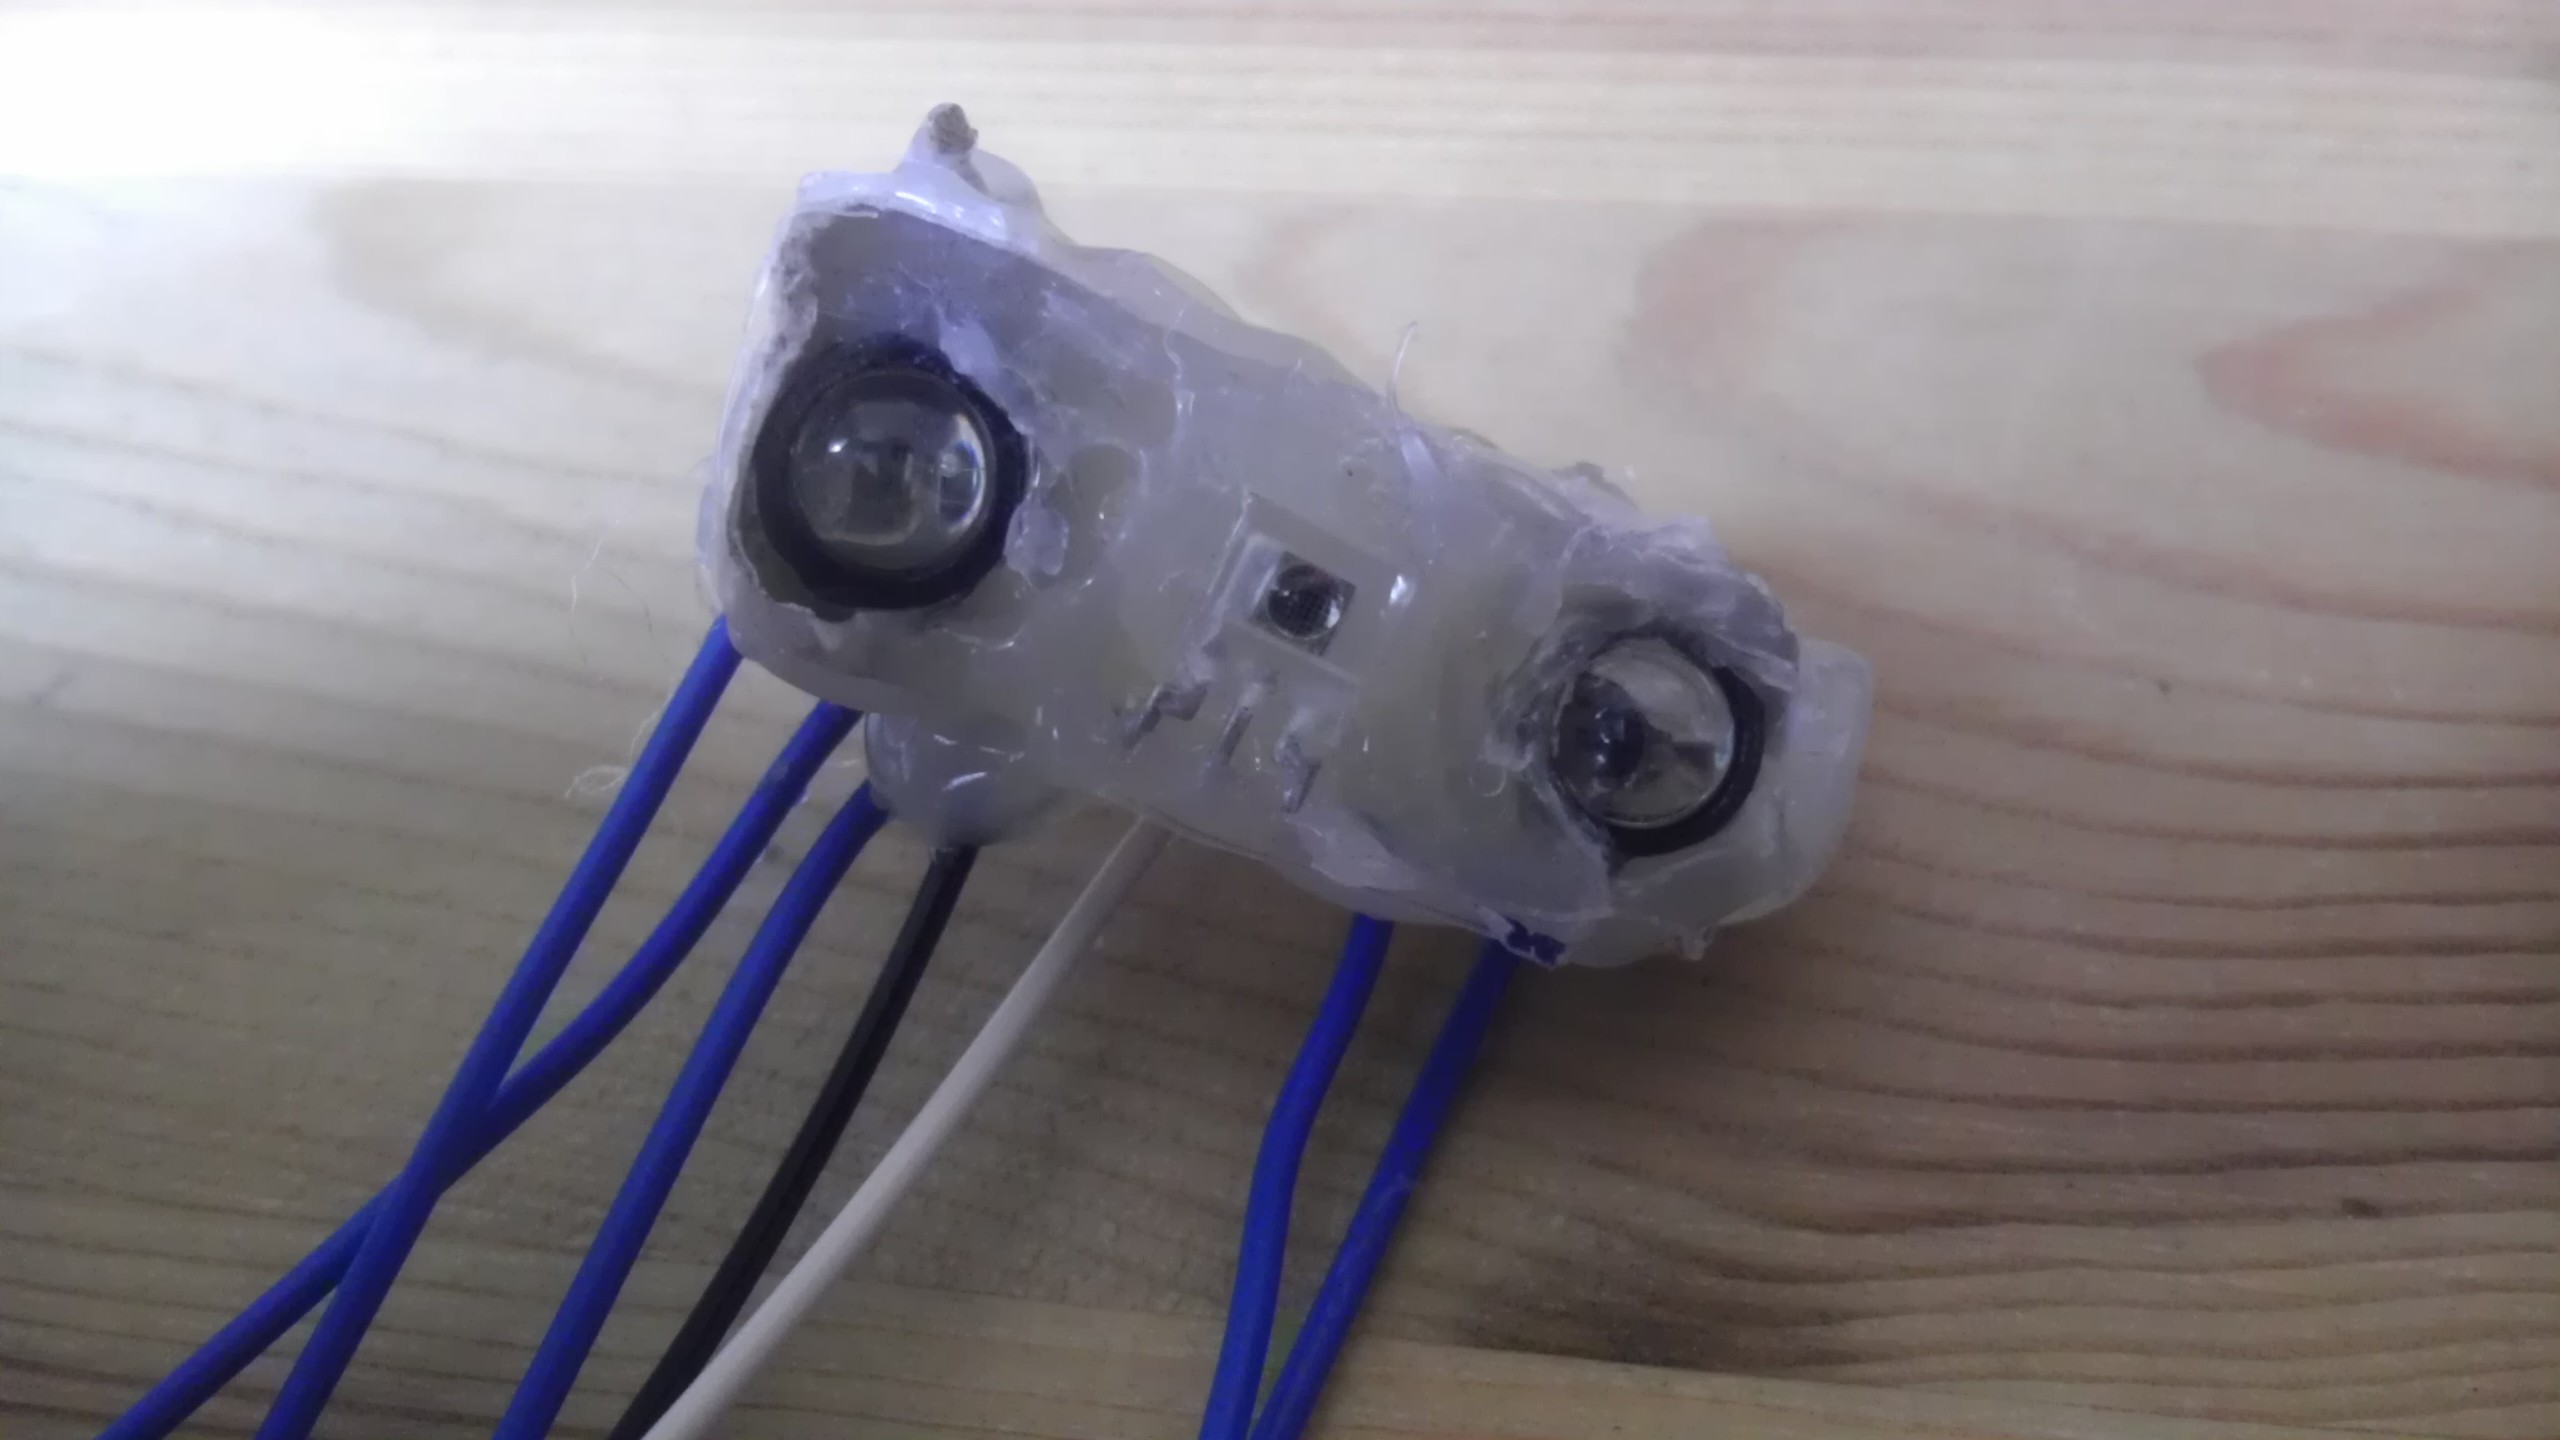
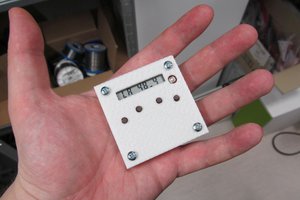
* Build urine colour detection device. [done]
* Perform a machine learning to predict body hydration from urine colour. [done]
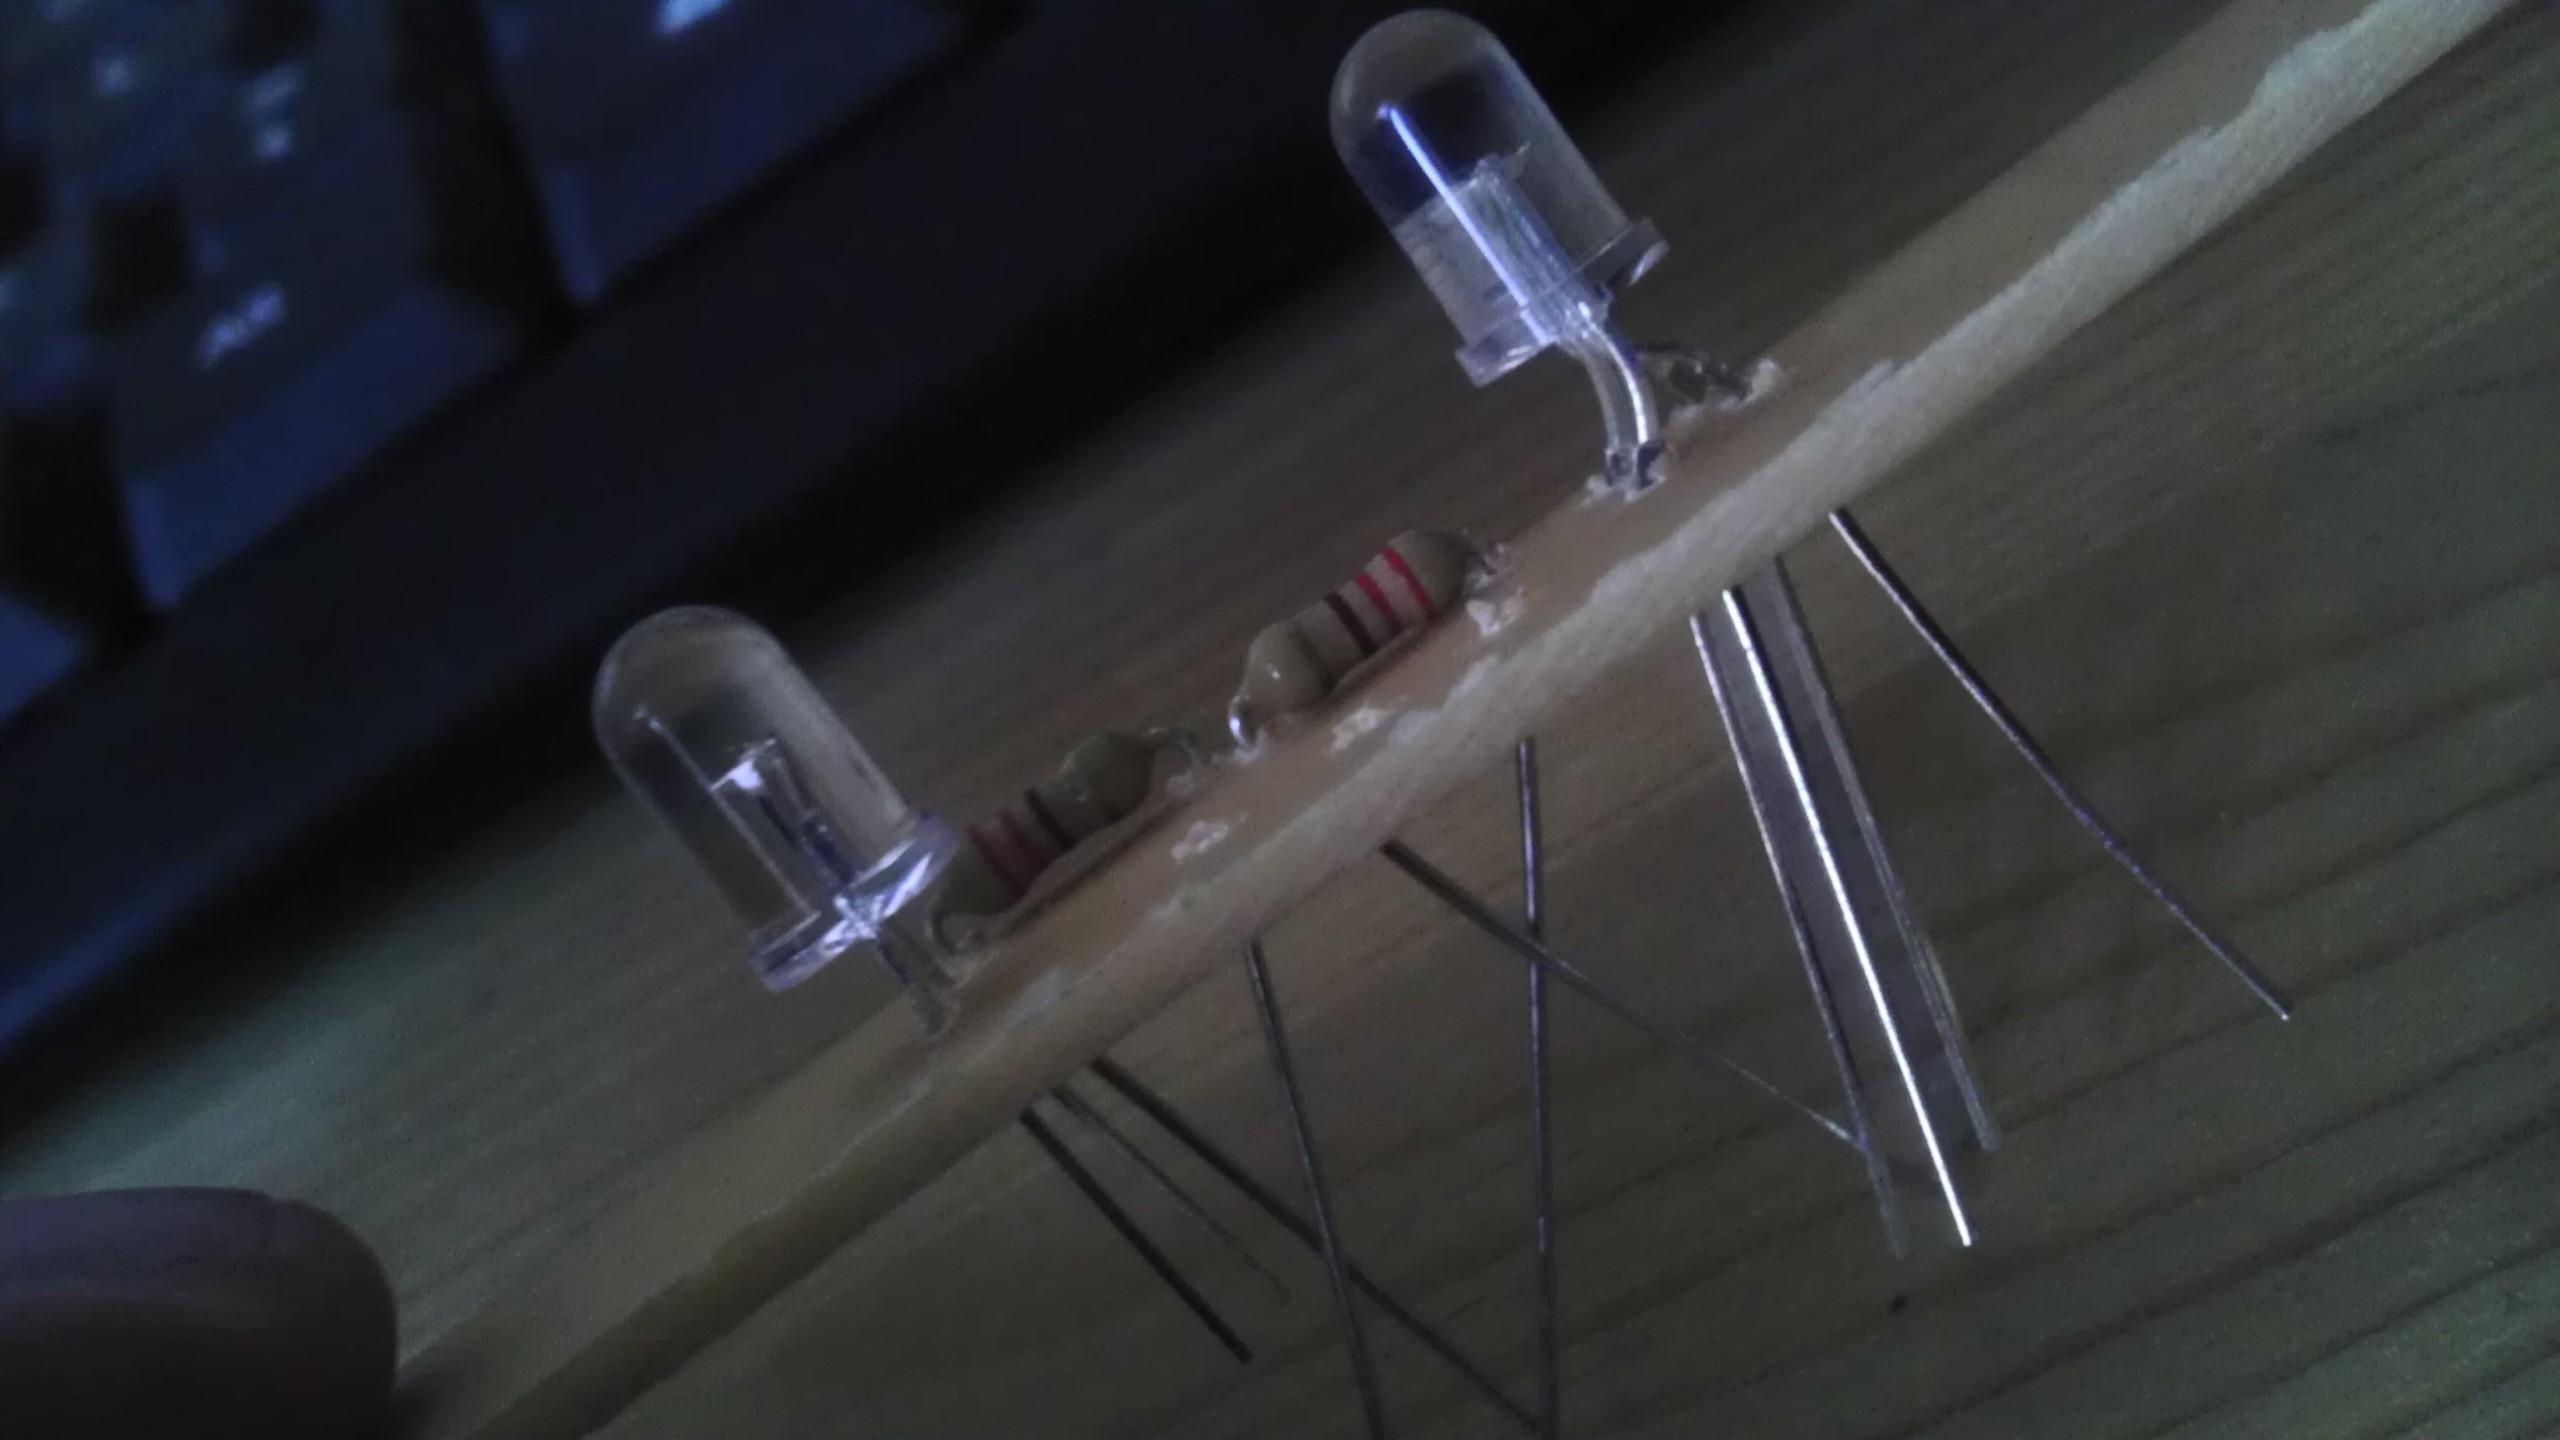
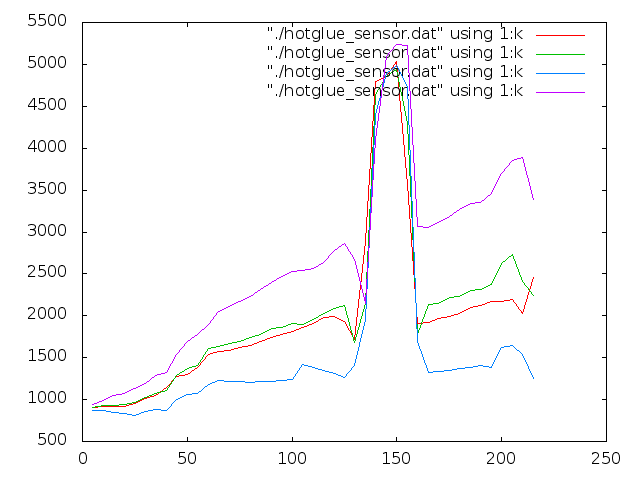
* Perform basic absorption measurements using RGB and Ir LEDs and TSL235R converter. [done]
* Write a Python script that computes average colour from a photo of urine sample. [done]
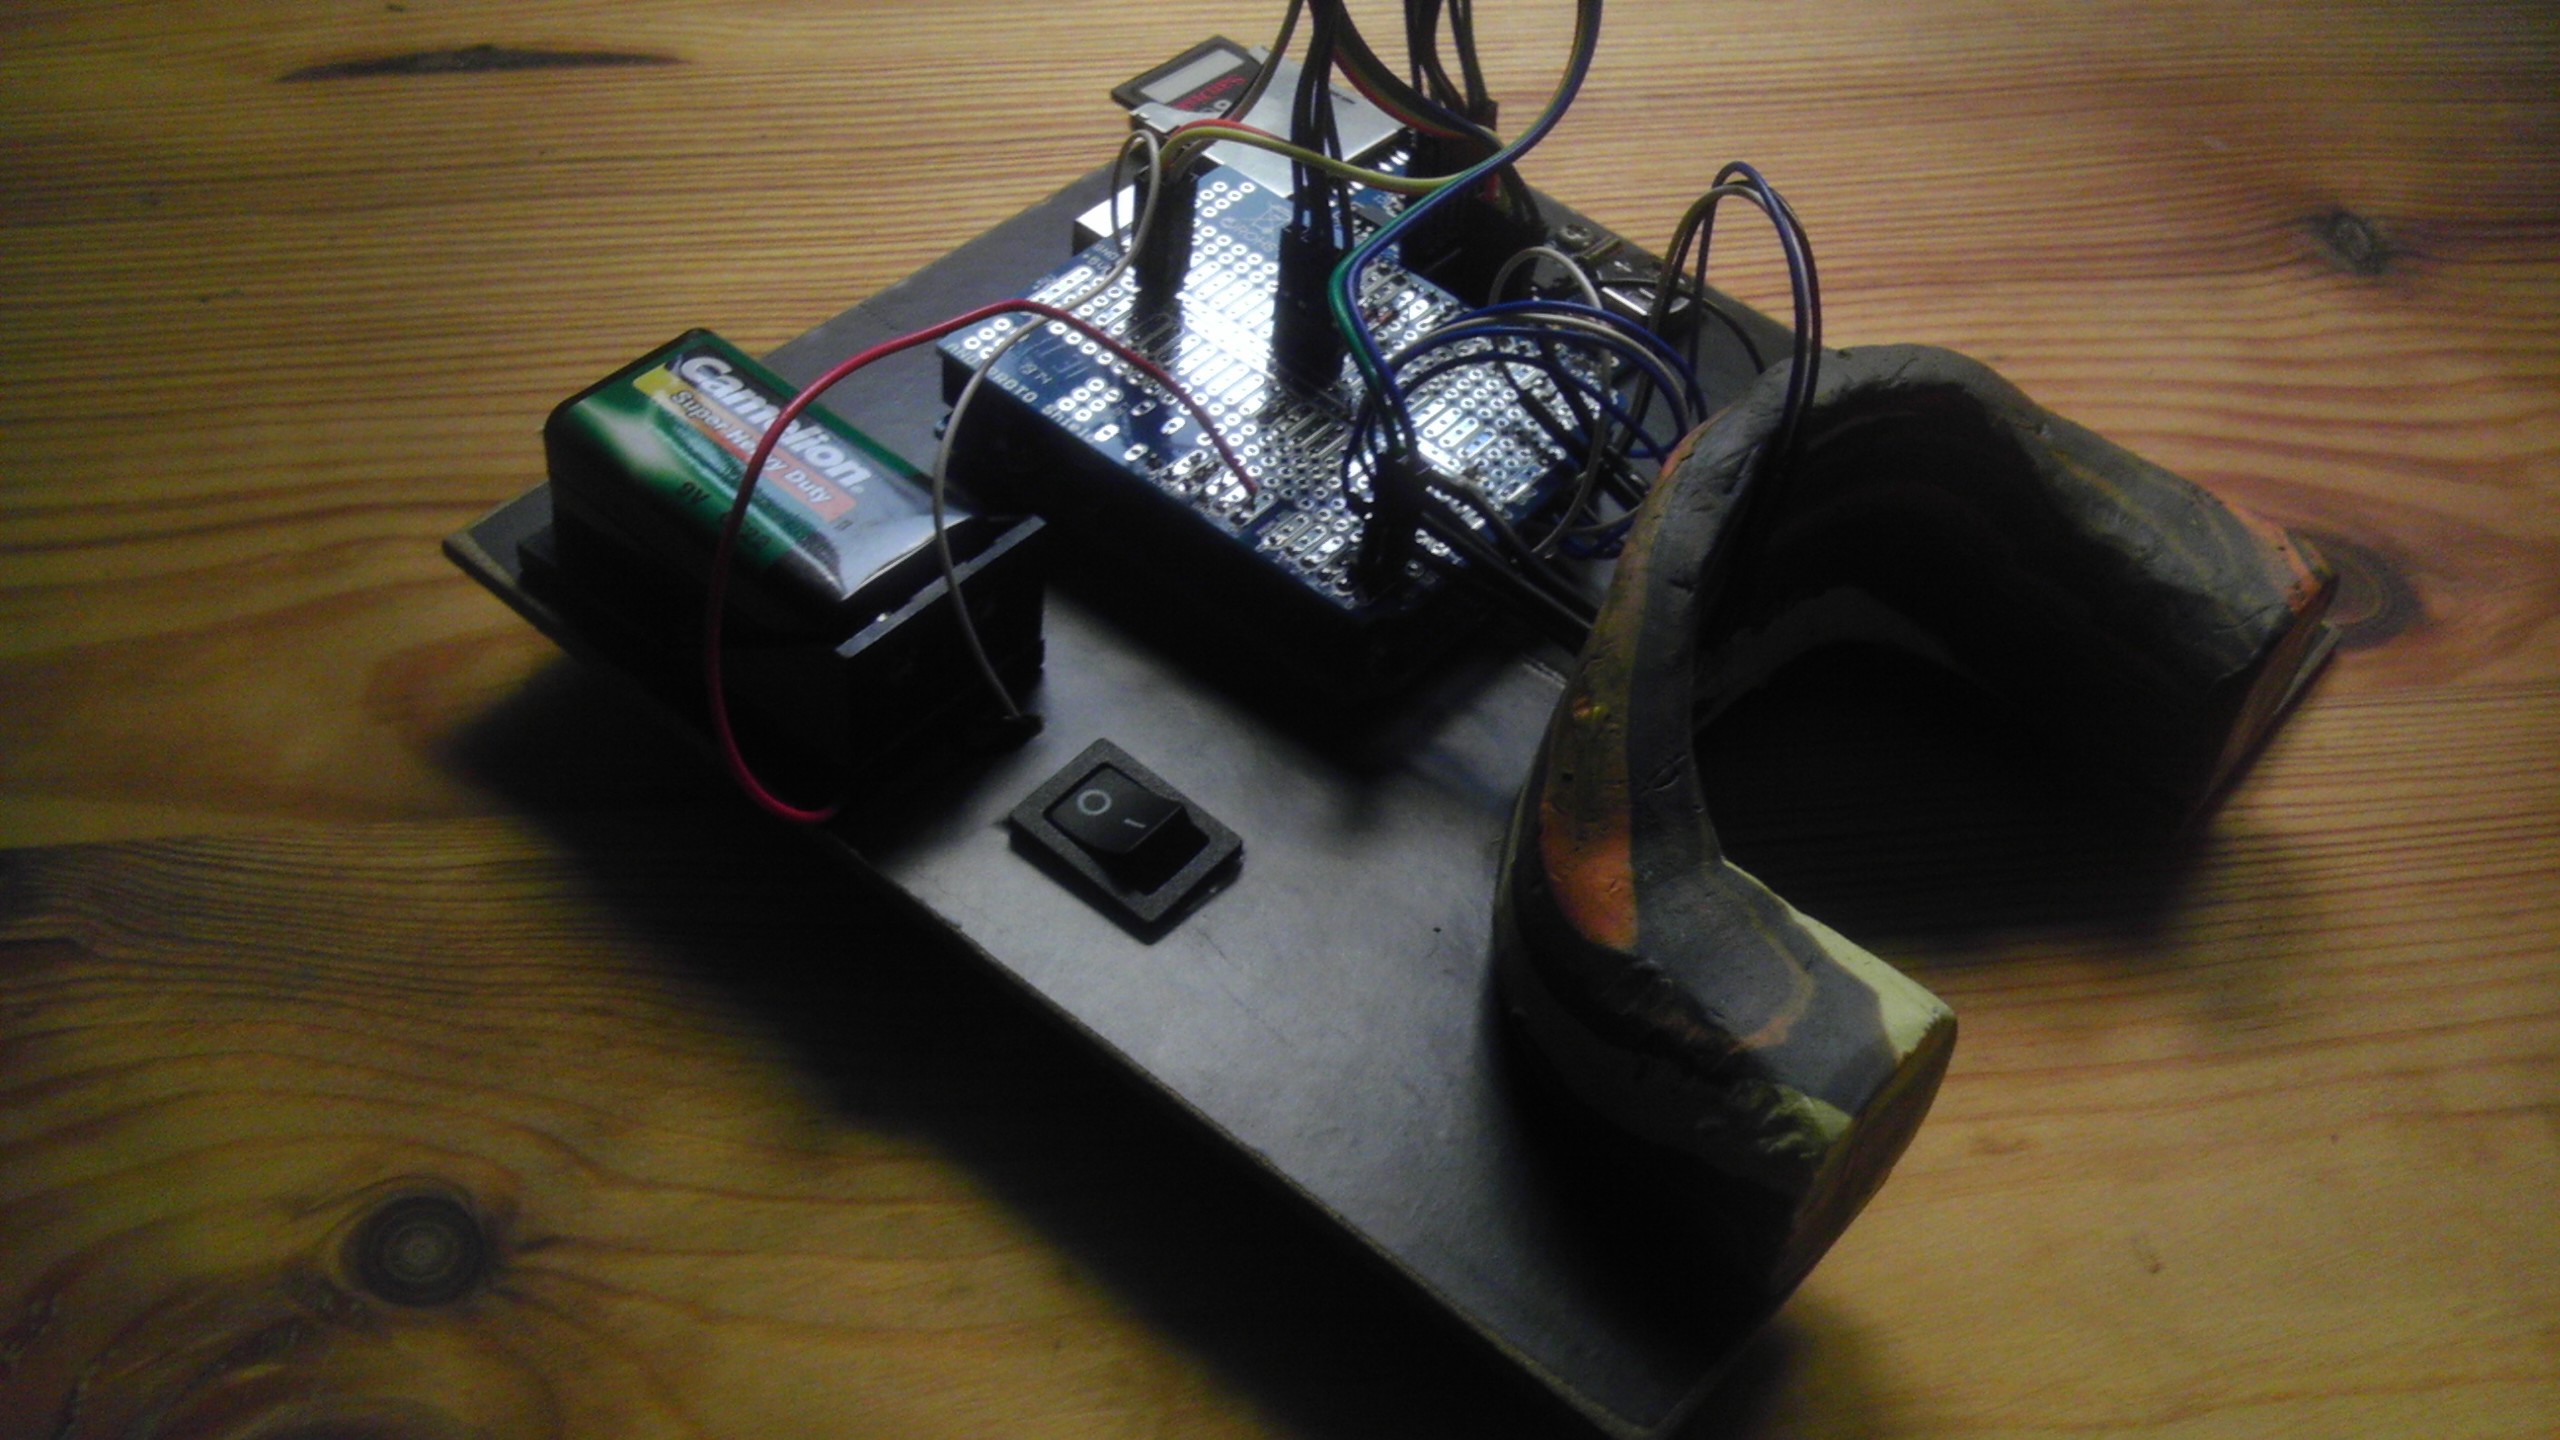
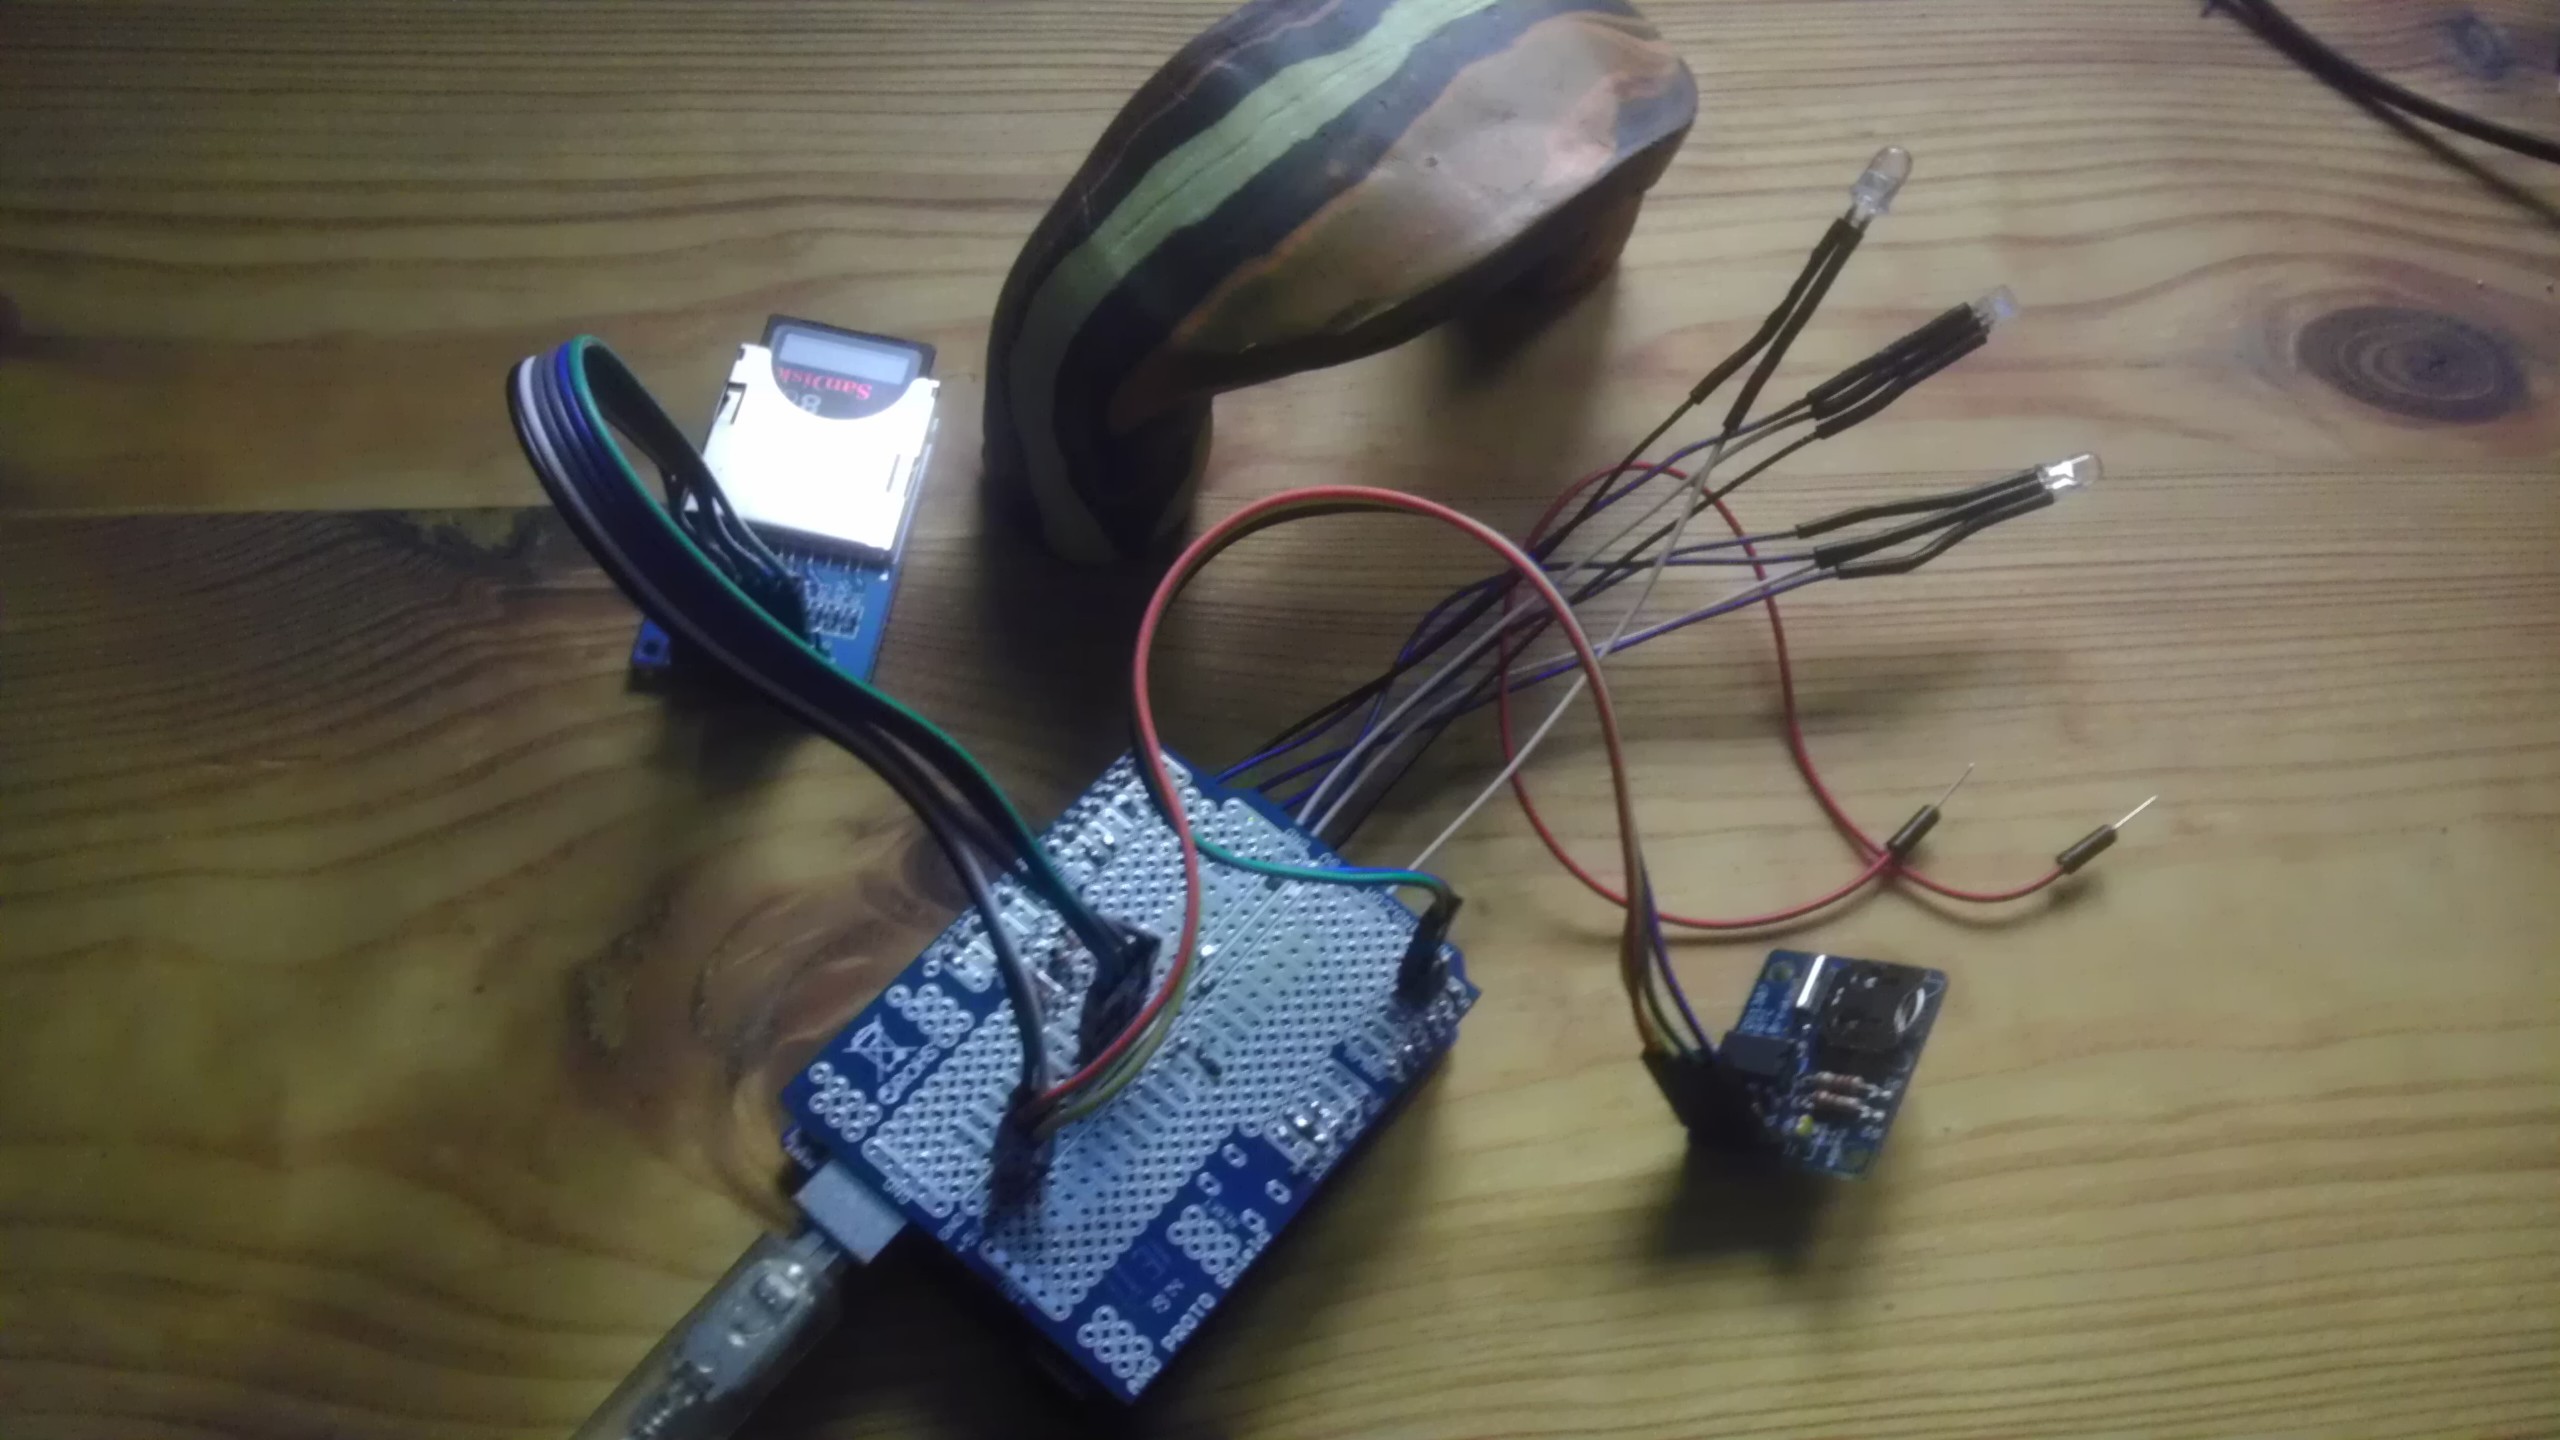
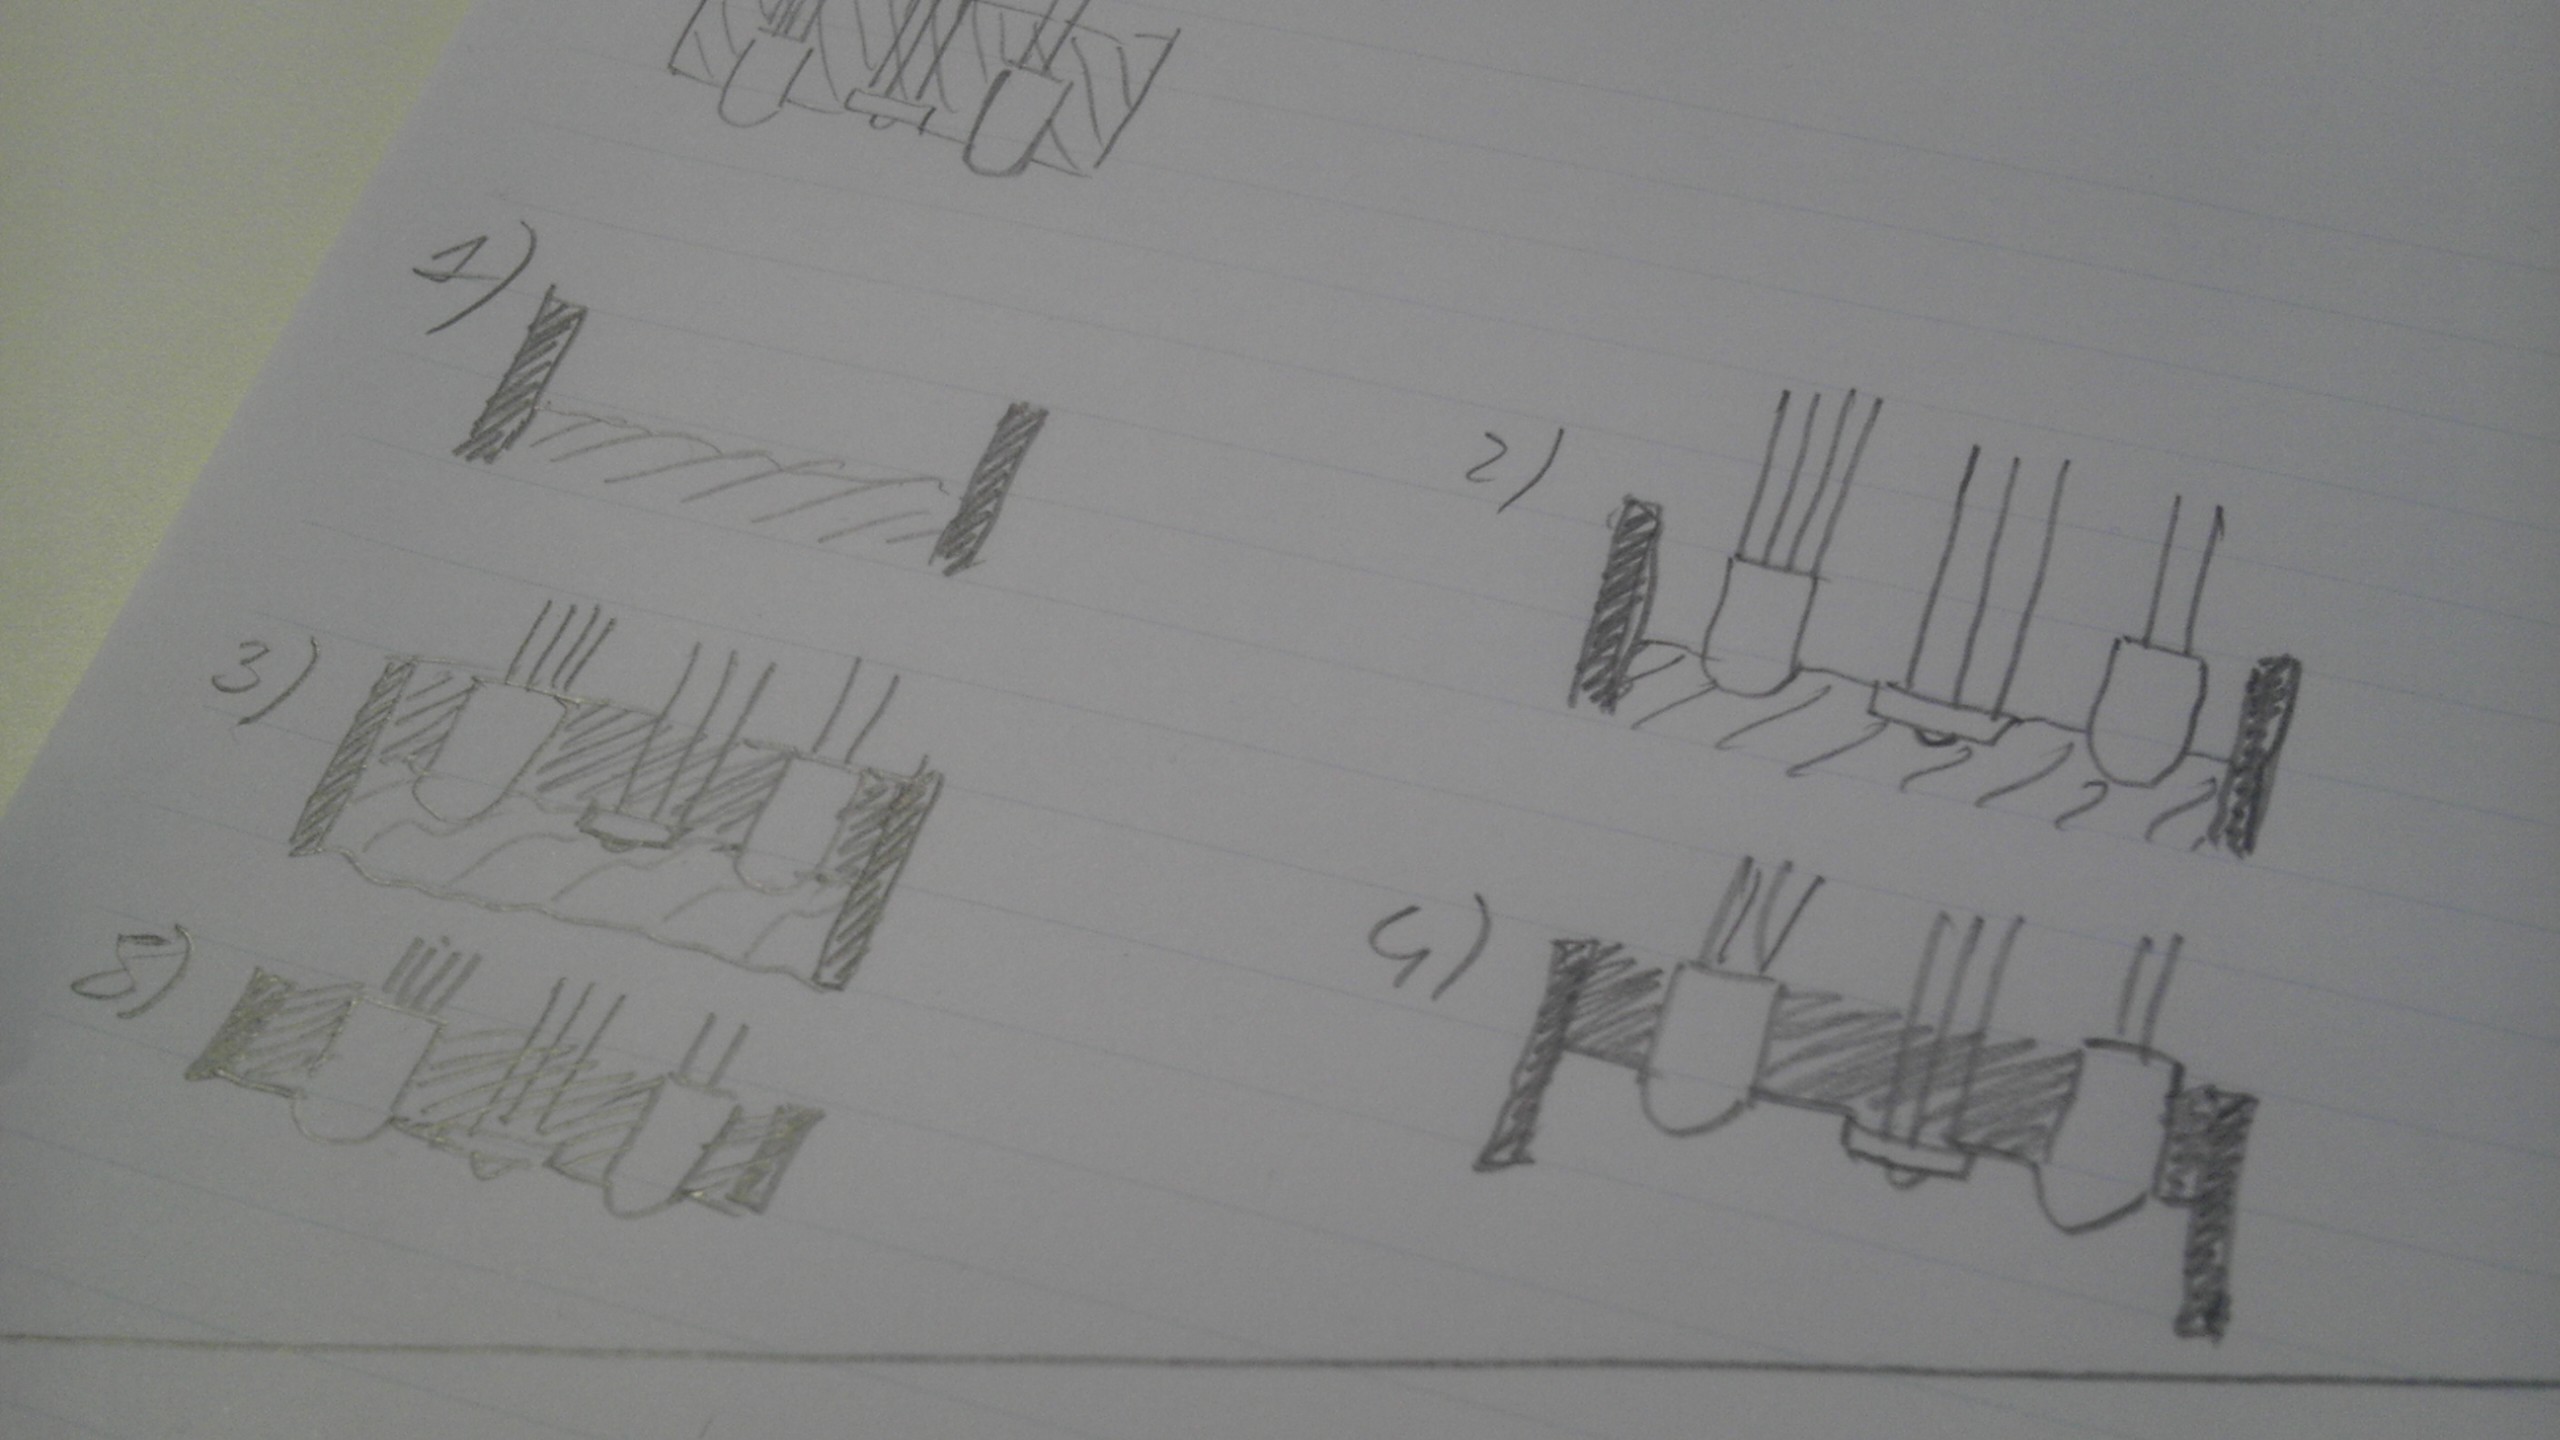
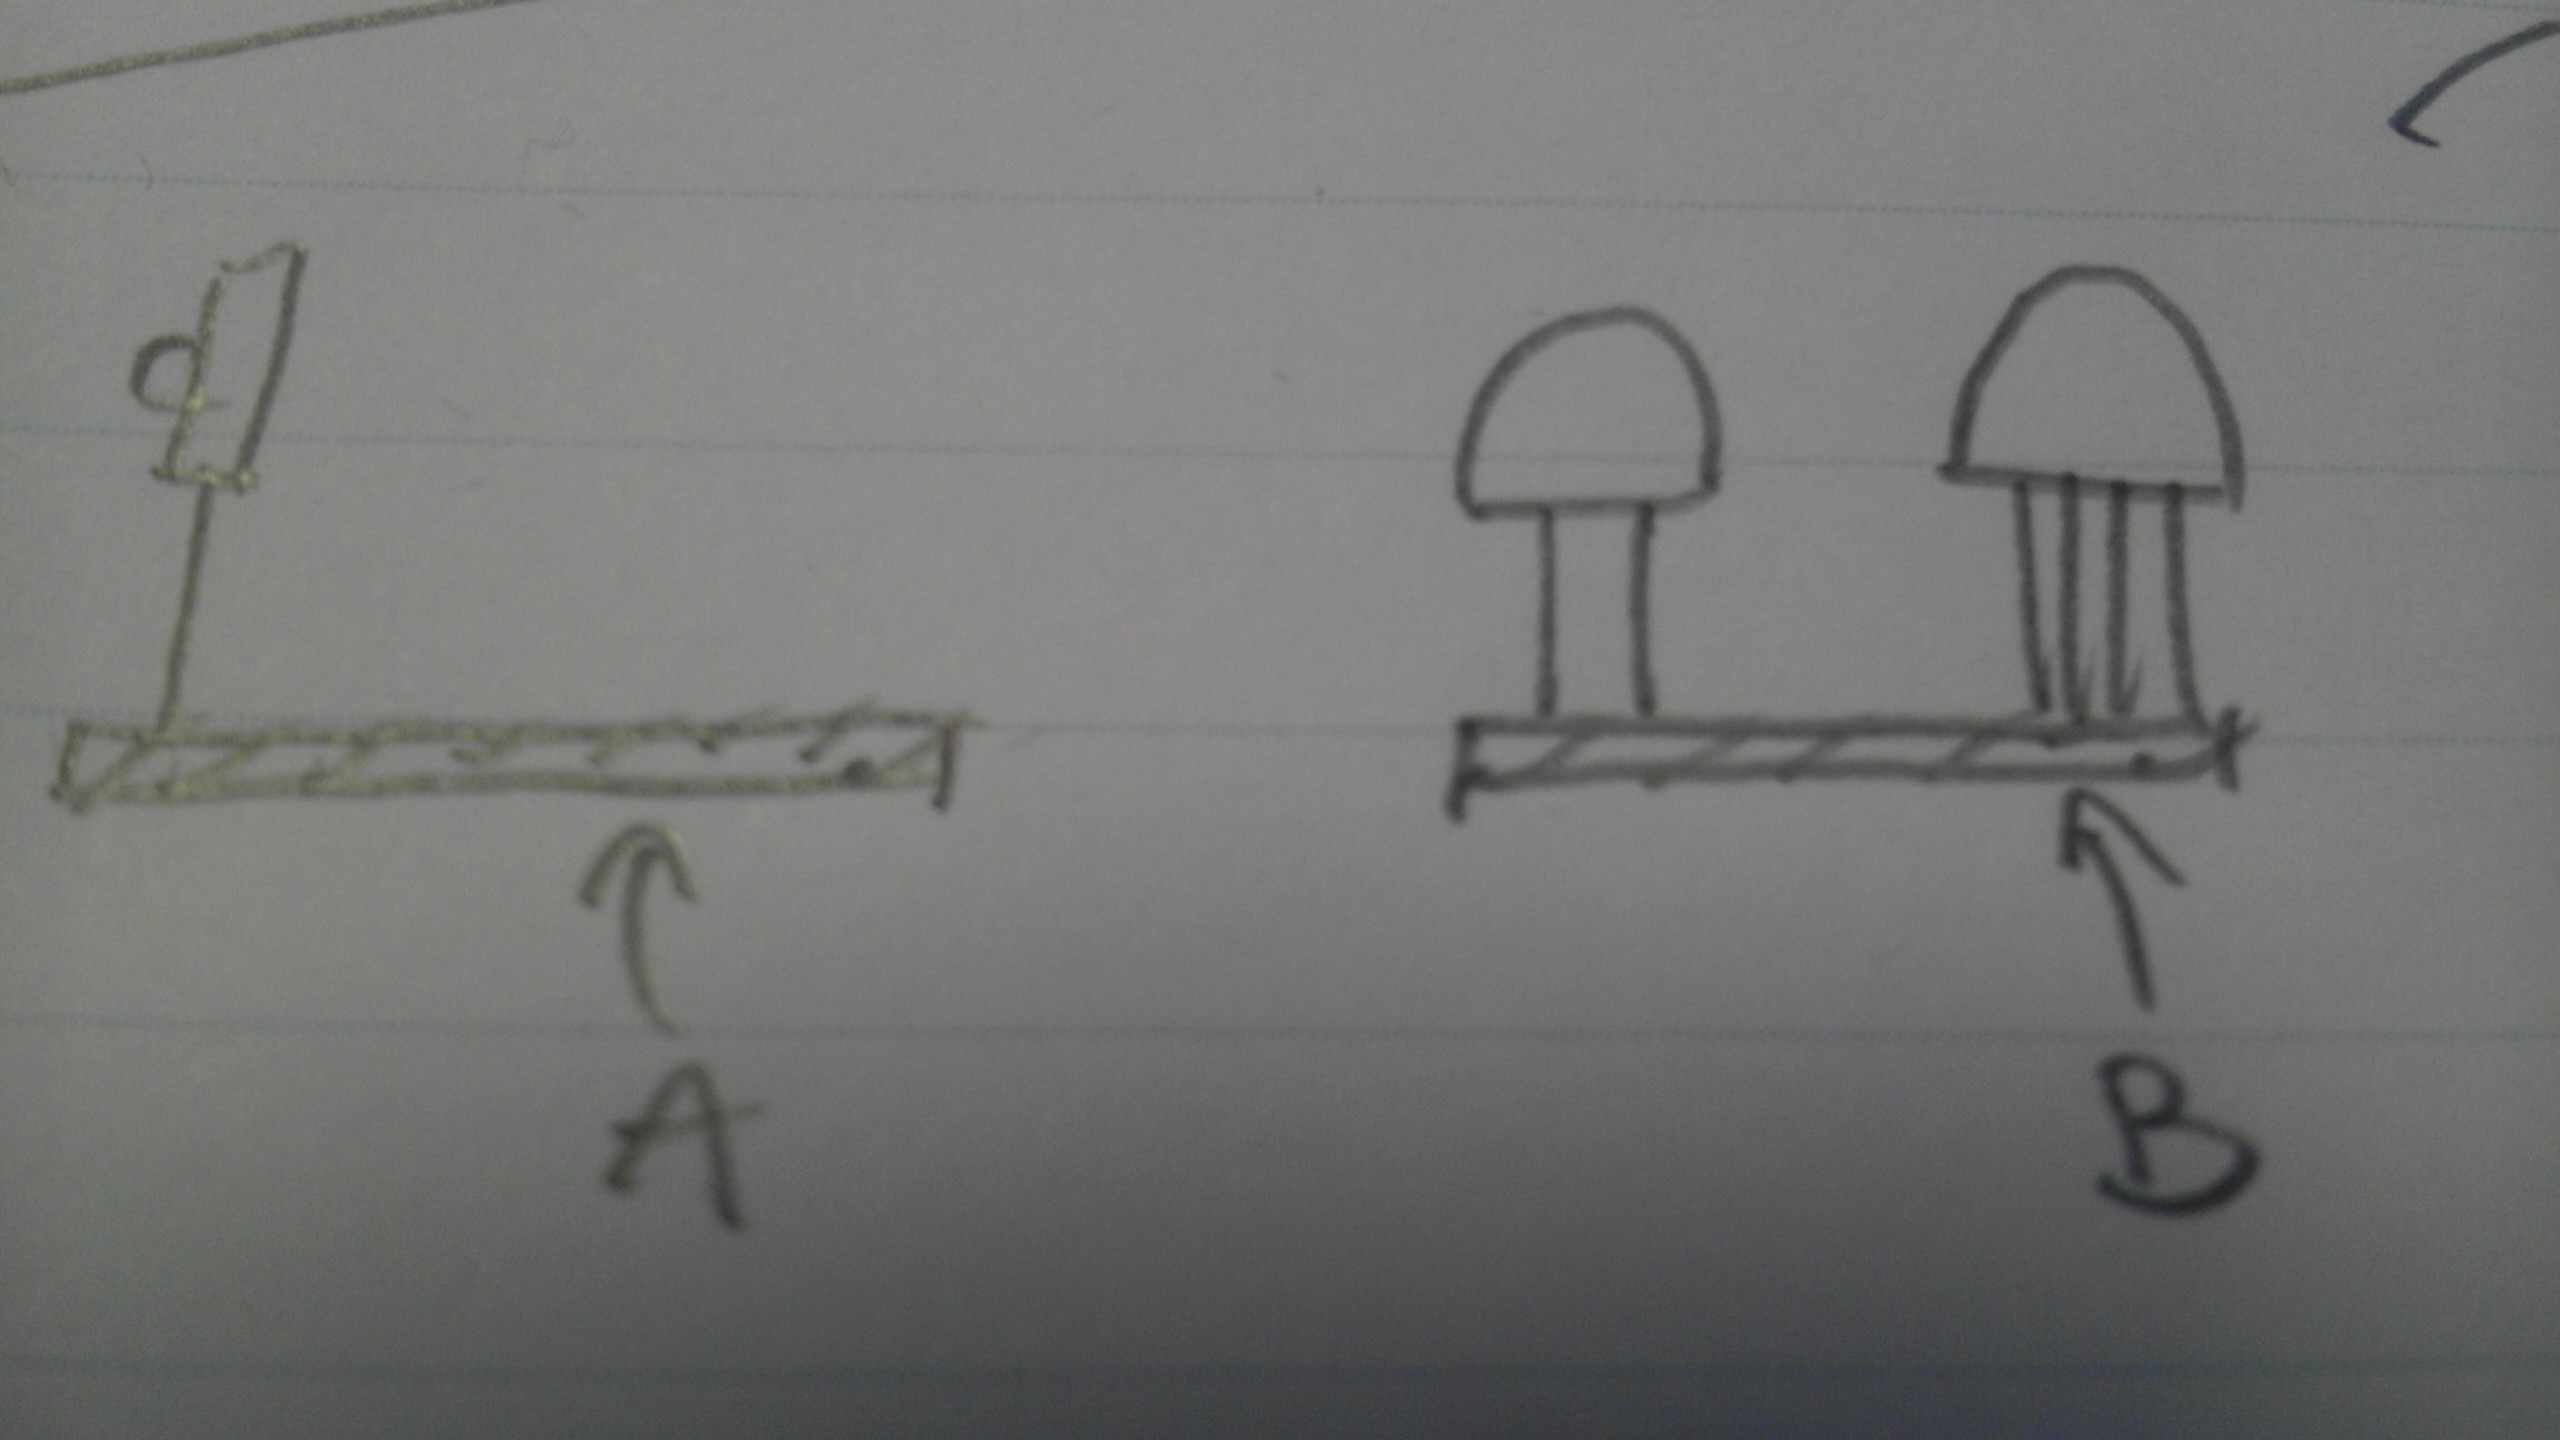
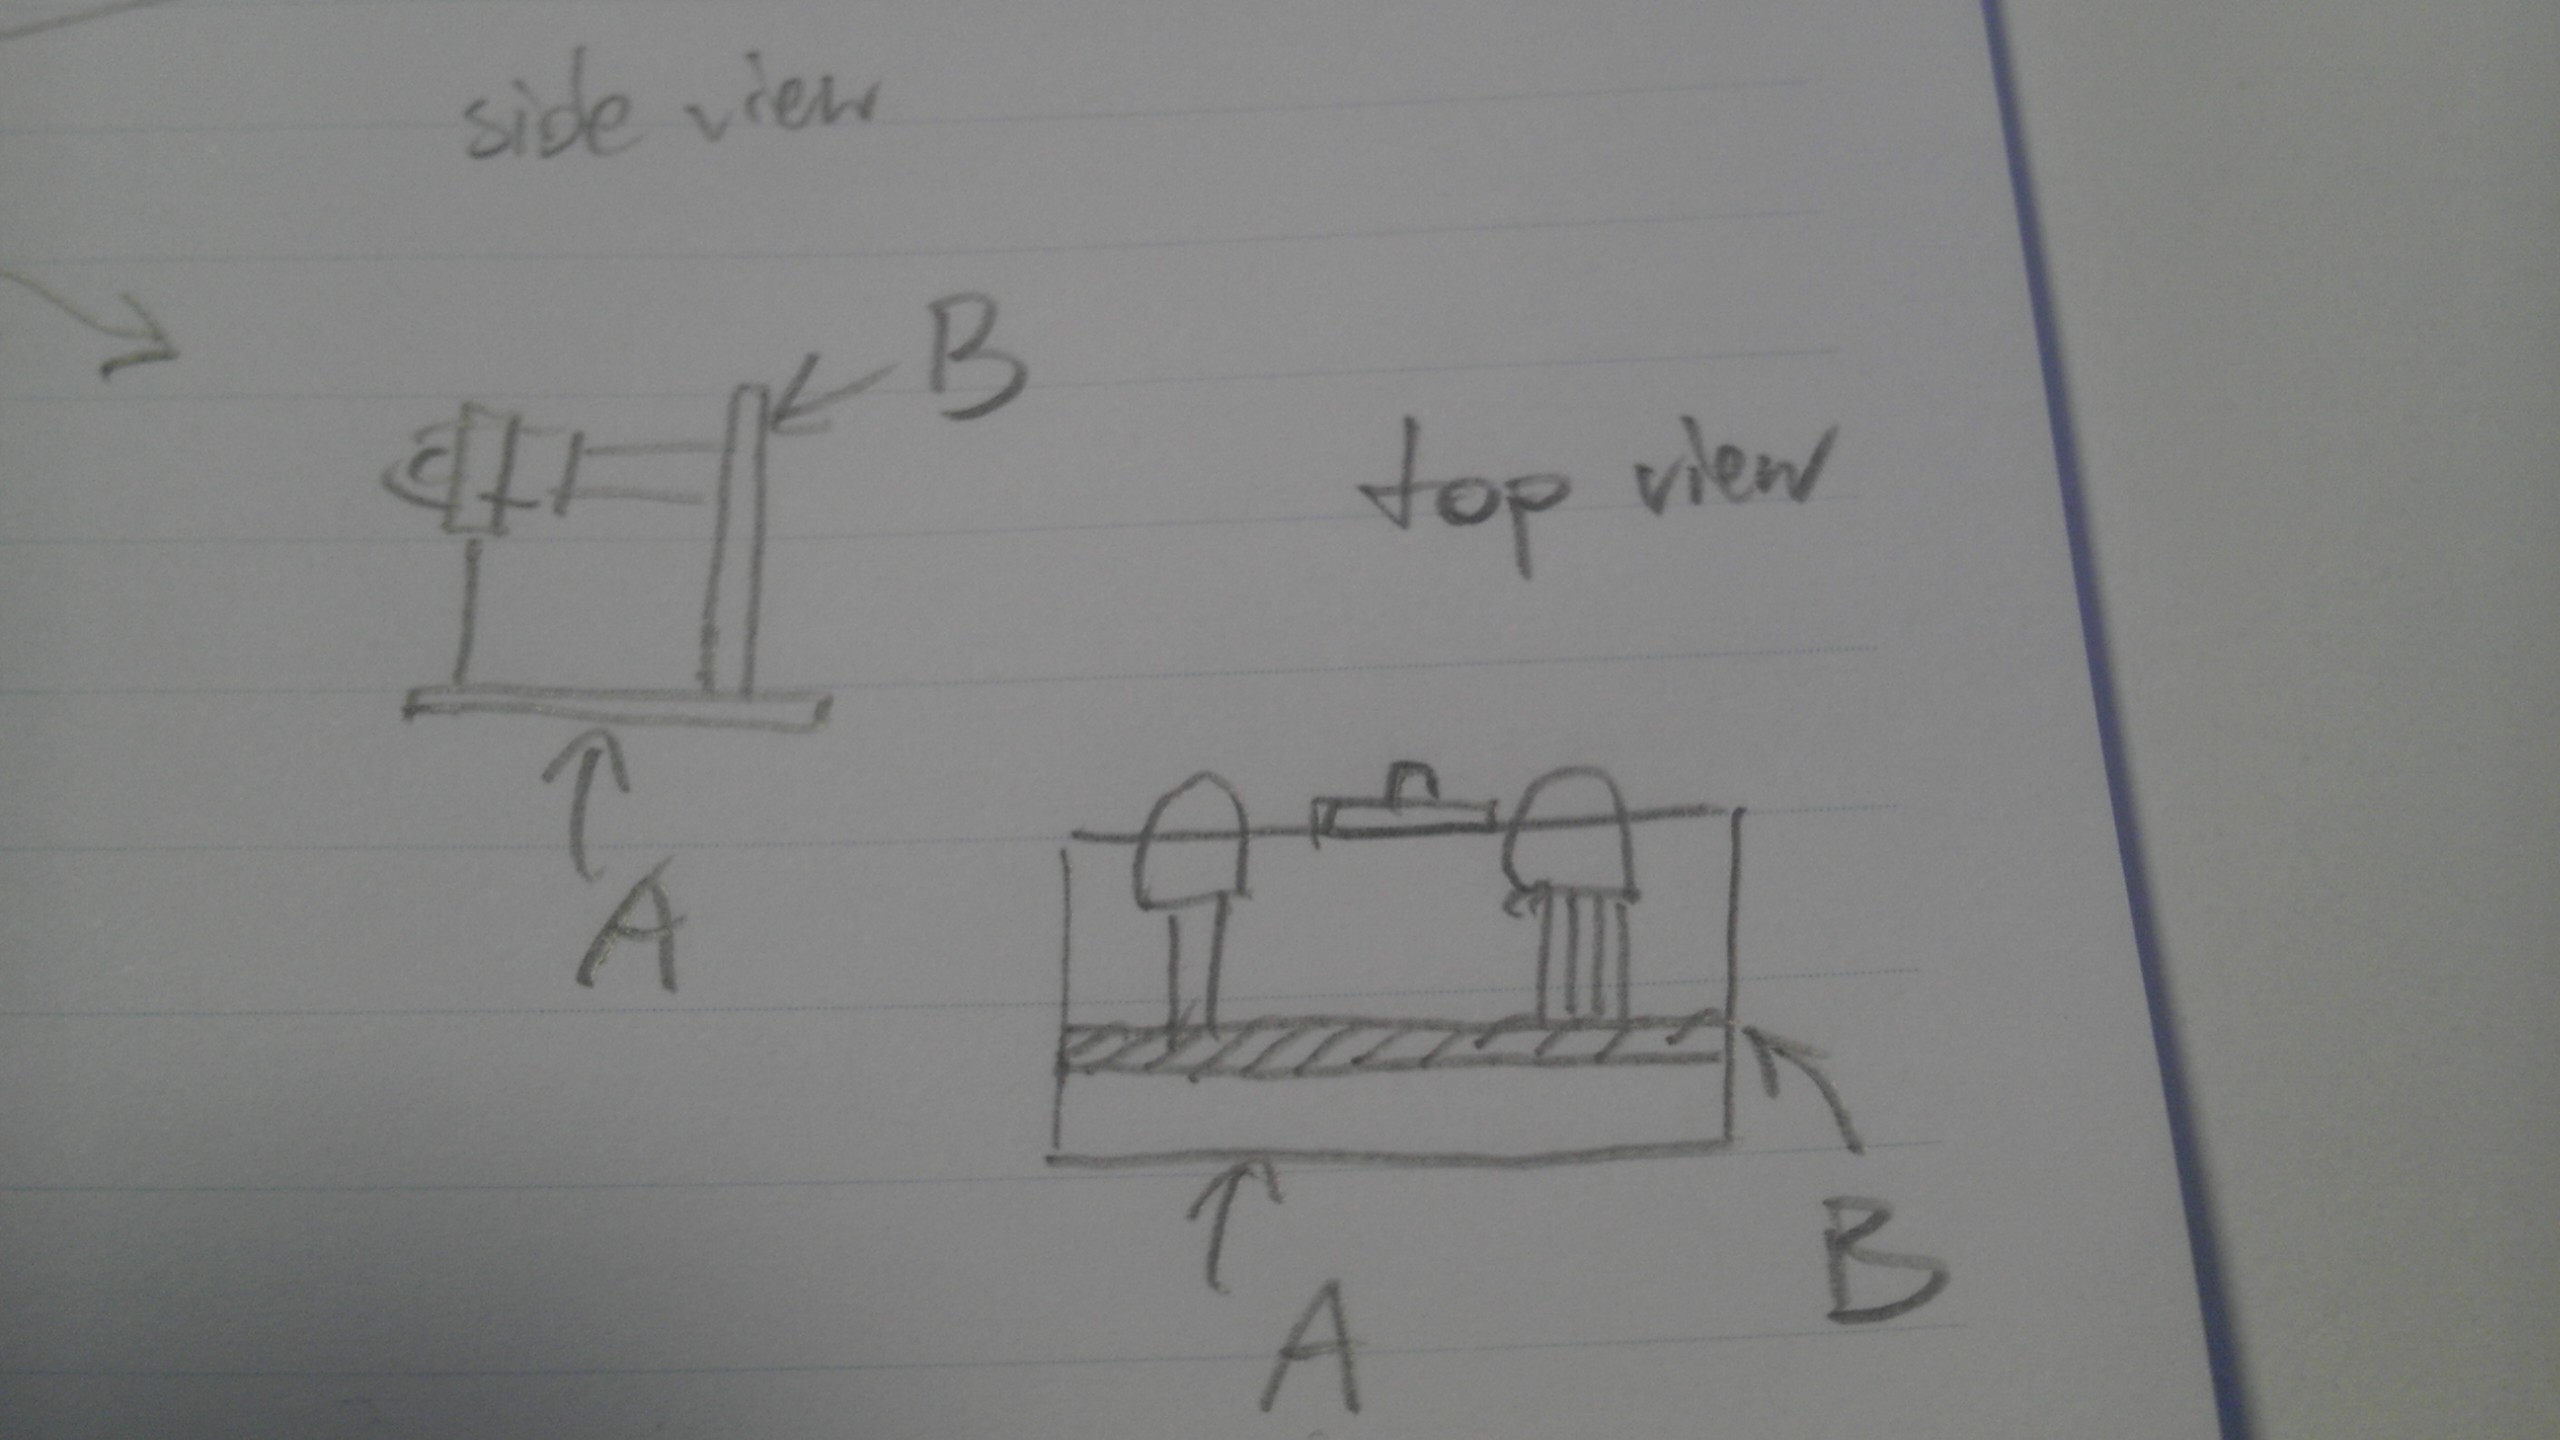
* Building a attachable device that measures single point in 4 dimensional (4 colours) learning space. [in progress]
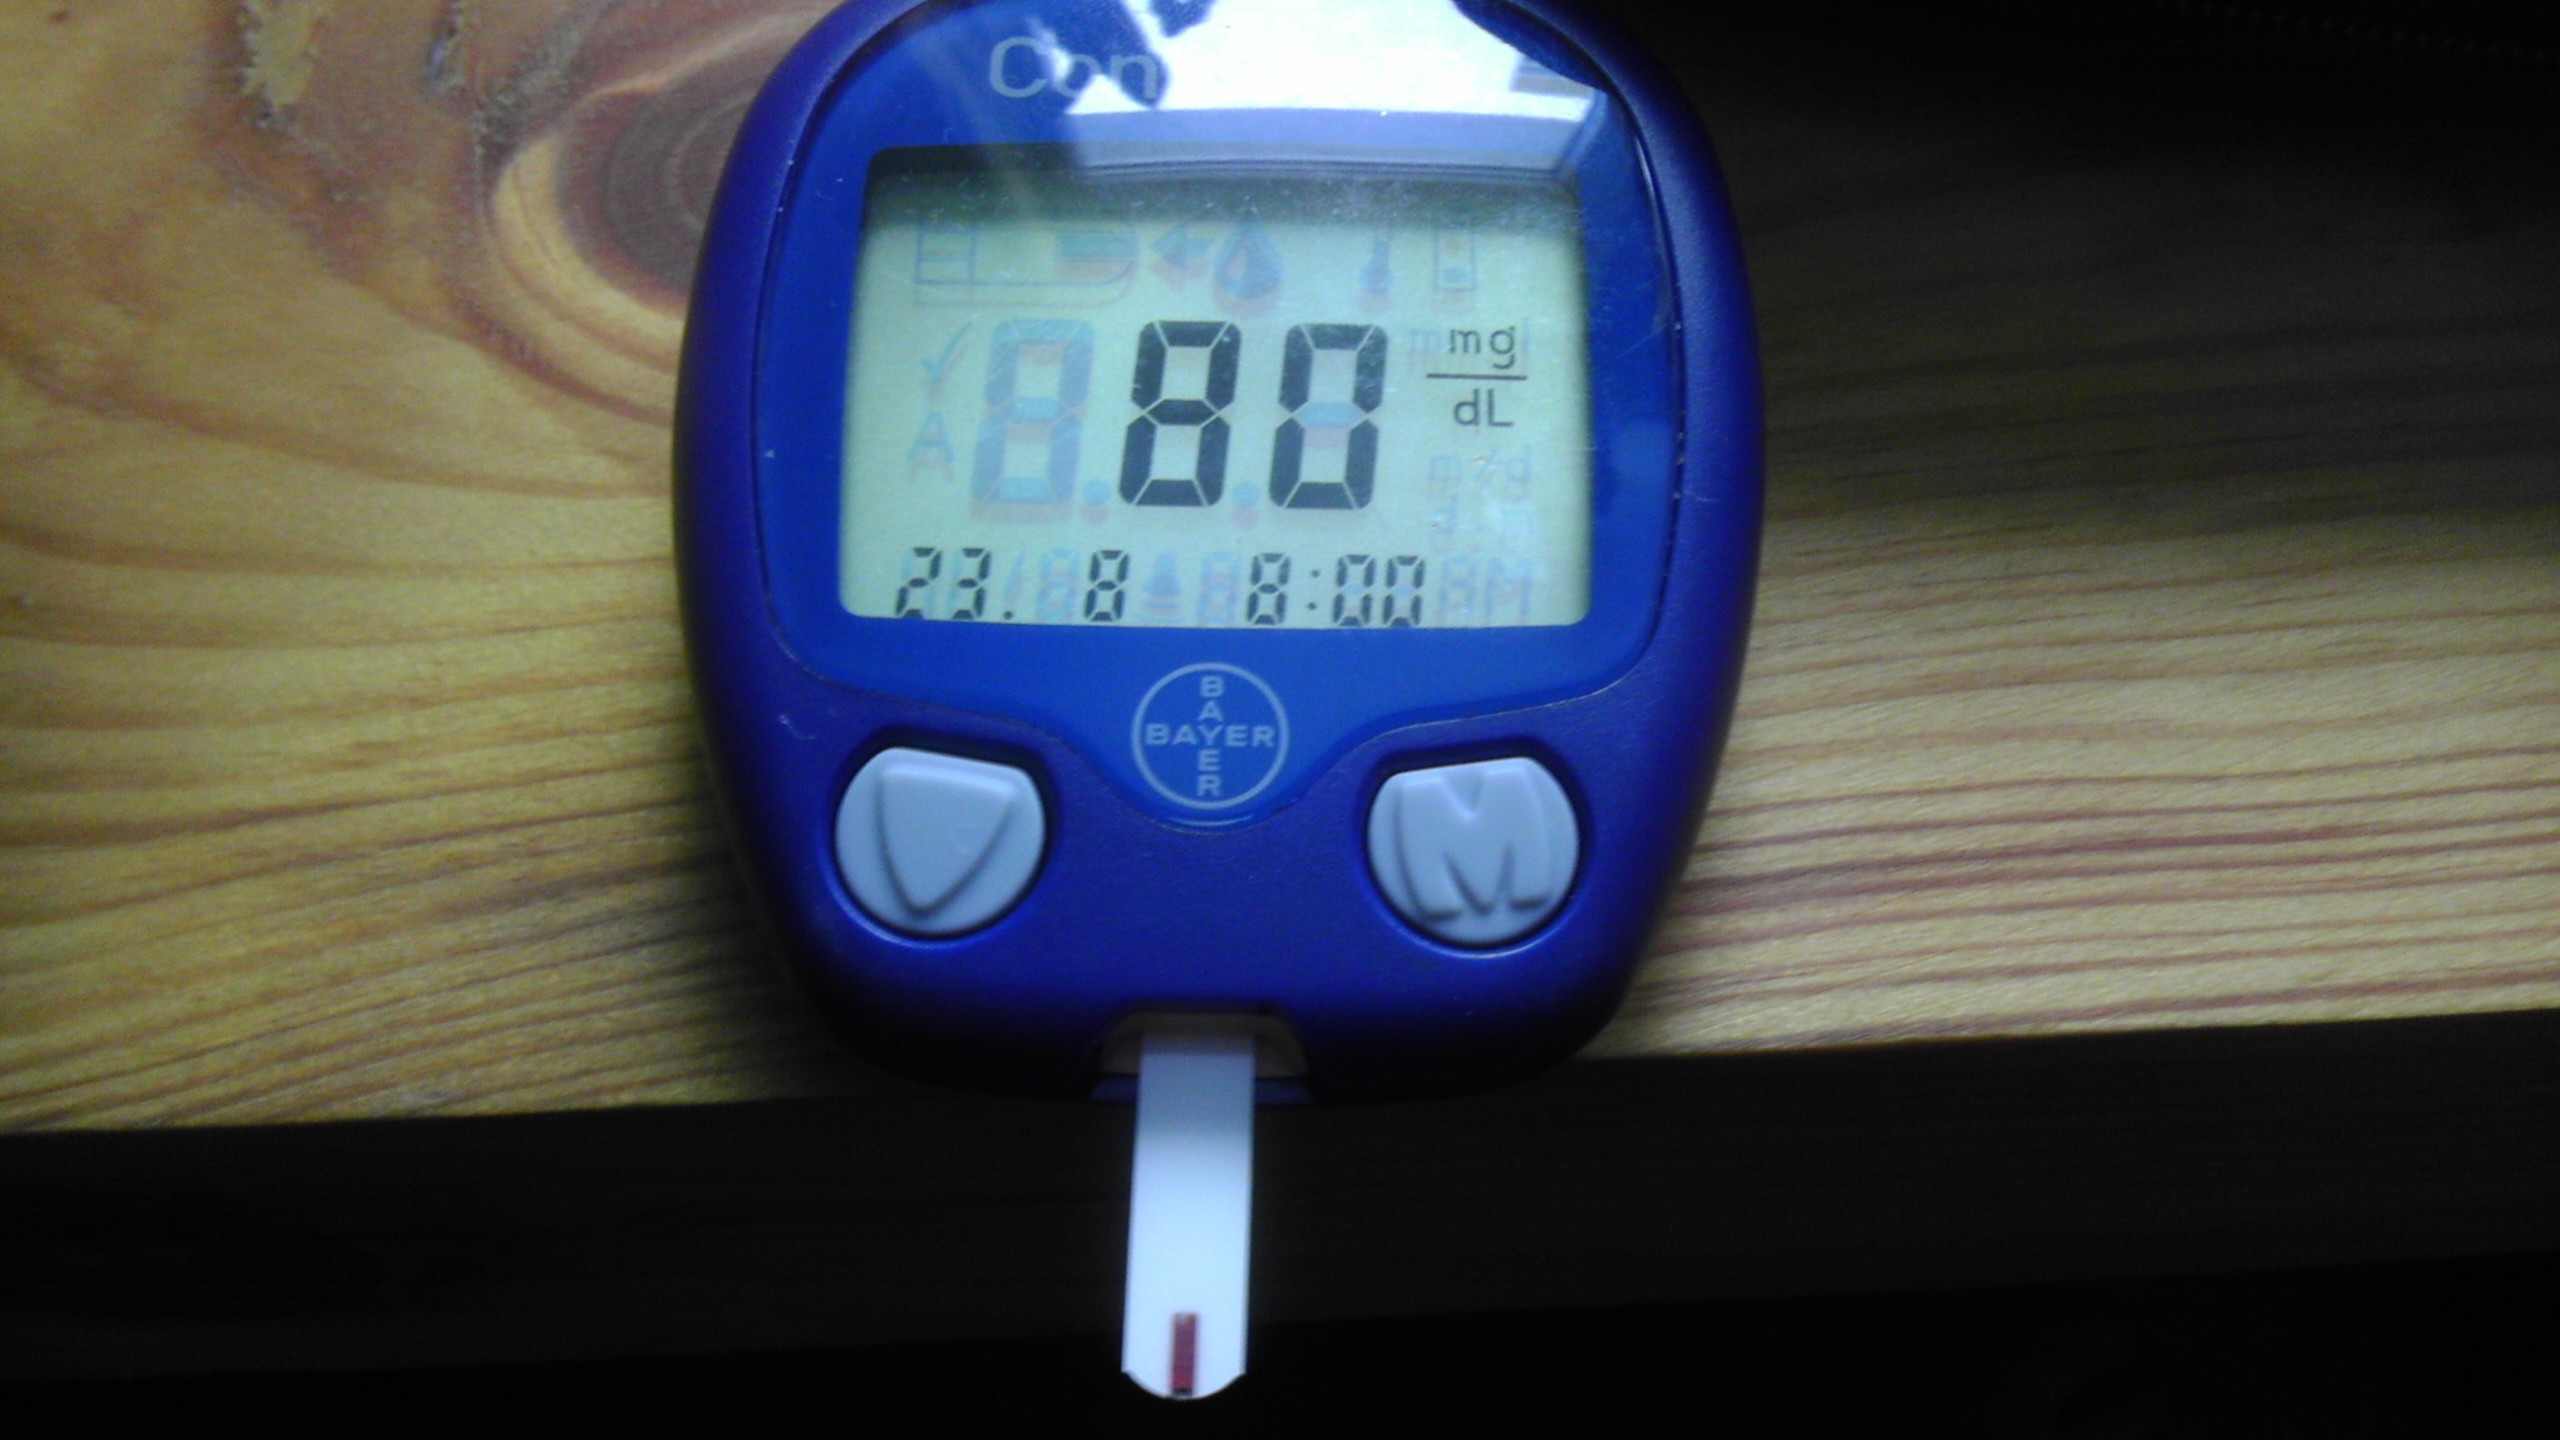
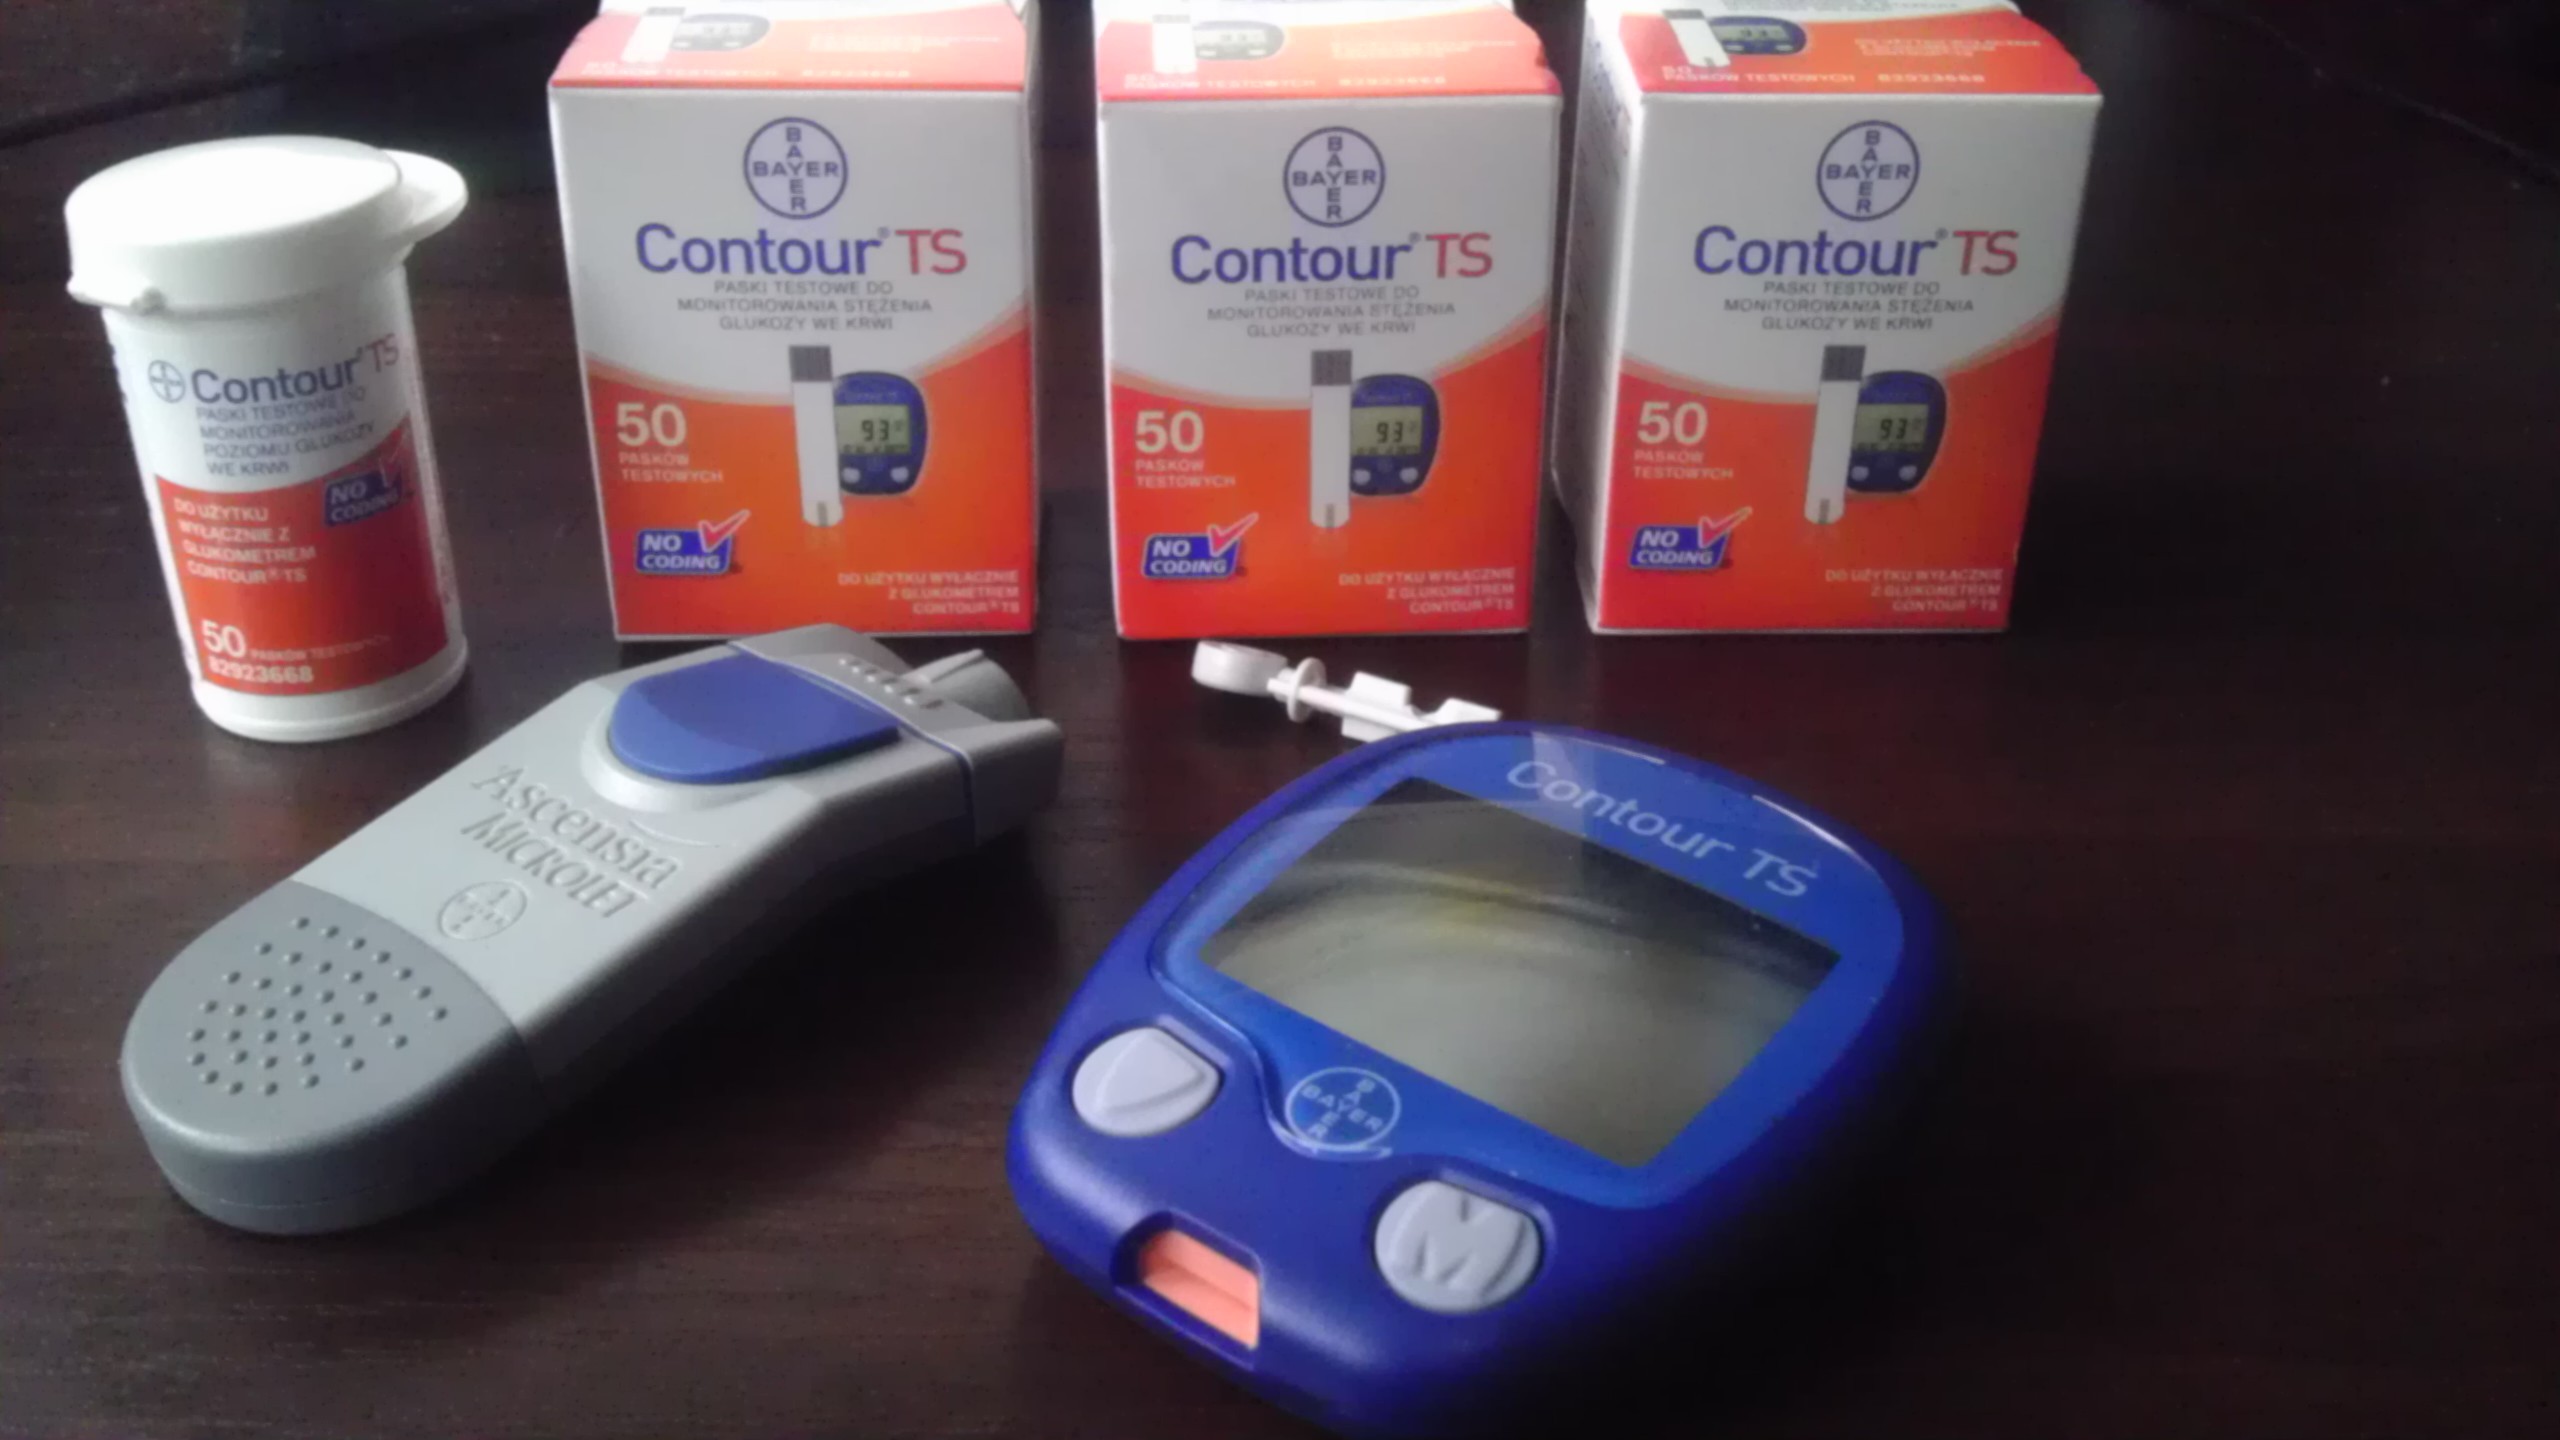
* Measure at least 40 points with urine colours and glucosis, try to fit the data.
The next stages depend if there will be any algorithm that is able to predict body hydration, let's suppose it will work, then next steps would be probably:
* Implement pulse-oximetry (for energy outcome computation).
* Build smaller device, based on SMD components that would be comfortable to wear in constant.
* Try to learn the energy balance with a substitution that 70% of kcal come from carbohydrates and 30% from fatty acids.
* Try to predict the blood saturation in triglicerides using either long term observation or direct calibration with blood analysis.
* Try to reproduce the similar results on other individuals, perform calibration for other users.
In general: glucosis and triglicerydes levels would represent energy income and oxygen blood saturation would represent energy outcome.

 jaromir.sukuba
 Andy Oliver
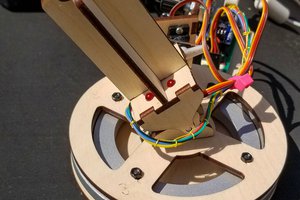
 Dave Ehnebuske
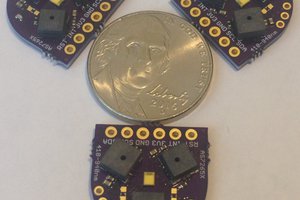
 Kris Winer