 Marek
MarekColor of course!
Some time ago I was looking for a efficient and simple way to measure body hydration. Basicly it always limits to study either sweat or urine. I haven't been considering sweat study, since it seems to be rather good for sport solutions, where skin is wet for most of time.
If we're speaking about urine, it's either refractometry (pretty accurate but complicated and needs some equipment) or study of the color (less accurate but rather simple).
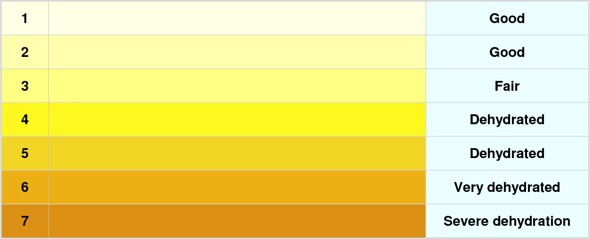
I decided to go on urine color study, but then I realized, all the urine color charts I found on the internet limited to approximately 7 points, it's not much for Machine Learning or any accurate study... Here's an example.
I started to think about how could I extend the dataset. At the moment I was pretty much interested in brewery and I was watching a Polish youtube channel of a guy who speaks quite a lot about beer.
Turns out, at the brewing competitions judges use a predefined scale (called Standard Reference Method or SRM) which is quite developped in number of data entries.
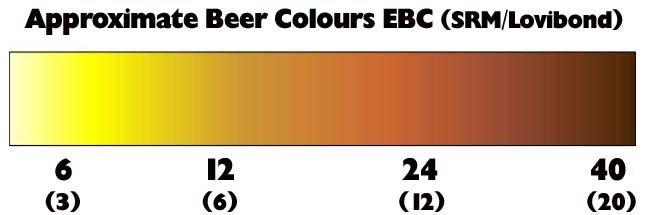
Just admit that it really seems like urine color chart points are included in SRM points data set.
Since we are speaking of colors, we can look at each entry as a point in three dimensional spaces (coordinates R, G and B).
They seemed similar, but it needs to be proved, so I written a simple Python script that uses Python Imaging Library. I extracted points from SRM chart and computed the euclidean distance between each of those points and points of urine color chart. This way I found 6 most similar (in terms of distance) points and computed even distance between consecutive points to compare if distribution is more or less similar.
The result was that for urine scale (1,2,3,4,5,6,7) equivalent indexes in SRM scale are (1,13,31,70,138,165,205).
The distances between each of those points are the following:
dist(urine(0), srm(1)) = 18.9208879284
dist(urine(1), srm(13)) = 2.2360679775
dist(urine(2), srm(31)) = 2.2360679775
dist(urine(3), srm(70)) = 5.09901951359
dist(urine(4), srm(138)) = 18.7082869339
dist(urine(5), srm(165)) = 21.6794833887
dist(urine(6), srm(205)) = 31.8119474412
Where urine(x) gives [r,g,b] values of color x in urine chart and similar for srm(x) that provides equivalent in SRM scale.
We can deduce that it is pretty accurate. We need to remember that RGB values are in range of one byte (0 - 255) and in worst case we have a difference of ~31, in my opinion for simple solution like this it is not that bad. For some points the accuracy is extremely good, like 1-13, 2-31, 3-70...
Now lets study the relations (Euclidean distances) between consecutive colors in each chart. For urine color chart I found:
(56.0, 42.0, 99.2673158698, 36.7423461417, 41.3158565202, 36.2491379208)
And in SRM chart the differences between consecutive points we found are:
(38.170669368, 43.0116263352, 99.0201999594, 40.0249921924, 27.2946881279, 31.874754901)
Those values look really related. The best way to explain it is using the example. In approximation the distance between Fair and Dehydrated in urine scale equals 99.2673158698, in case of related points in SRM scale we find 99.0201999594, so in both cases will be ~99, which means the ratio is really similar.
I hope you found this interresting. I will keep posting project news, stay tuned!
Cheers!
Discussions
Become a Hackaday.io Member
Create an account to leave a comment. Already have an account? Log In.