 Michael Doody
The probability data really shows some interesting features. Again, the probability parameter of each 1 second data point is affected by the 3D magnitude, the averaged compass direction and the angular depth of that data point. It is clear that these 3 parameters are inter-related as well. The display of these individual data parameters against the probability statistic shows an interesting subpopulation of noise events.
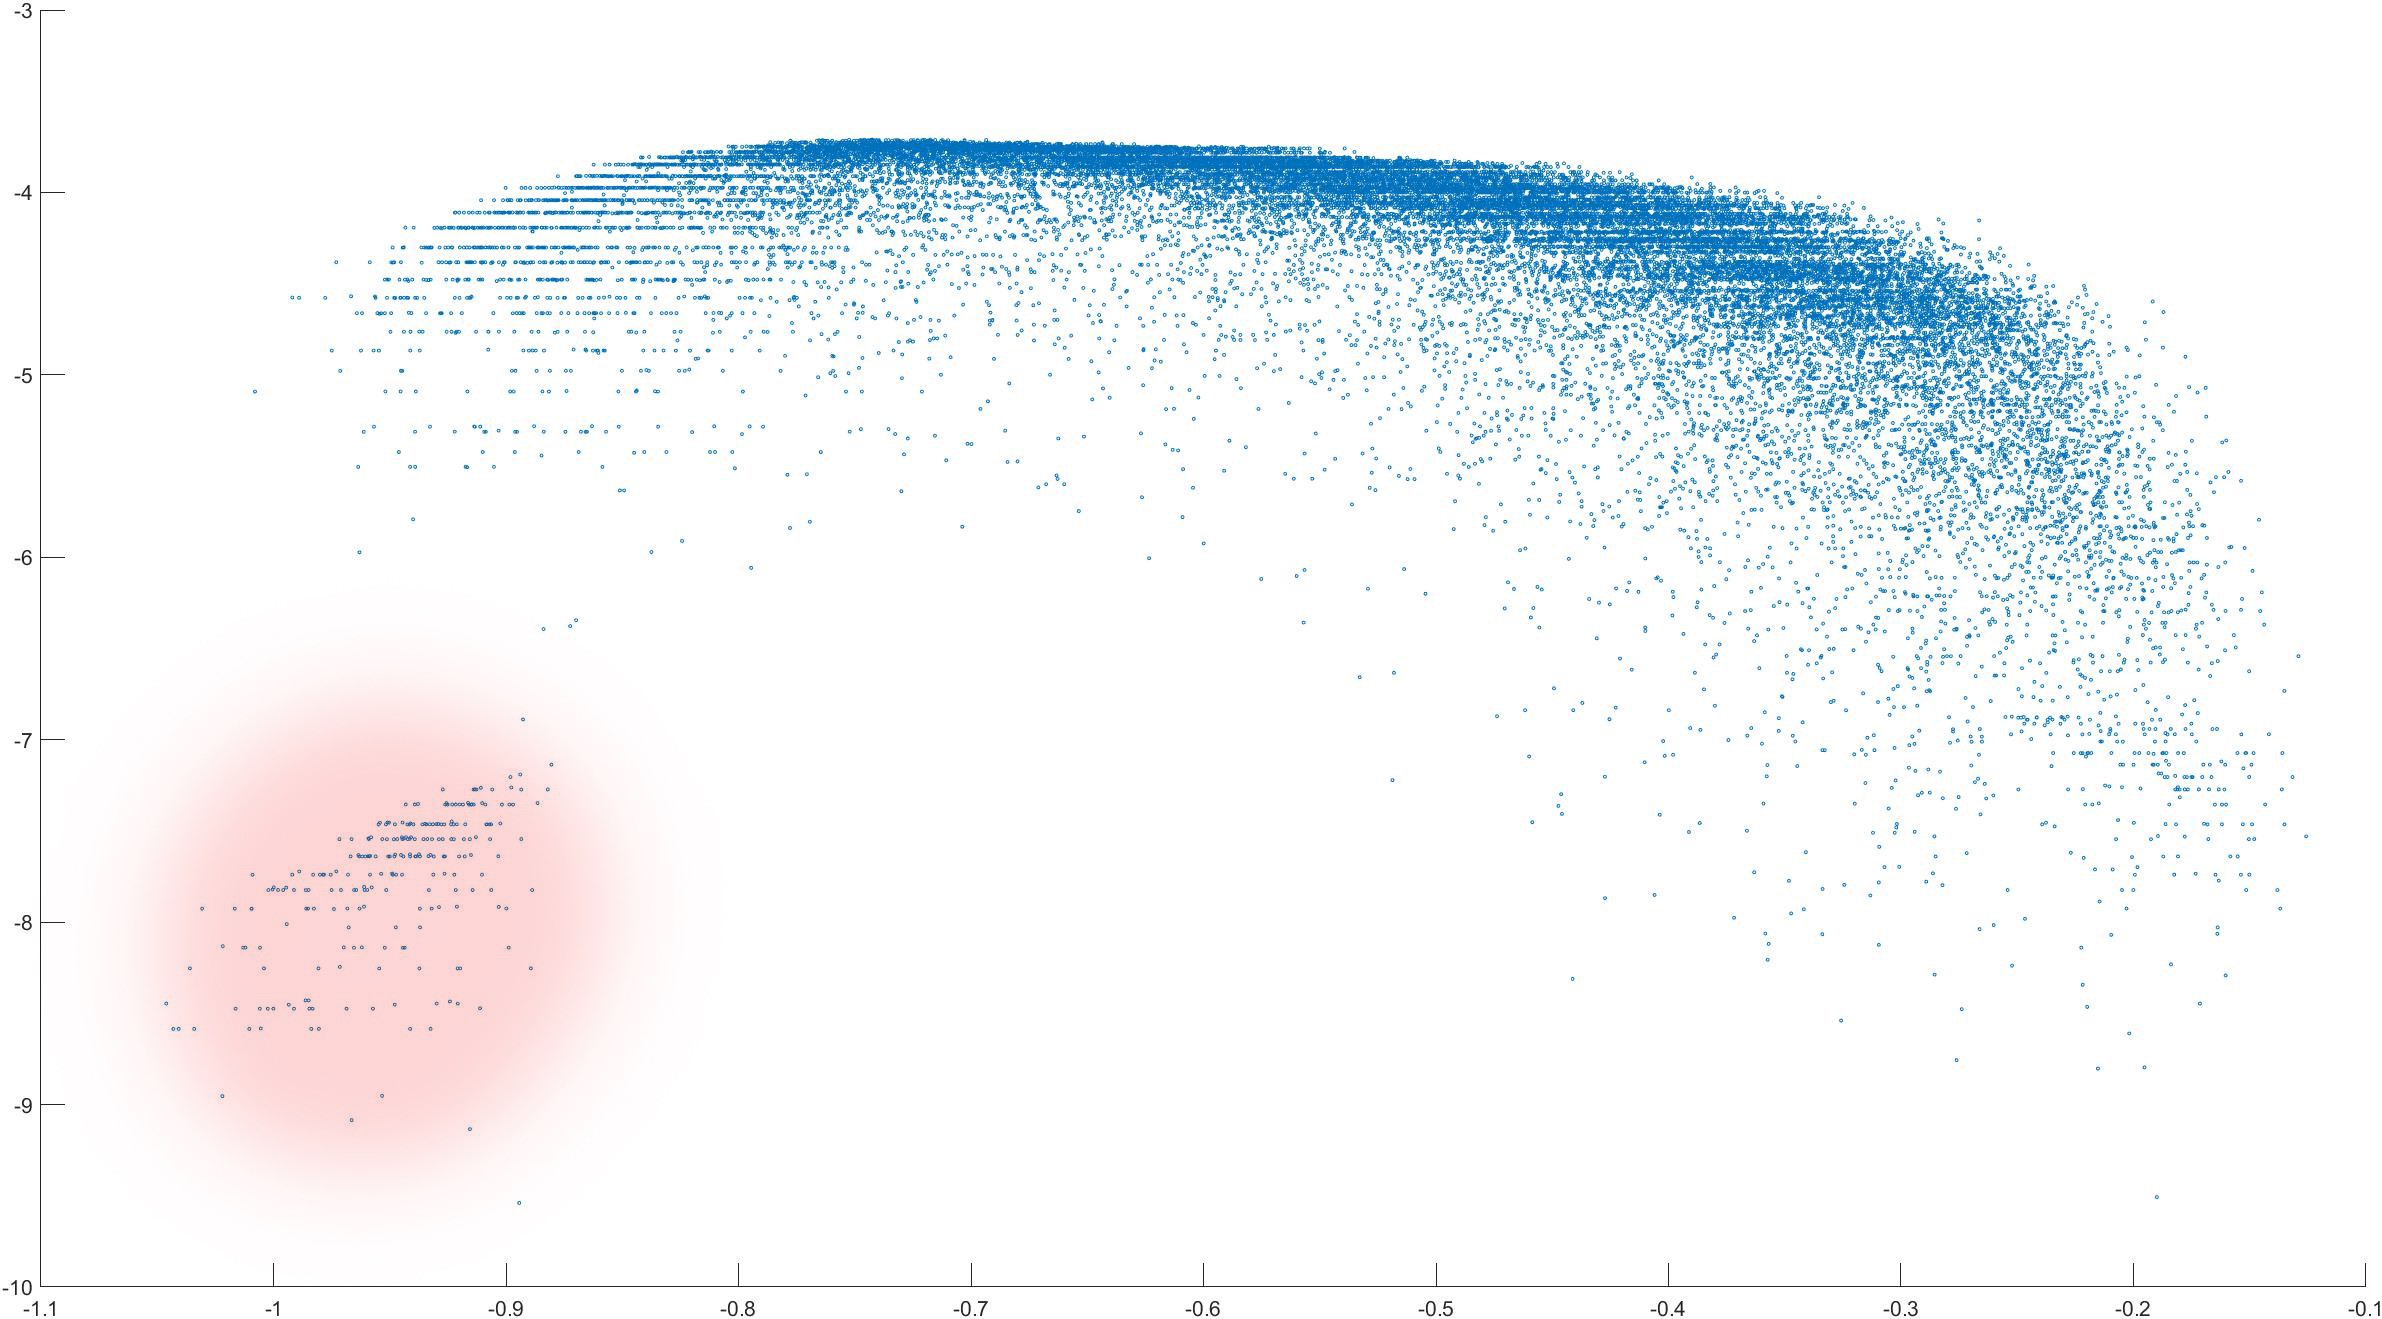
This is a plot of angular depth (X axis) vs. probability statistic for Yellowstone data from the last 9 1/2 hours. There is a clustering of data points at around -1 radians of depth that is clearly separate from the rest of the data.
The "steps" in the combined probability data relate to the fact that the magnitude and vector origin probabilities are stored in discrete "bins" that are not continuous.
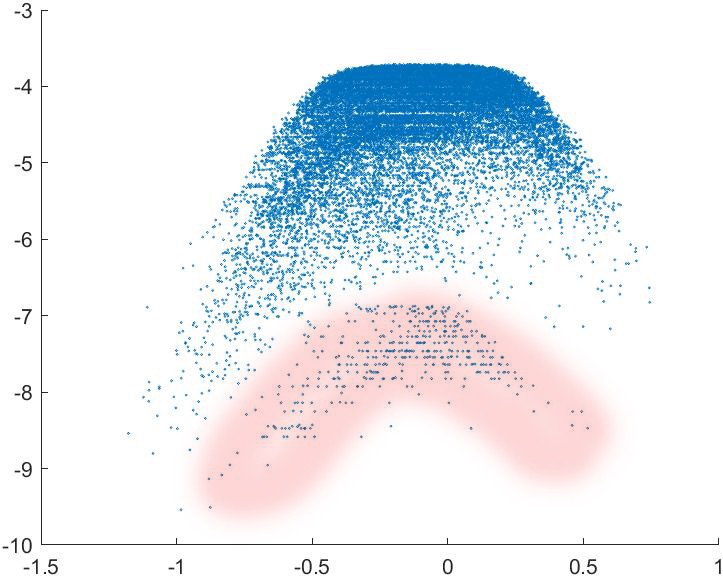
Next is the same data set showing compass direction - another cluster of points is seen, but their compass locations do not seem to be out of the ordinary. The discrepancy must therefore be related to magnitude or angular depth.
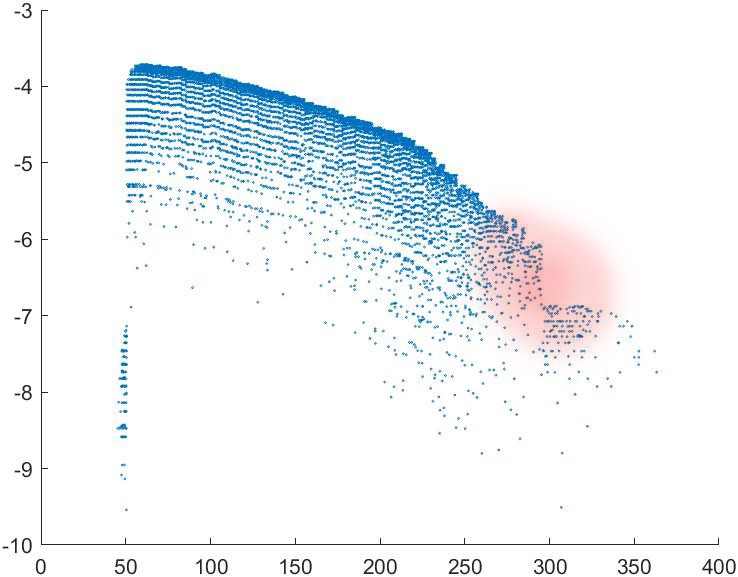
Next is a plot of 3D magnitude vs. the overall probability statistic. There is a break in the data at the higher magnitudes. Something seems to be "pushing down" the probabilities of points that "should have been" in the -6 to -7 range. If these are the same misplaced points as in the plot immediately above, it sounds like the data points with anomalous angular depth (from the first plot) may explain the discrepancies.
What does all of this mean? More to follow as I try to figure it all out!
Discussions
Become a Hackaday.io Member
Create an account to leave a comment. Already have an account? Log In.