 Michael Doody
On 5/14/2020 at 21:56:00 UTC (3:56 PM local mountain time) a 2.4 magnitude tremor occurred close to the location of the Yellowstone area machine. The location as determined by the USGS was 44.955°N 111.710°W at 6.6 +/- 1.6 km depth. The event ID is 80422259. The USGS placed the location approximately 4 miles to the West of our device based on their remote regional seismic data but our device placed the signal axis directly to the North and South. The majority of the data collected before, after and during the event was in the linear part of the device's range.
In the last month the device has been remotely installed with new software. This is an extensive upgrade. Timing is now from internet time servers and improvements in SD card utilization now allow data readings every 333 milliseconds. The sensors are now calibrated for baseline and individual sensitivity differences at the time of startup. 200,000 data points are now collected at startup for the determination of the 3Dmagnitude, compass direction and depth probability arrays. The seismic noise background is now recorded in very high definition.
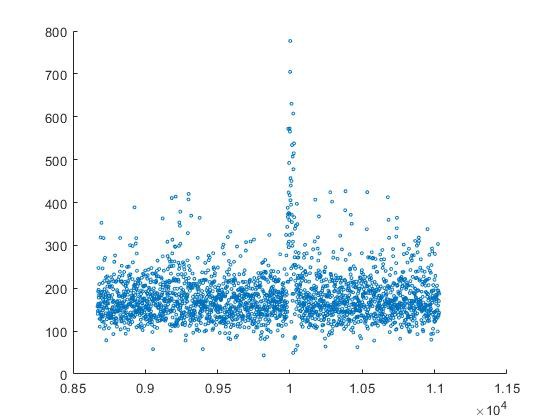
This a plot of the 3D magnitude data for 13 minutes around the event.
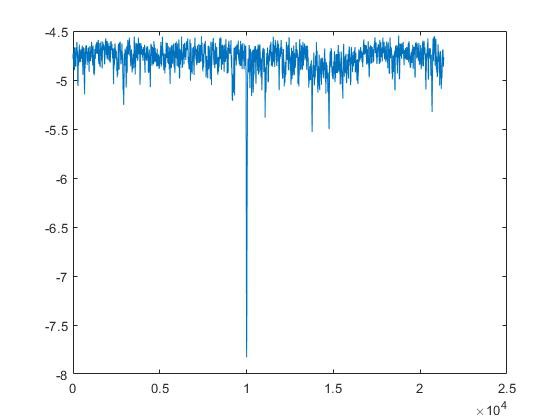
Here is a 10 second moving average of the combined probability statistic for the two hours around the event. There are 21,372 data points in this plot. Probability is in logarithmic format.
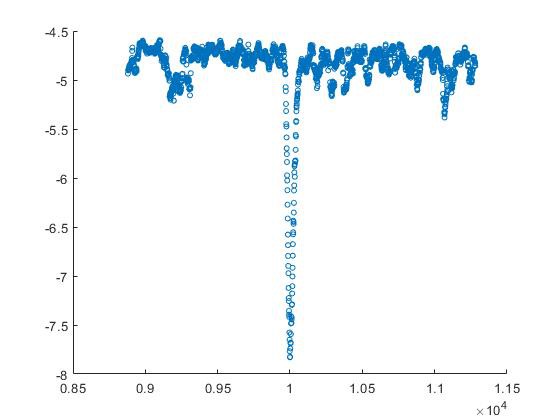
This is a closeup scatter plot of the 10 second moving average. The probability 'blip' prior to the main event precedes it by approximately 4 minutes.
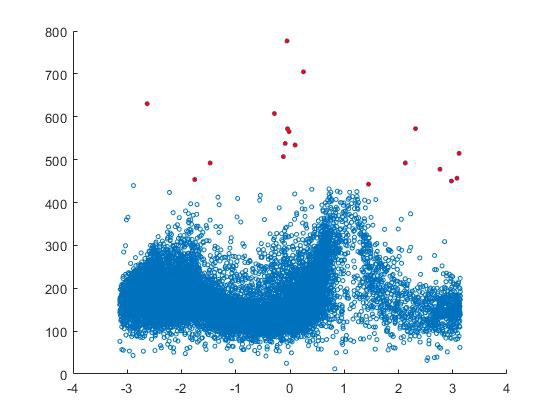
This is a large pixel plot of compass direction vs. 3D magnitude. Red time points are those with magnitudes greater than 450. These are clustered around -pi radians, 0 radians and +pi radians. This indicates a North/South vector axis.
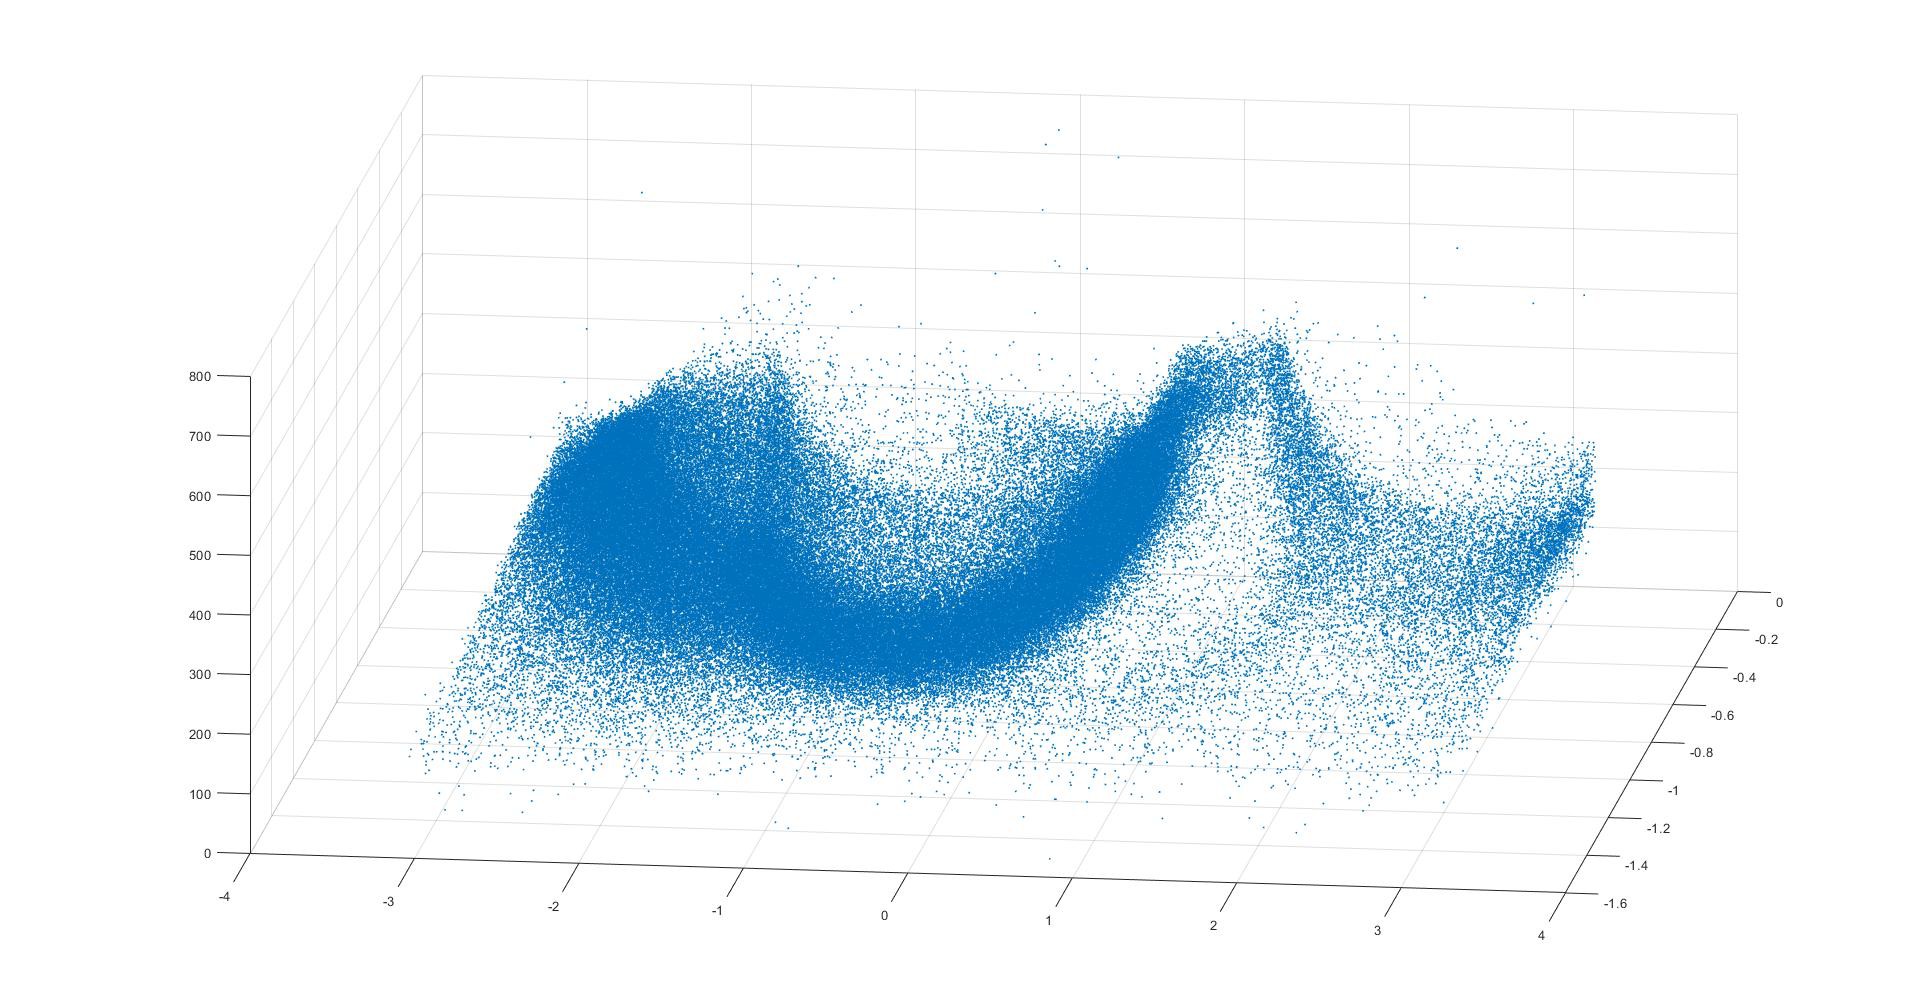
This is the promised hi def view of the local seismic noise over the 24 hours of 05/14/2020.. Compass radians (x axis, East to the left) vs. vs. depth radians (0 = horizontal, pi/2 = vertical) vs. 3Dmagnitude (millivolt units). 21,372 time points.
Discussions
Become a Hackaday.io Member
Create an account to leave a comment. Already have an account? Log In.