 Michael Doody
This morning at 1:00 AM another very small distant event showed up on several of the East Tennessee machines - at the Knoxville, Bacon Ridge and Sewanee locations and on the Copper Ridge short period machine,
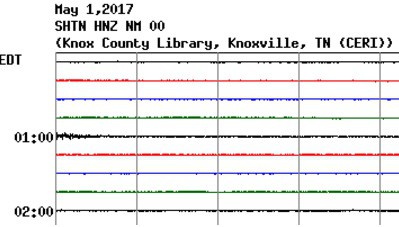
Here is that small tremor, cropped out from the Knoxville CERI/USGS record on the web-
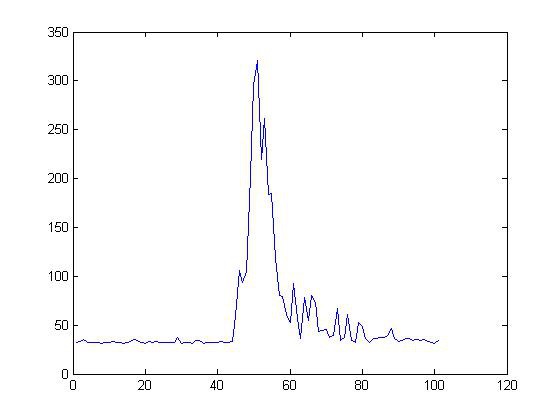
Here is the event as it showed up in the vector magnitude data of one of the garage slab machines -

Here is the vector magnitude data from the 100 seconds around that event-
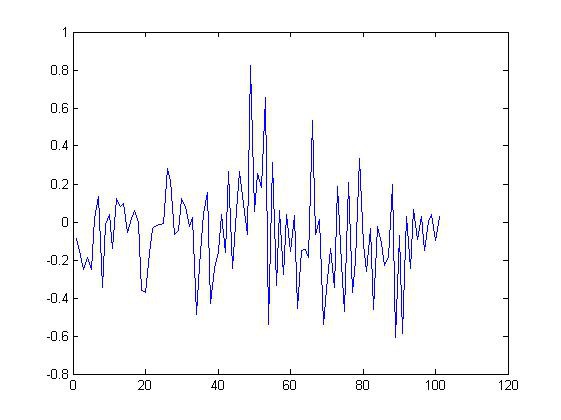
Here is the location data for that same time interval - expressed in radial distance (in radians) from the average compass location of the noise. As with most (but no all) of the distant events that have been recorded so far, the location seems to bounce around - possibly due to echoes and reflection from our regional mountain chain - the Smokey Mountains.
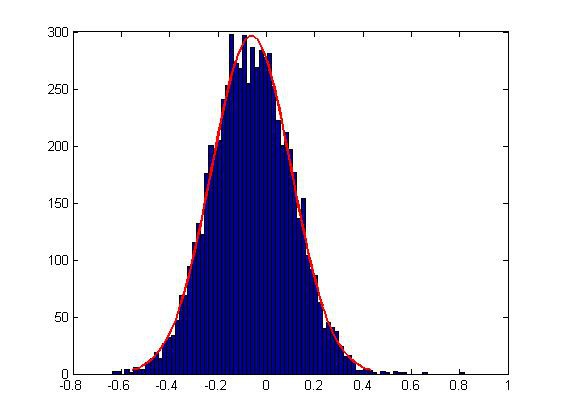
To give meaning to this graph, the next graph shows the distribution of the radial (compass) position of the noise for the 2 hours surrounding the event. The averaging is done in such a way that the distribution should peak at North, or 0 on this graph. The 0.8 value at the peak of the small tremor (see the graph above) is the highest value recorded in that 2 hour interval. Basically, the values greater than 0.4 radians and less than -0.4 radians are statistical outliers.
The next graph shows the combined probability statistic of the event (green) along with its 5 second running average (blue). Again, this is a logarithmic scale, so the probability values change by 6 orders of magnitude as the event progresses.
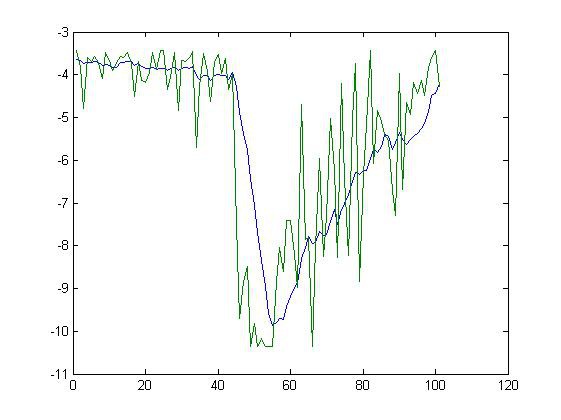
As with the event from several days ago, there was no major advance warning from the statistics data, possibly because of the distance of the event from our machine. There was an unusual brief 2 order of magnitude drop to around -5.8 in the graph about 10 seconds before the main event, however.
Discussions
Become a Hackaday.io Member
Create an account to leave a comment. Already have an account? Log In.