 Wassim
Configuring Includes in VSCode
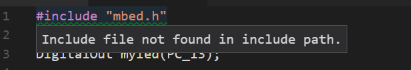
In VSCode you'll see the "mbed.h" underlined in green as not found
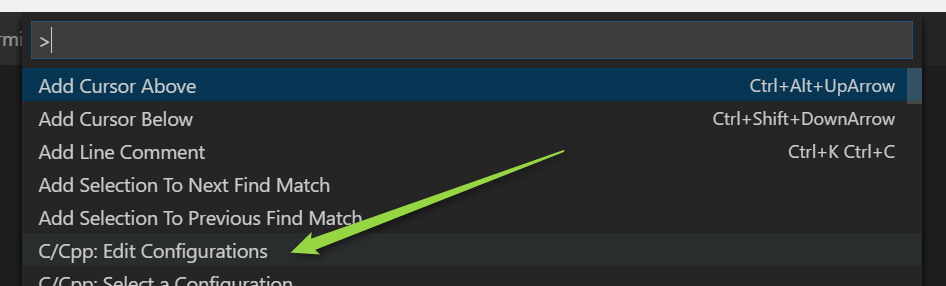
- press "ctrl+shit+p" and click on "Edit Configurations"
- Under the includePath of your matching operating system, add the include
        {
            "name": "Win32",
            "includePath": [
                "C:/Program Files (x86)/Microsoft Visual Studio 14.0/VC/include/*",
                "C:/Users/User/.platformio/packages/framework-mbed"
            ],
            "browse": {
                "limitSymbolsToIncludedHeaders": true,
                "databaseFilename": ""
            }
        }
You should now be able to navigate, such as right click and the "Go to Definition" would open the file for you in VSCode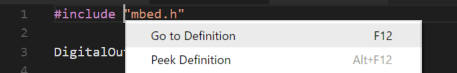
Before debugging
- You might want to finish compiling and flashing first
Debugging with VSCode (Start is right then got stuck)
well, haven't we seen this tool somewhere already ? Going back to the ".platformio\packages\tool-stlink" we find all of
| st-flash | the flash utility used with the command line above |
| st-info | retrives information (flash, srma,... see help) |
| st-util | this is the magic utility that changes your ST-Link HW+SW into a gdb server |
- run "st-util" from the command window (outside VSCode)
- From VSCode, click on "Debug" icon or menu, then click on config
I'm using this configuration
{
    "version": "0.2.0",
    "configurations": [
        {
            "type": "gdb",
            "request": "launch",
            "name": "Debug Microcontroller",
            "target": "extended-remote /dev/cu.usbmodem00000000",
            "executable": ".pioenvs/bluepill_f103c8/firmware.elf",
            "cwd": "${workspaceRoot}",
            "autorun": [
                "monitor tpwr enable",
                "monitor swdp_scan",
                "attach 1",
                "load .pioenvs/bluepill_f103c8/firmware.elf"
            ]
        },
    {
        "type": "gdb",
        "request": "attach",
        "name": "Attach to gdbserver",
        "executable": ".pioenvs/bluepill_f103c8/firmware.elf",
        "target": ":4242",
        "remote": true,
        "cwd": "${workspaceRoot}"
    }
    ]
}
With this, you can connect to the gdb server, load the program, but then I failed to step, I got an error, so here's where any help would be appreciated. I think the platformIO are working on an IDE with an integrated debug, well I bet it is the continuation of this process. But with the useful correct configuration that I'm probably missing.
Discussions
Become a Hackaday.io Member
Create an account to leave a comment. Already have an account? Log In.
im doing exact the same thing. my st-util is listening on port 4242 but i get this error in vs code :(
""Debug adapter process has terminated unexpectedly (exit code: null)""
Are you sure? yes | no
Try to use the following configuration (VSCode):
{
"version": "0.2.0",
"configurations": [
{
"type": "gdb",
"request": "attach",
"name": "Attach to gdbserver",
"executable": "${workspaceRoot}/build/firmware.elf",
"target": ":3333",
"remote": true,
"cwd": "${workspaceRoot}",
"gdbpath": "path to arm-none-eabi-gdb.exe",
"autorun": [
"monitor reset halt",
"load path to firmware.elf"
]
}
],
"compounds": []
}
"target": ":3333" - 3333 is the port which opens gdbserver (openocd).
"load path to firmware.elf" - load is the command gdb.
Are you sure? yes | no