Close
0%
0%

Arduino GPRS IOT Weather Station

Internet enabled (IOT) weather station using the GPRS network

Similar projects worth following
In my continuing efforts to control my island's weather I have rebuilt my autonomous GPRS weather station with upgraded 'industry standard' factory calibrated wind sensors and made several significant improvements for better energy efficiency.

So why would anyone need such an elaborate weather station? .... Think 'Wind turbines', 'Farmers' and 'Gardeners'! ...... Anybody wanting to install an expensive wind turbine would need to assess the site feasibility before spending all that cash. Farmers and gardeners need to know the moisture content and temperature of their soil by monitoring rainfall and soil conditions. Crops such as carrots and early potatoes are particularly sensitive to soil temperature for initial seed germination. Plant your potatoes too early in cold soil and the whole crop becomes overwhelmed by weeds.

Check out the live online webpage, as shown below, here: CLICKY LINKYOnline WebpageFeatures:

  • Wind vane (low torque, low energy, high accuracy)
  • Anemometer (calibrated)
  • GPRS 2G data transmission
  • Power saving 'sleeping Arduinos'
  • Power saving buck convertor 12v to 5v supply
  • Soil moisture
  • Soil temperature
  • Air humidity
  • Pressure
  • Rain
  • Outside temperature
  • Battery voltage
  • Forecasting by calculating pressure swing
  • Webpage data display
  • Autonomous solar powered - no wifi or grid power required
  • Removable TFT display for debugging
  • How it Works:

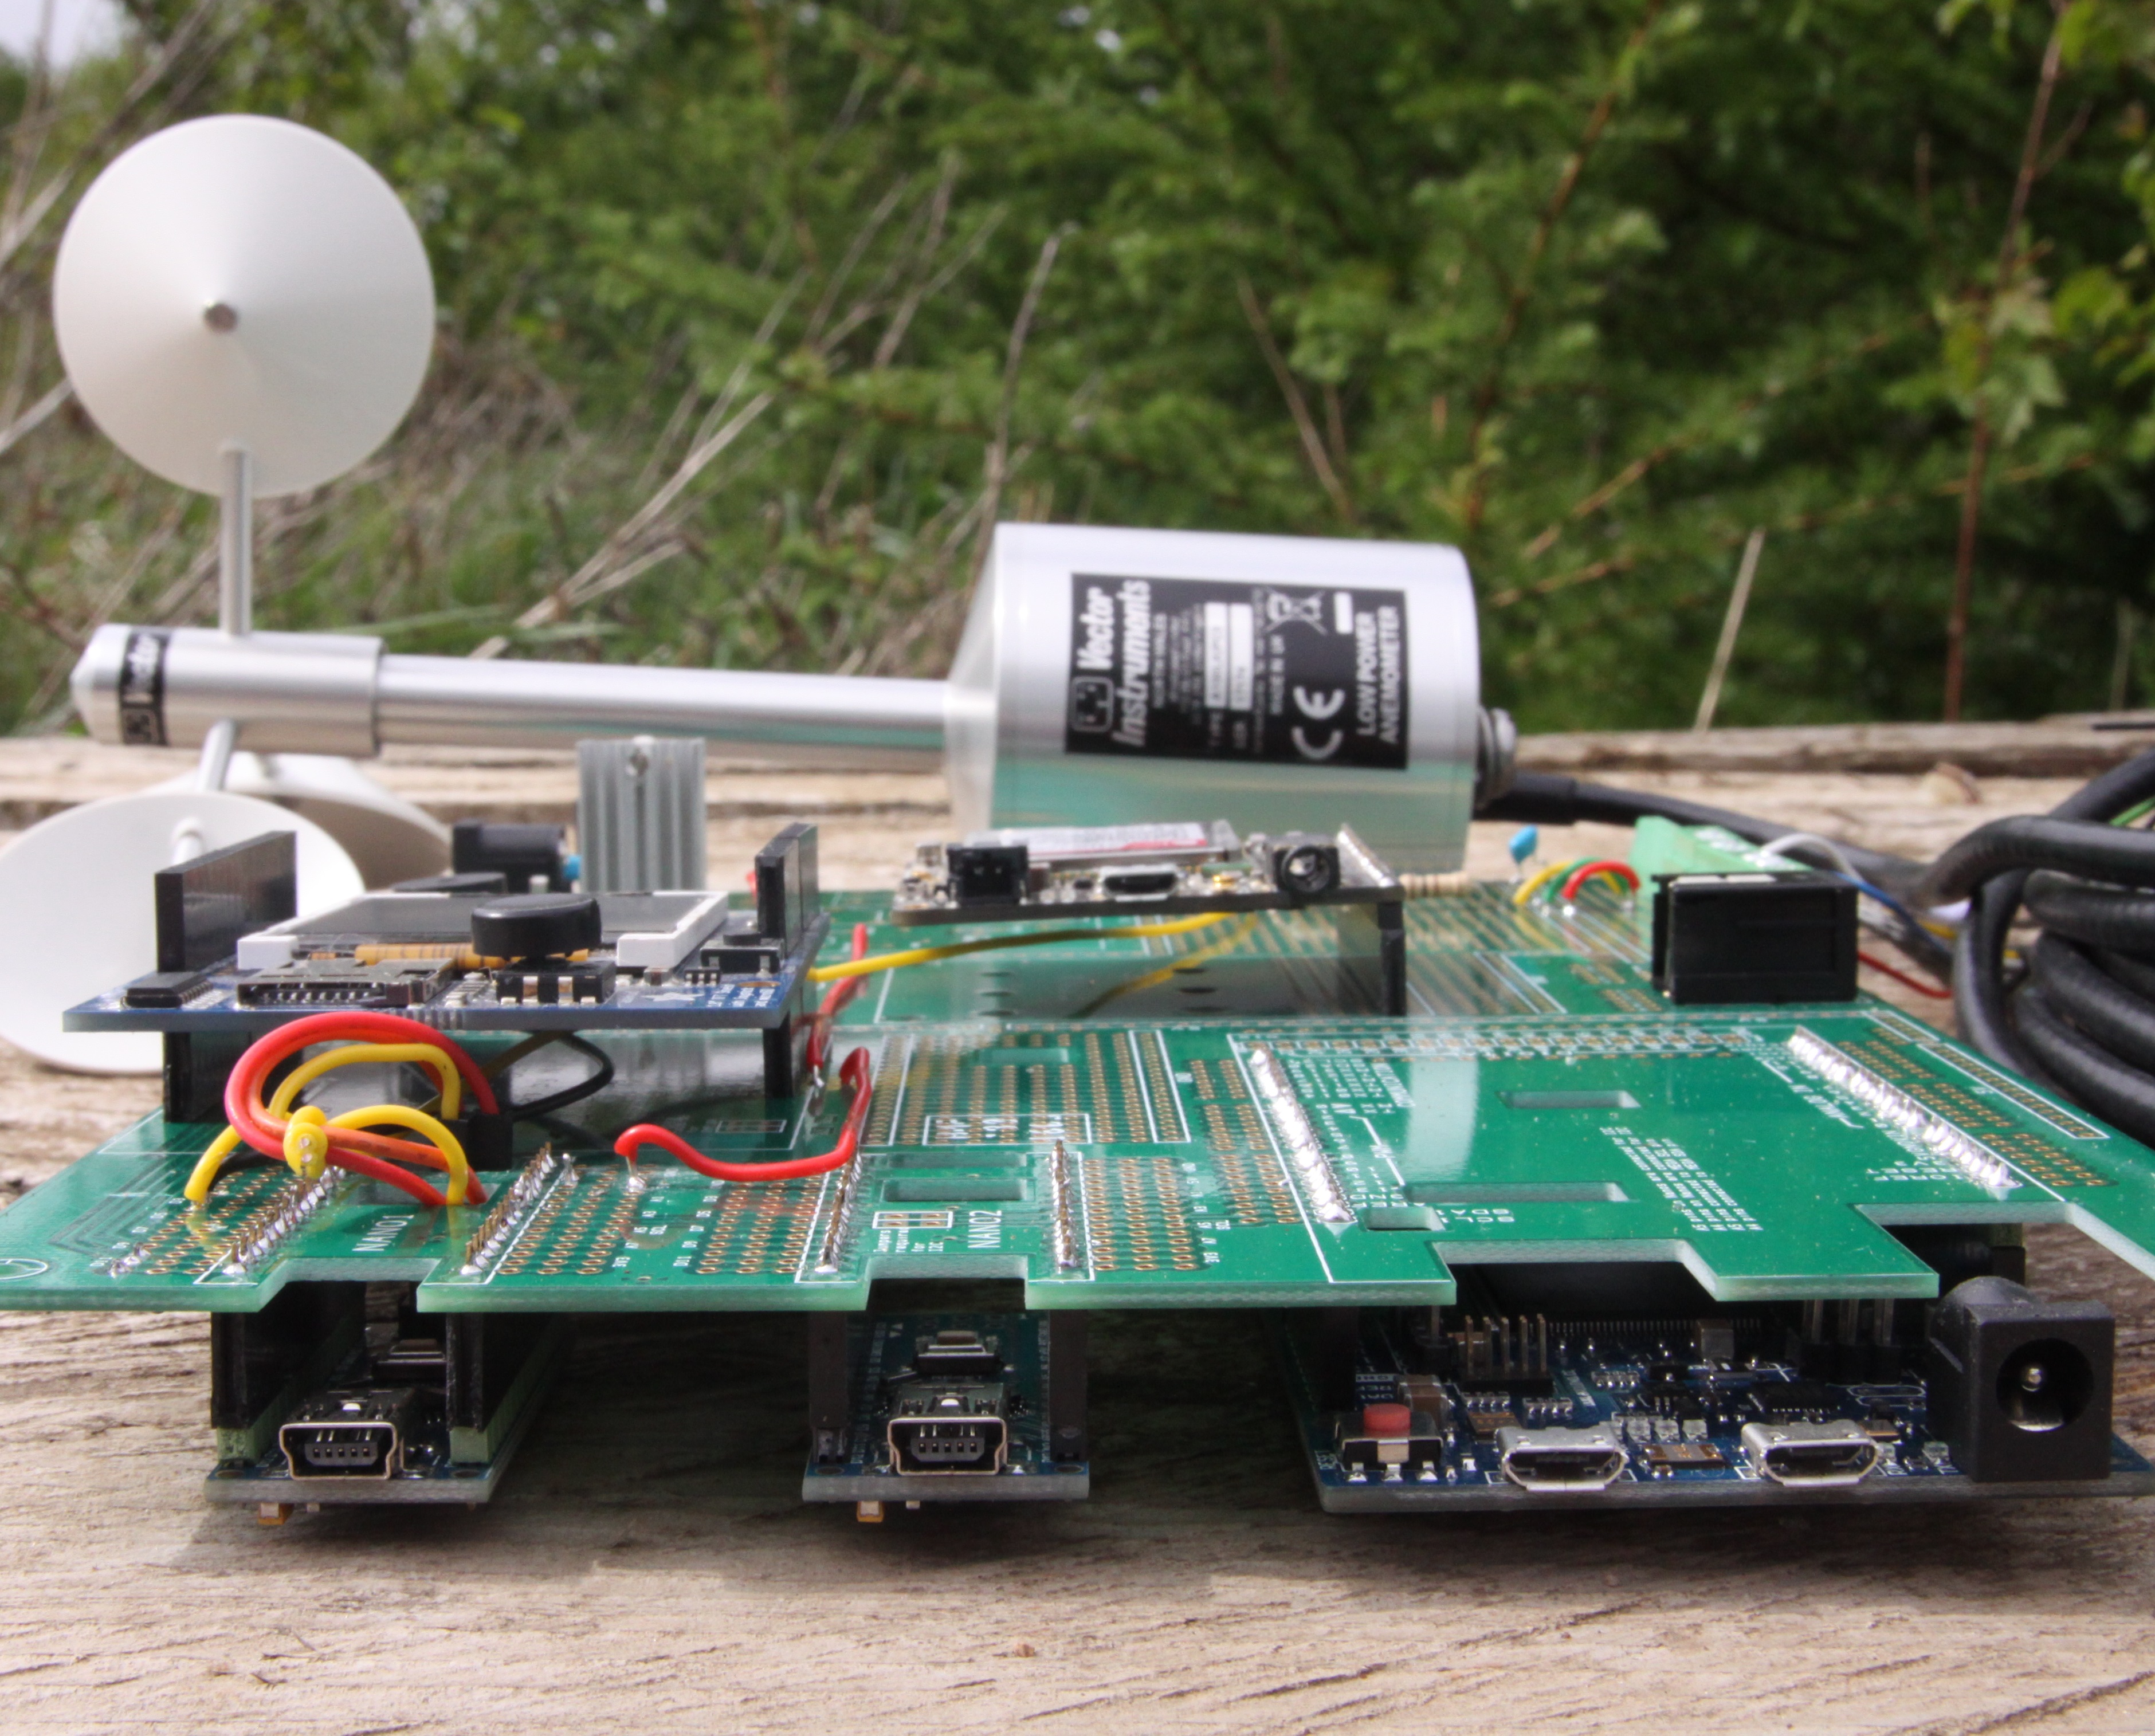
    Of the three Arduinos in this design, one just operates the TFT screen and can be removed after all debugging has been done. The small, second, 'Master' Nano takes readings of wind speed via the Arduino 'pulse in' command and rainfall is monitored on an 'interrupt' so that not a single drop of rain is ever missed. The other interrupt on the master monitors a call back from the Arduino Mega slave, which tells it when data has successfully been transmitted to the Interweb. On successful transmission, the values for wind speed, wind direction, volts and rainfall are reset to zero. If transmission fails for any reason, wind speed and rain are kept in the memory for the next transmission attempt so no important data is ever lost. The third Arduino, a Mega 2560, controls the FONA GPRS module and other sensors such as humidity, pressure and temperatures.

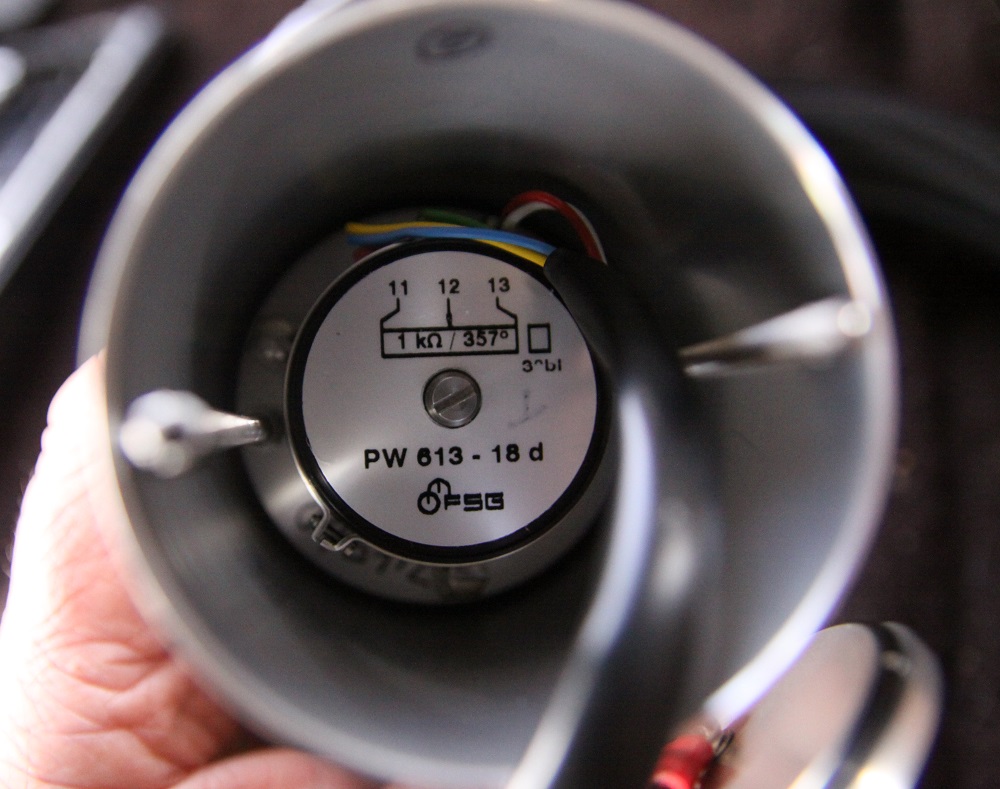
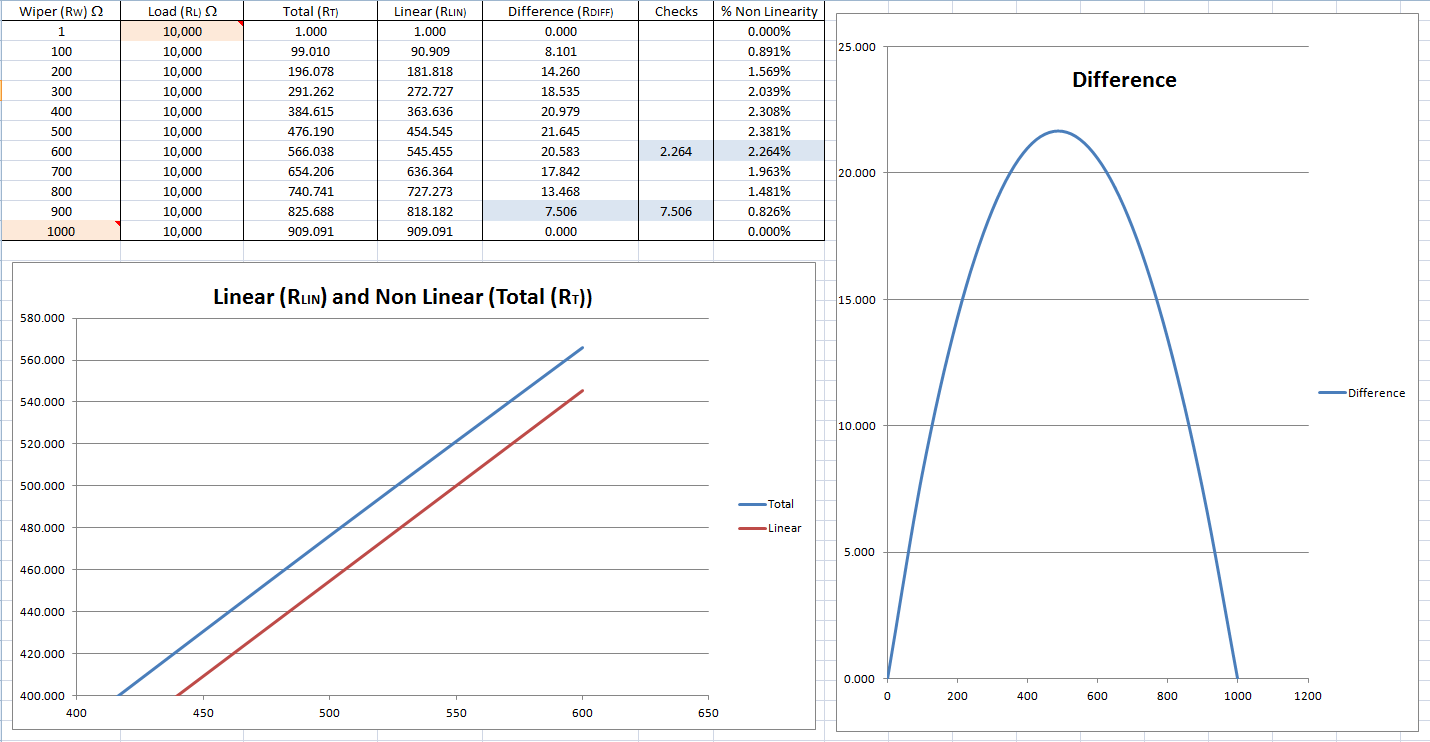
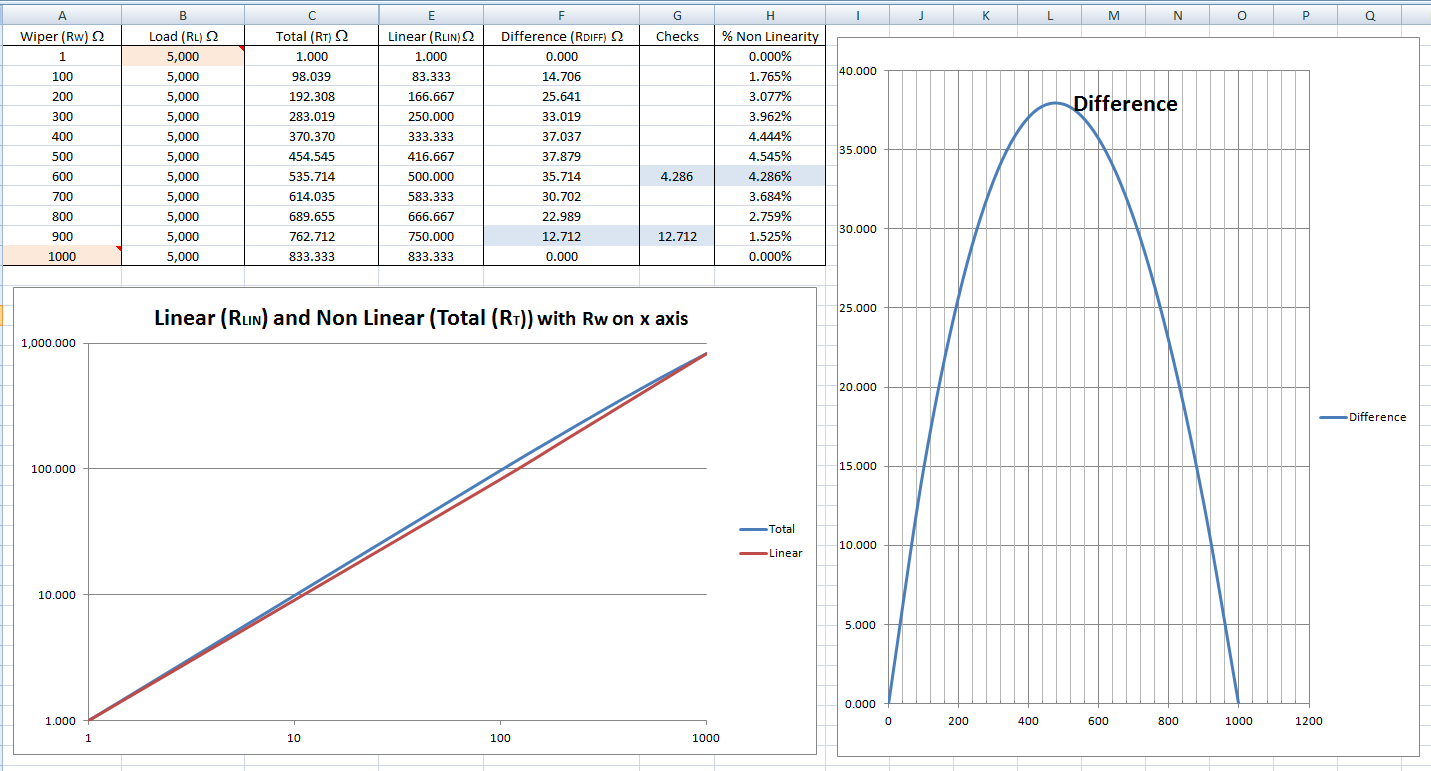
    High accuracy and energy efficiency is achieved by using industry standard wind sensors which are individually calibrated at the factory.

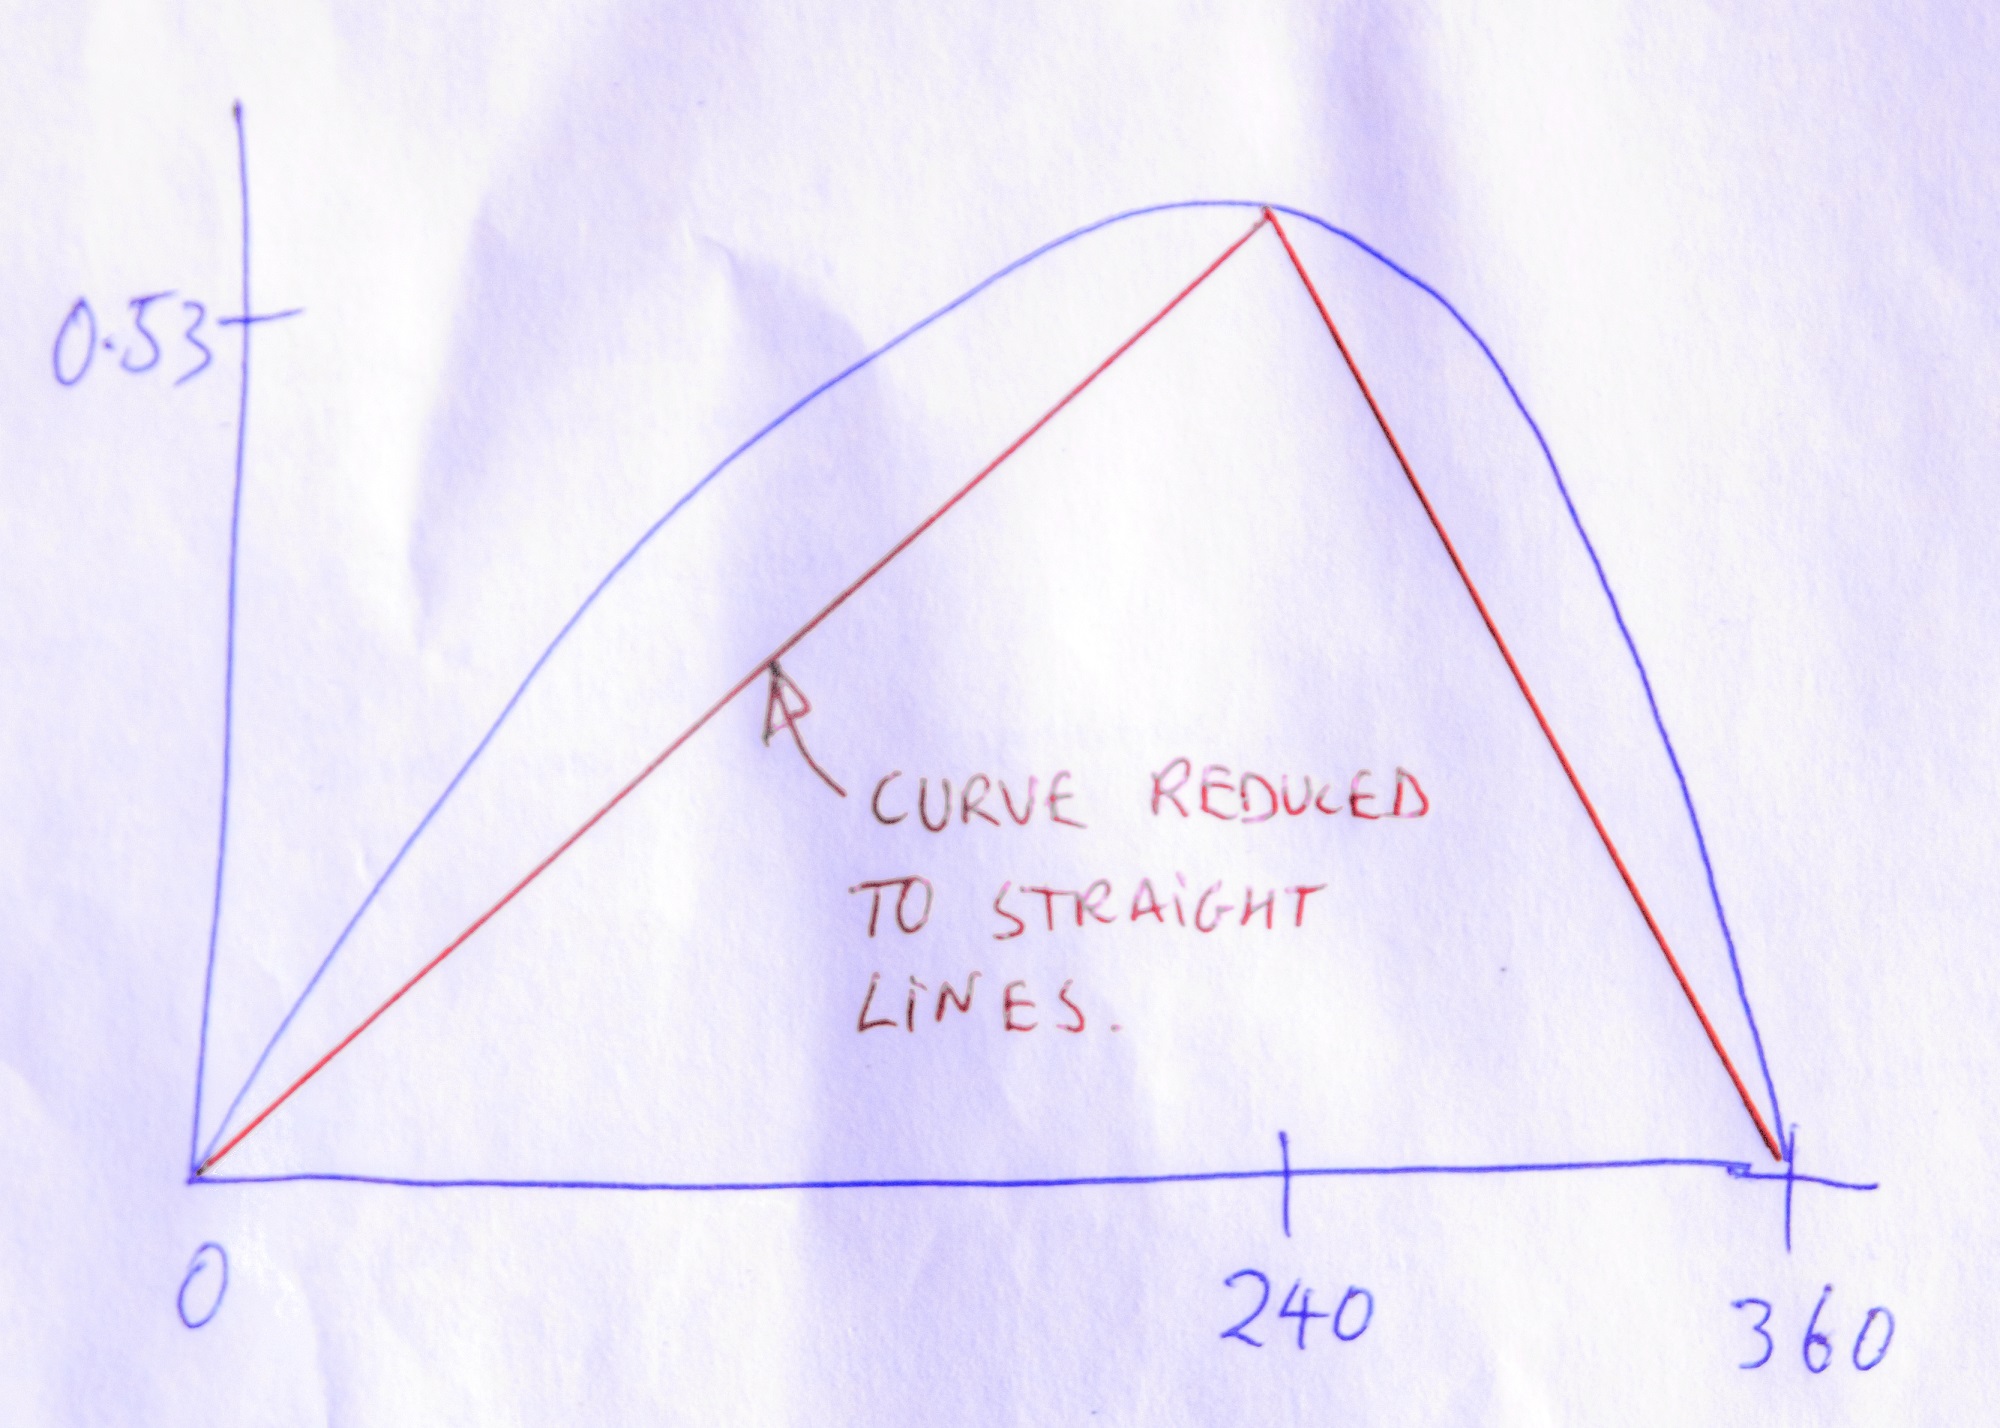
    Since this is quite a big project - it took me 18 months to put together - some of the background research and calculations are to be found in the 'Project Logs' section to try and keep the instructions section a bit easier to follow.

    If there was enough interest I would create a purpose made PCB for the project, rather than using the general purpose 'Hackable' prototyping board that I used here, which would make it much easier for people to re-create this project.

    FJ2UVH9IOEXX9UP.xlsm

    Calculating the low pass Filter Parameters for anemometer.

    12 - 26.12 kB - 04/16/2017 at 10:48

    Download

    FD1VN7CIO0GGHVS.xlsx

    Calculate non-linearity in wind vane.

    sheet - 23.00 kB - 04/16/2017 at 10:46

    Download

    ino - 9.50 kB - 04/15/2017 at 17:20

    Download

    - 21.36 kB - 04/15/2017 at 17:20

    Download

    ino - 17.08 kB - 04/15/2017 at 17:19

    Download

    View all 7 files

    • 1 × C3 Electrolytic Capacitor voltage 16V; package 100 mil [THT, electrolytic]; capacitance 100µF
    • 1 × C4 Ceramic Capacitor voltage 6.3V; package 100 mil [THT, multilayer]; capacitance 100nF
    • 1 × C5 Electrolytic Capacitor voltage 16V; package 100 mil [THT, electrolytic]; capacitance 1µF
    • 1 × C6 Ceramic Capacitor voltage 6.3V; package 100 mil [THT, multilayer]; capacitance 100nF
    • 1 × D1 Rectifier Diode package 300 mil [THT]; type Rectifier; part # 1N4001

    View all 38 components

    • Analogue Wind Vane With Auto Set Up

      Capt. Flatus O'Flaherty ☠04/16/2017 at 11:00 0 comments

      As the amazing online GPRS Weather Station project continues, we have yet another upgrade to the vast array of sensors with a professional analogue wind vane, kindly donated by Vector Instruments. This device will eventually be hooked into the new, upgraded, weather station module that I am designing. The current prototype is producing live data here: http://www.goatindustries.co.uk/weather2/ .

      Comparing this sensor to my DIY Digital Wind Vane the first thing I noticed was the extreme sensitivity to wind movement - it has very low torque - so it is able to pick up wind direction even in very small wind speeds. Secondly, being made on a CNC lathe, the quality of the engineering is superb - I really must get myself a CNC lathe!

      Here, I am going to show how I set up and coded an arduino to read the sensor, made calculations for non-linearity, took account of the 'dead zone' in the potentiometer, turned the readings into a large numerical array, efficiently calculated the mode value and made the whole device set itself up automatically. No pressure!

      This analogue wind vane is based on a very expensive potentiometer with three main connections - 5V, ground and wiper. The wiring inside the deice is very thin so great care is needed not to put too much current through the circuits for too long or it could quite easily get burnt out.

      I have protected the wiper part of the circuit with a 10k resistor which feeds a signal to the arduino via pin A0. This is then converted into a digital 10 bit code inside the processor with a full range of 0 to 1024. The device is never fed a continuous supply of power and is pulsed in two different ways. Firstly, there is a load of really fast 50 millisecond pulses which gets us 10 readings at a time, next the whole device goes off for 1/2 a second until the next batch of readings is made. By working out an average (mean), we end up with one fairly accurate reading per second.

      So now that we've got this digital reading - what else could be simpler? Surely that's the end of it?

      Firstly, when working with analogue to digital conversion in the past, I have noticed significant 'drift' around minimum and maximum values and so some code is going to need to be written to counteract this phenomenon. Secondly, wind can sometimes be extremely turbulent which makes it very difficult to get an accurate output value. If the wind was constantly changing from, say, south to west we would want to process our data in such a way that it would give the most common direction, not just the average or 'mean', otherwise we would just get a value of south-west. To explain in more detail - the wind might veer from south to west and back again, but actually it's mostly coming from the south-south-west. If this is beginning to hurt your brain cells, I totally sympathise!

      Fortunately we have solutions to both the above problems - we take as many readings as the system memory and speed will allow and build some truly massive arrays of numbers. We then make a continuous log of the number of times each part of the array is hit and then, finally, spit out the most popular. In the digital wind vane project I wrote some rather clunky code for calculating the 'mode' value and now, with the power of some extra nutritious coffee granules, I have reduced that code to something rather more sublime!

      Finally, after about ten minutes, just when our arrays are about to explode the arduino into a million fragments of silicon dust, we retrieve a single wind direction value eg 215 with a second arduino and reset all the large numbers to zero.

      Now that we're beginning to feel quite glib about our engineering prowess, the analogue wind vane chucks at us 2 more major problems - ONE: With the recommended 100K load in place, it does not produce a true linear output and TWO: it has a dead zone around the north pole of about 3 degrees. At first, my brain cells started to panic at the prospects of solving the non linearity problem but then they remembered that wind...

      Read more »

    • Analogue Sensors - Calculate the Nonlinearity Introduced by a Load or Pull Down Resistor

      Capt. Flatus O'Flaherty ☠04/16/2017 at 10:46 0 comments

      Have you ever had that terrible feeling that adding a load resistor or 'pull down' to your sensor is messing up all your analogue readings?

      Maybe you're wondering why we'd want to spoil a perfectly good circuit by putting in a load resistor at all?

      For many years I found that I would get strange, unpredictable, readings from my sensor related projects at the maximum and minimum locations when using analogue digital convertors (ADCs). I always blamed this on poorly designed micro processors and never for once thought that it might be my own circuit designs at fault ..... until now.

      To use an analogy, when the sensor goes to maximum or minimum, it does not just reach a maximum point, but quite often actually falls off the edge of the world into a kind of no man's land where it is then prey to all kinds of digital noise and other generally nasty things like Goblins and Elves. Anybody who, like me, who has blamed this on their arduino is totally forgiven!

      The example I'm using here is a simple three legged potentiometer with a ground, 5 volt and 'wiper' connection.

      Using the correct pull down resistor we can eliminate noisy readings from our projects ....... And ....... just to prove that math can actually be fun .......... I'll tell you how I discovered the non linearity adjustment formula through diagrams and images.

      In the circuit above we have are reading a simple potentiometer through it's 'wiper' arm through a 8.25K resistor and 16 bit ADC chip. Crucially, there is also a 100nF capacitor and a 100K resistor going to the ground rail from the wiper. We're going to concentrate on the 100K resistor. 100K is the recommended value from the manufacturers of the instrument.

      There's nothing unusual about this circuit and it looks pretty boring until we look at what's happening with the resistor in more detail.

      To get rid of the noises (and the Goblins and Elves) we want the resistor to be fairly small in ohms - maybe 10K, but if our pot is, for example 1K, we're going to get a massive amount of non linearity - see for yourself by opening the excel sheet in the files section.

      Initially, I did not set out to discover any formulae - I just wanted to visualise the non linearity created by a load resistor in a sensor related circuit. I wanted to try and isolate the curve and plot it as a graph in Microsoft excel. It just seemed like fun.

      The Math

      :

      I was actually working at the time on this Analogue Wind Vane project, which is basically a continuous potentiometer with a small 'dead zone' at north. Initially, the project was plagued with those familiar noisy readings until I looked at the resistor more closely.

      Firstly, I plotted the actual resistance curve in Microsoft excel, which is the total resistance created by the combination of the wind vane and the load ... and I called it 'Total (RT)'. Initially, I was disappointed as I could not actually see any curve at all, so then I changed both the axes to log10. Hey presto! I can see a curve! (The blue curve on the left in the diagram above).

      The total resistance is given by this well known formula:

      RT w * R L ) / (Rw + RL)

      • where:
      • RT is the total resistance
      • RW is the wiper resistance
      • RL is the load resistance

      OK, so far so good - not too complicated?

      Next, I wanted to see how my new fancy curve looked side by side with a boring straight linear curve, just as if the results were not actually a curve at all, but a straight line. The formula for this is:

      RLINw * RTMAX)/ RWMAX

      • where:
      • RLIN is the hypothetical linear resistance (the 'imaginary' resistance)
      • RW is the wiper resistance
      • RTMAX is the maximum value of the total resistance
      • RWMAX is the maximum value of the wiper resistance

      This is all well and good, but where are we going to get the value of the total resistance from? I really thought this was going to be easier than this, but then realised that we've already calculated this value above, it's just the maximum value of RT . But just for clarification, here is the formula:

      RTMAX WMAX * R L ) / (RWMAX + RL)...

      Read more »

    • Setting Up an A100LK Anemometer on an Arduino

      Capt. Flatus O'Flaherty ☠04/16/2017 at 10:40 0 comments

      Anybody thinking of installing a wind generator, or even a whole flock of wind generators, would be well advised to monitor the proposed site for at least one whole year before spending a penny more on hardware. This is what the A100LK is designed for.

      The first requirement is that it is accurate and calibrated to within very tight tolerances as just a few % 'off' could lose the investors many millions of dollars. My anemometer was very kindly donated to me by Vector Instruments and came with a great swathe of non linearity tables and calibration certificates which needed to be decoded within the arduino to produce super accurate results for my GPRS Weather Station, with live data displayed online at: Meusydd Weather . It also came with a recommendation to install a filter circuit to provide 'low pass filtering with a maximum cut-off frequency of 10khz on the pulsed output'. Surely it can't be any more difficult than filtering home brewed cider?

      Apart from this, I've been dying to get started on version 2 of the GPRS weather station project so this was a perfect opportunity to test out my new 'Weather Station Development Board' and link up, yes, THREE arduinos via I2C and create the beginnings of a processor network that will be capable of becoming fully autonomous by the year 2040.

      The A100LK is calibrated to give out a pulsed frequency that, when divided by 10, gives out a reading in UK knots to an accuracy of no greater than + or - 1%. The device is wired up for 4.7 to 28v and so is ideal for an arduino and reading the pulses is very straight forwards. The pulsed output is basically a square wave with a maximum output of 4v which goes through our filter circuit and is then read by an arduino nano once every five seconds using the 'pulseIn' command. Nothing could be simpler - except that we've got to design the filter.

      The nano then does some calculations to account for the calibration value on the A100LK test certificate and then more calculations to make the output linear. This nice linear output is achieved by writing code to query each and every value against a table of values supplied by Vector Instruments. This may sound difficult, but it is not at all so!

      Lastly, the readings in UK knots need to be compiled into 'mean' averages and provide the maximum gust for a ten minute period. These readings are then displayed on a swanky full colour TFT display on the development board.

      The development board itself is designed with slots for 3 arduinos - 2 nanos and a mega - and has an option for the TFT screen which is operated by one dedicated nano. The other nano is the 'Master' and can turn off the 'Slave' nano when it's not needed and can also turn on the Mega when that's needed and put it back to sleep again afterwards. The reason for the 3 arduinos is that the TFT screen is power, memory and programming space hungry so needs to be kept in it's own cage, well away from the more essential processing activities. The question to ask here is 'Why have a screen at all?' The answer is that when trying to debug a problem 'in the field' a screen would be really useful - it's not always convenient to be trying to read the serial output on a laptop - especially in bright sunlight.

      Just to keep it simple, for now the A100LK is wired up to the same nano as has the TFT screen - it will be wired to the master nano at a future date.

      Calculating the Filter Parameters

      :

      Using a spread sheet to display math in graphical format is really useful and we don't have to get too bogged down in the actual calculations.

      I've taken the final formula from the above and created a table with voltages calculated according to whatever values of resistance and capacitance are entered. The voltages are then plotted against frequency to see which frequencies are 'cut off' from the arduino input pin.

      The A100LK operates from 0 to 1500 Hz, so any frequencies above 1500 should be removed if possible. In an ideal world, the cut off would be a straight vertical line creating...

      Read more »

    View all 3 project logs

    • 1
      Step 1

      A full schematic for the control panel is available in the 'files' section.

    • 2
      Step 2

      Metal Work

      A heavy steel frame was made for the wind sensors so that the whole system can be bench tested outside over a period of several months to make sure that there are no long term errors lurking in dark corners.

      Eventually the sensors were mounted on a tall pole to get maximum exposure to the elements.

    • 3
      Step 3

      Pole Construction

      After getting some advice from Vector Instruments, who supplied the wind sensors, I realised that these sensors needed to be much higher up in the air and further away from the low lying hedge underneath. With this in mind, the main pole was extended to 20 feet and guy lines were attached to stop the top of the pole moving around in the wind.

      Here's a run down of the main considerations:

      • The pole needs to be taller than the hedge and away from any trees or buildings.
      • The pole must not wobble in the wind or it will give false wind gust readings.
      • The wind vane must be aligned to north.
      • The GPRS antenna must be facing the nearest compatible cell phone mast.
      • The structure must be easy to take down for maintenance.

      The pole itself is composed of three main sections: One stainless 1" section concreted in the ground, another 1" section attached to the first via a cone seated coupling and the third, a 1/2" pipe attached via a standard reducing fitting.

    View all 12 instructions

    Enjoy this project?

    Share

    Discussions

    Similar Projects

    Does this project spark your interest?

    Become a member to follow this project and never miss any updates