 Scott Bragg
My motivations for this project:
- Use the SDR as a piece of test equipment
- Learn more about GNURadio blocks and programming GNURadio in Python
- Learn more about DSP by iteratively improving the application.
- Provide a tutorial for my local SDRSIG
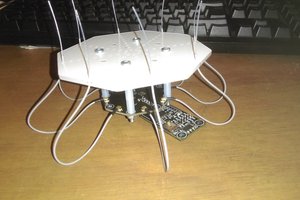
Using an SDR, noise source and SWR bridge to create an antenna and filter analyzer.
Already have an account? Log in.
To make the experience fit your profile, pick a username and tell us what interests you.
My motivations for this project:
I am really glad I decided to use Jupyter notebook to code this. I have learnt quite a bit about DSP and GNURadio blocks and having a notebook to test code, produce plots and write documentation at the same place is just wonderful.
So my latest commit shows the response of a sweep using the probe Avg Mag ^2 but it is very slow at 2 seconds for 10MHz so a full 50-2400MHz sweep would take about 10 minutes.
So time to figure out how to do FFT.
Using a stream to vector I get an 'array' of complex numbers that I can put into a vector sink. This is an ever increasing collection of data that can be looked at, but it doesn't show 'instantaneous' time slice snapshot. So next I put that through an FFT. And since the output of an FFT is also complex, I used a complex to mag block. Then I found the vector probe which is similar to the earlier mag probe I used, and that meant I could get the latest values from the stream to vector or FFT output.
The plot after the FFT was different from the earlier avg-mag plot, so it seems I still need to do some DSP learning.
Wednesday, I got all the parts together and hooked them up to test the bits worked together. I plugged in some whip antenna lying around at the radio club rooms.
I made a quick GNURadio app to show an 8MHz bandwidth waterfall and a slider for the frequency, so I could move the slider and watch the noise attenuate as it scrolled through frequencies the antenna wasn't tuned for. Next step is to automate that process and produce a nice plot of the results.
Started coding my first iteration of the software today to get an idea of how GNURadio flowgraphs and blocks work. My first iteration is just going to use a power meter to sample the center frequency of the tuned SDR. The program would then change the frequency and take another sample in a series of steps and I expect it to be slow but it will also be a proof of concept.
This is because I have not learnt how to take the stream of a single window of samples, eg 1MHz bandwidth from my SDR. That will be the second iteration (don't give me the answer yet!).
I'm reading this ThinkDSP book and just up to the part about leakage and windowing and hamming windows so I think that might be relevant when I sample a section of spectrum a chunk at a time.
 Charlie Smith
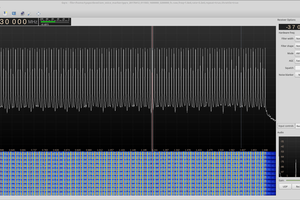
 Ted Yapo
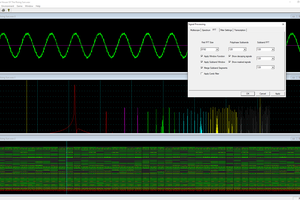
 glgorman
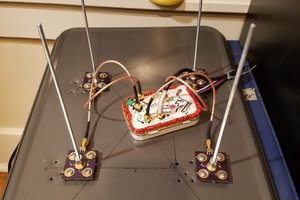
 Martin
when you are using FFT with noise, the magnitude depends on the bandwidth i.e. the bin size. With a carrier signal this is not so.
This is kind of obvious in hindsight, as the energy falling within each bin obviously increases as the bin gets wider. It does mean that you must/should/can normalise your values to Watts/Hz, if it is noise, (but you don't normalise carrier signals that get it there, as they are bin width independent Watts values) (or dBm/Hz and dBm ) This also means that if you have a mixture of noise and carriers, you need to find the carriers, and treat them separately.
Usually spec ans don't do this, and thus don't really give you a meaningful measurement of noise power.