 jeromekelty
Based on my needs I quickly narrowed down my design requirements:
1) It should definitely have wireless capability. I wanted to be able to upload code via WiFi for ease of use but I also wanted to be able to stream data to a laptop when a WiFi connection would not be available.
2) It should be able to log data to a SD card at times when a wireless connection would not be practical.
3) It should be very easy to build using off the shelf components and be easy to use/program.
4) It should be portable (rechargeable battery powered, small and light weight) and weather resistant.
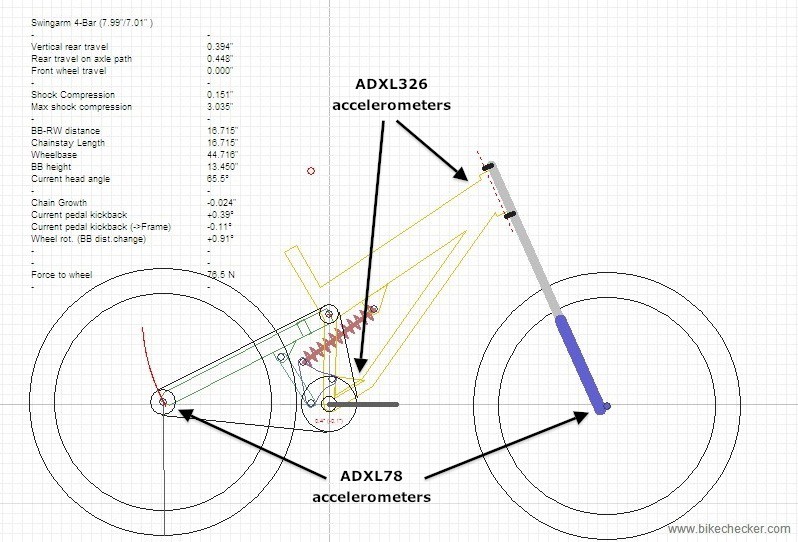
5) I wanted a minimum of six analog channels for monitoring four accelerometers and two linear position sensors for my bike project.
System Design
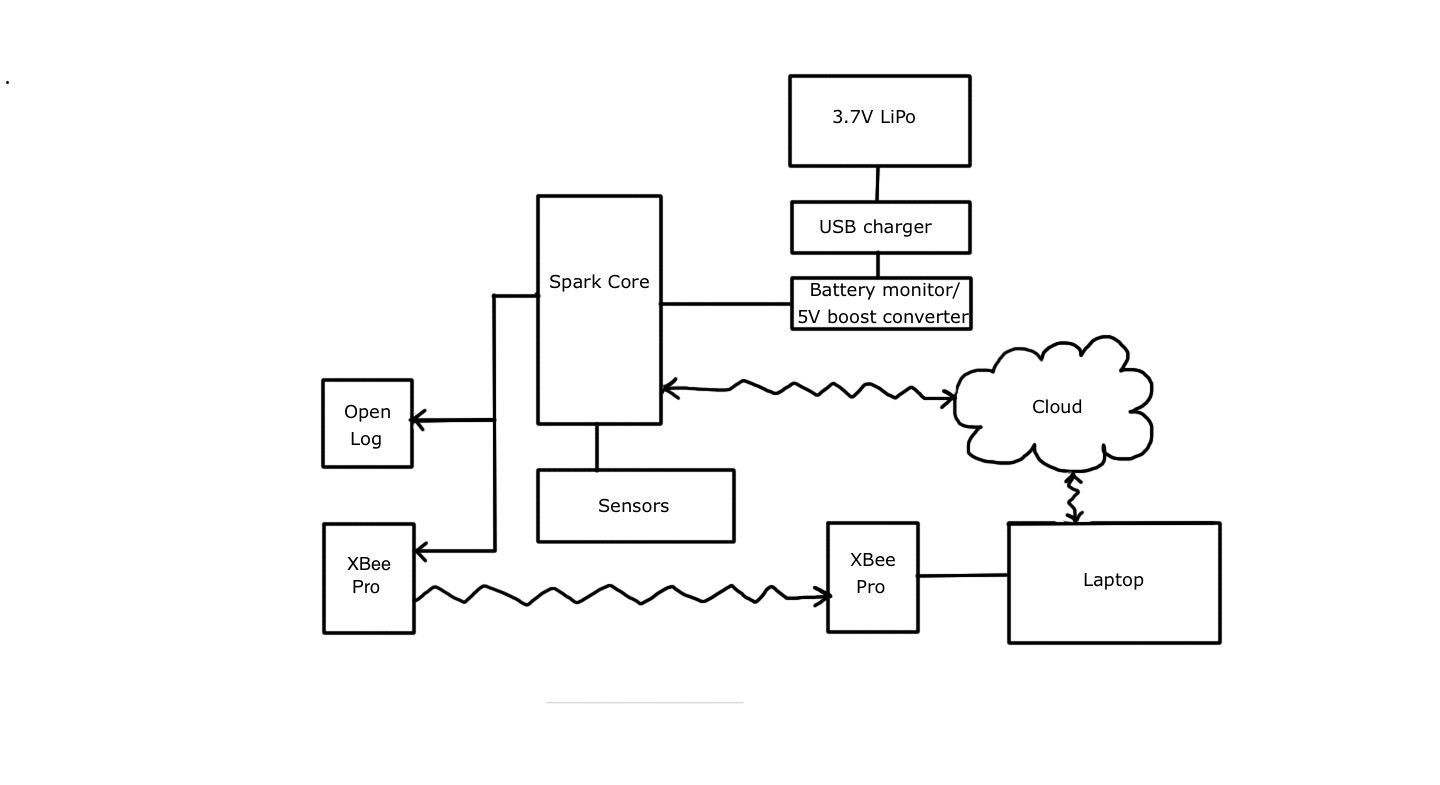
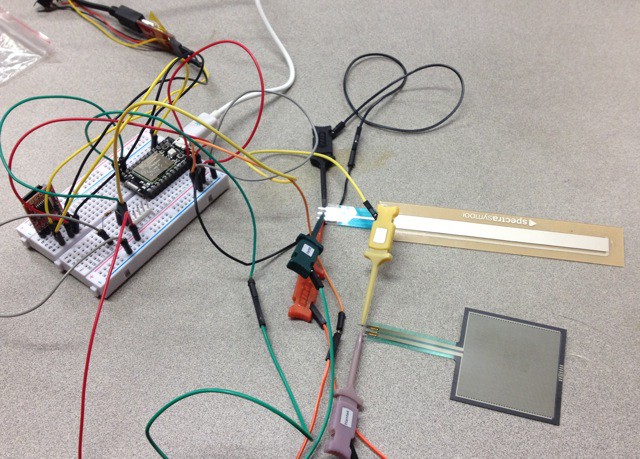
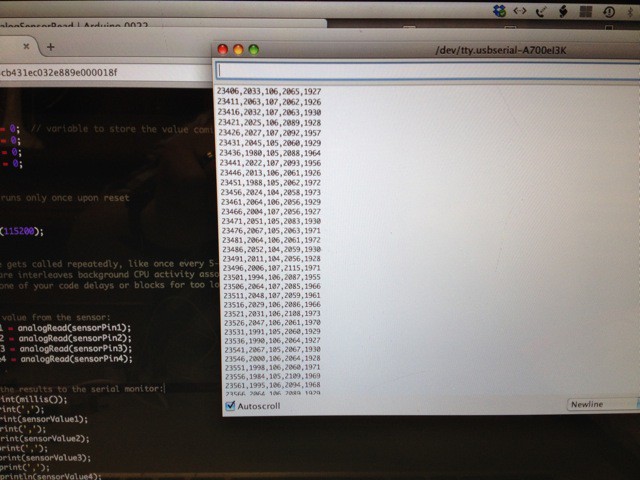
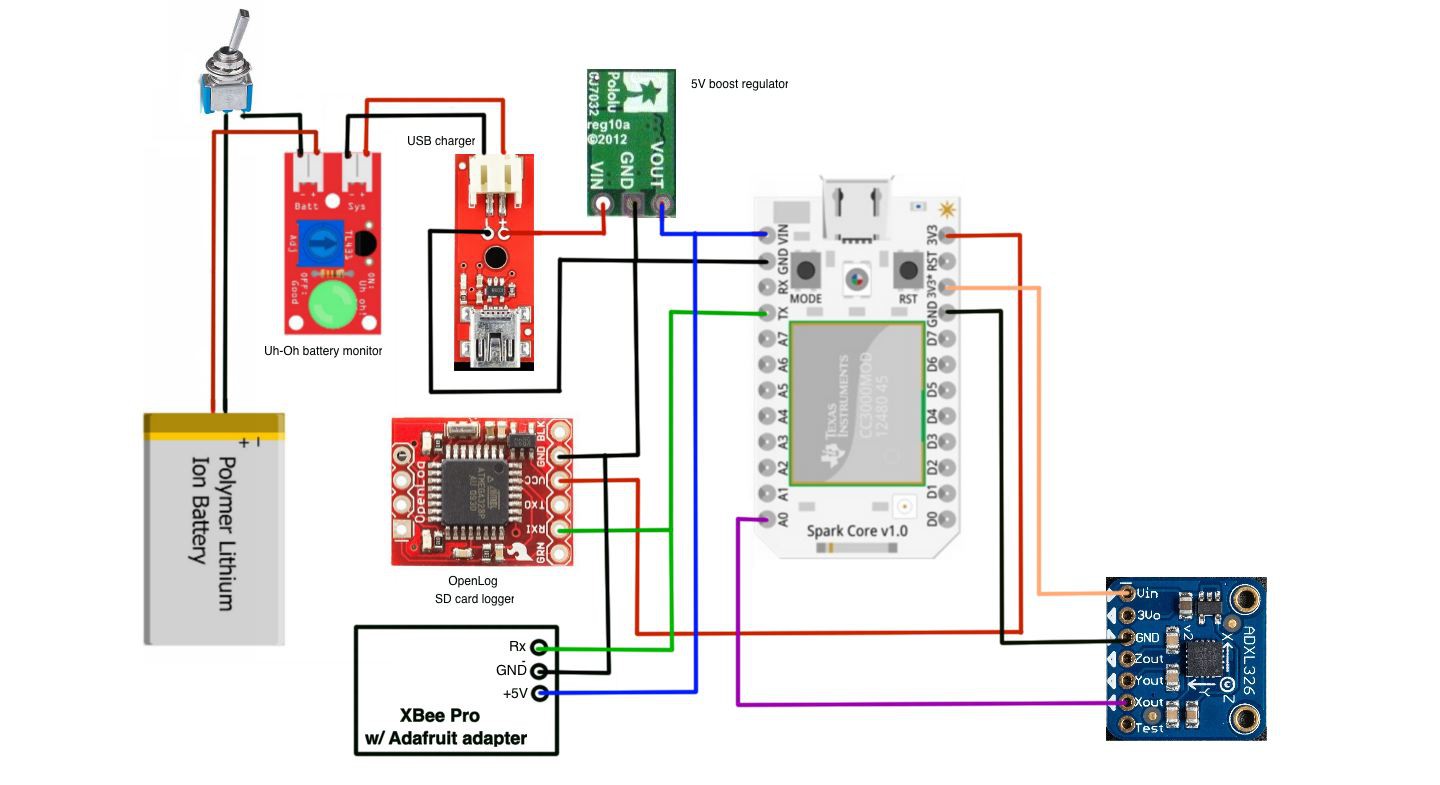
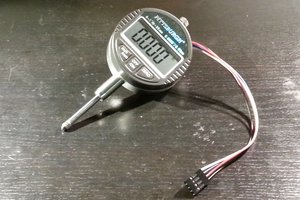
With these requirements in mind I decided to use a Spark Core to read the sensor inputs and then data is logged to a SD card using an OpenLog. The Spark Core takes care of the WiFi requirement and the wireless data transmission is handled by a pair of XBee Pro radios. This way I can wirelessly upload code and send data to the cloud using WiFi or send data directly to a laptop for viewing in a serial monitor or visualize graphically in real time using Processing.
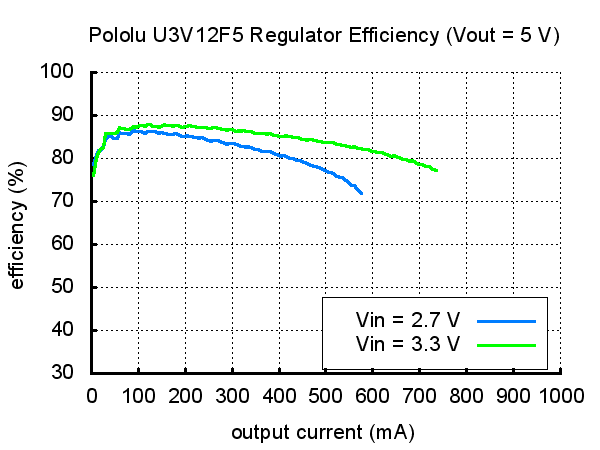
The system is powered by a single cell LiPo battery using a 5V boost converter. There is also a battery monitor circuit as well as a USB charging circuit.
Here's a short video overview of the system-
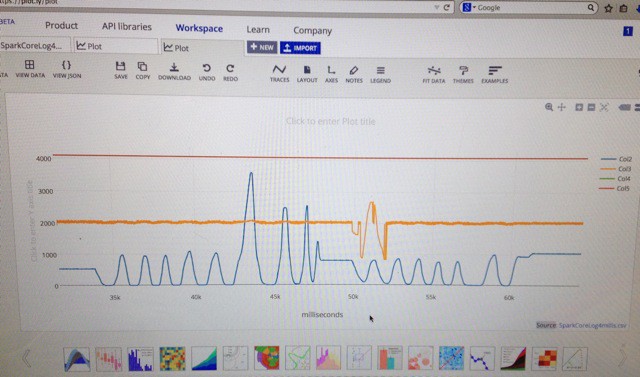
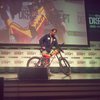
The goal of this project is to be able to generate data that will help me analyze the performance of my own suspension designs as well as testing designs already on the market and allow for a greater understanding of what is actually happening when tuning suspension systems. I know a lot of people on various bicycle forums have been looking for an inexpensive, easy to use tool like this for some time so it will be really neat to see what other people do with it.
The other really interesting bit is all of the other applications for this project.
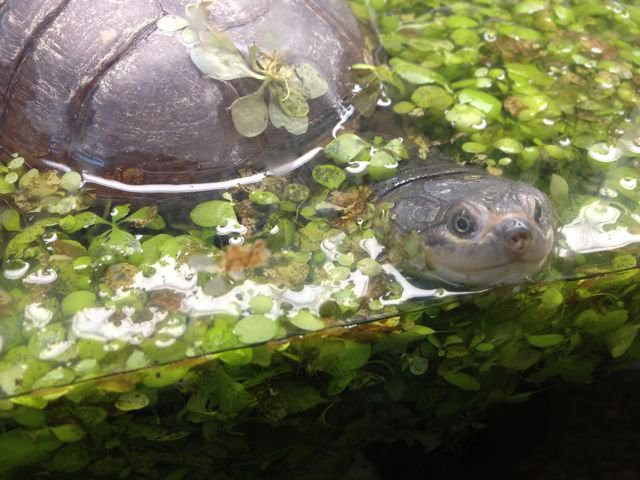
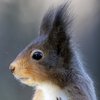
My kids are really interested in science and experimentation so I also view this project as a great way to introduce them to electronics, programming, sensors and scientific testing by gathering data relevant to their interests. We'll be able to use this for all sorts of projects like monitoring weather, garden conditions, school science projects or monitoring our turtle Krebbs (the conditions of his environment- water temp, water pH, how often does he bask and for how long, etc.)
This is going to be fun! Krebbs sure looks like he's excited. :)


 Justin R.
 jan.marcinowski
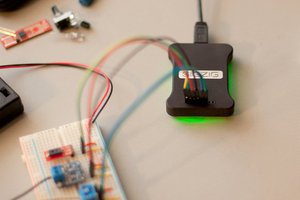
 Sigzig
 minifig404
Just checking it to see if you ever got this project up and working? Very keen on something very similar. Particularly like your choice of using accelerometers.