 Simon Merrett
So after the debacle in the last log where I discovered I have completely connected up the MOSFET wrong in the very first #Yapolamp and by some freak phenomenon it not only works but it works without an inductor, we return to normal viewing.
A couple of logs ago, I showed my first current/illumance graph for the Chanzon yellow LEDs (which produce orange light, if you ask me). I blatantly copied this from #TritiLED 's search for the most efficient way to drive an LED for your coulomb. We opted for the far less rigorous unit of Arbs in #Yapolamp . Today, I went to the next step that #TritiLED did which is, once you know how many Lux you get for each mA, to try and work out the optimum saw tooth peak (initial) current to drive the LED with. This is different to the peak efficiency current because as current decays to zero (imagine the inductor disharging into the LEDs in our driver circuit), it passes through the efficiencies of all the lower currents.
When @Ted Yapo did this properly for #TritiLED , he used octave plots and normalised everything because he knows how to do that and it's good practice - normalised values let you do comparisons etc. As you may have picked up on by now, #Yapolamp differs from it's namesake by being somewhat less rigorous and skilled. I just used Excel. I assumed the same as Ted that my current would step up instantly to peak value and then decay linearly to zero. I used 10 time steps as a proxy for proper integration, worked out the time-step current based on an initial peak value and calculated the Lux/mA at each step. I then took the mean Lux/mA across all time steps for a given peak current and plotted them over my graph from last time.
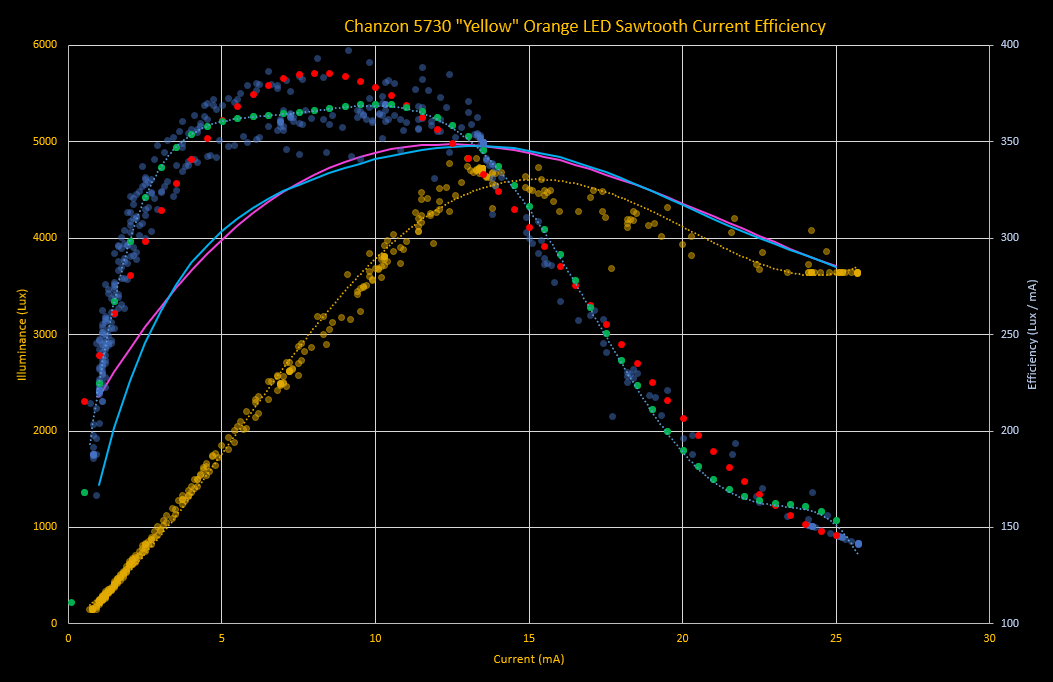
Note that I had trouble finding a good polynomial trend line to my data - those measurements were all over the place, so no wonder Excel had trouble. The ^3 trend line (red dots) looks nice in most places but overshoots a bit around 7mA and at lower values. The ^6 curve (green dots) is better in most places except it goes a bit wrong above 13mA. I decided to plot the optimum sawtooth current curves for both to see how they differ.
The main takeaway is not the comparison between the polynomial trend lines but how the optimum peak currents (pink = ^3 trend line and blue = ^6 trend line) are higher than the most efficient static currents. This was expected, thanks to Ted's work, but it's nice to see the curves superimposed for contrast.
My conclusion is that for our 60mA-rated LEDs we're looking at a peak sawtooth current of around 12-14mA. I seem to recall Ted forming a rule of thumb from his observations that about 20-25% of rated current was where we'd expect to find peak efficiency. I just can't remember whether that was static current or sawtooth peak current!
Now I have a design current to take into SPICE and this time, who knows, maybe we'll design something with the parts connected the right way around.
Discussions
Become a Hackaday.io Member
Create an account to leave a comment. Already have an account? Log In.