Something useful for my robot to do: Having troubles with the Wi-Fi at my parents house I decided to create a heatmap of the W-Lan signal strength with the inspiration of this ROSCon 2018 talk. Since I did not understand QGIS in a few minutes and because my use case was rather limited I created the map based on OpenLayers instead. An example can be seen in the following image created for my small place:
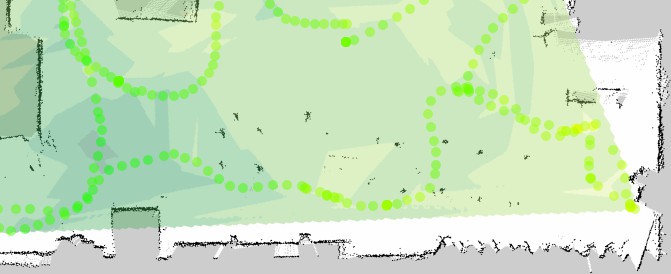
Given an already created floor plan with SLAM I drove my robot around and took a measurement of the Wi-Fi signal strength every 0.5 second. The signal strength ranges from green (very good) to red (very poor). Since I do not have any problems with my Wi-Fi all dots are more or less green for my place. From these discrete measurements a contour plot is generated. In this contour plot it can be easily seen that the access point is in the lower left corner (darkest green).
The steps to reproduce are the following:
1. Drive around the apartment and take a measurement twice a second. The measurements are saved in a JSON file. This is done with the following quick & dirty python script:
#!/usr/bin/env python
# -*- coding: iso-8859-15 -*-

import os
import re
import rospy
import tf
import tf2_ros
from time import sleep

rospy.init_node('wifi_strength')

tfBuffer = tf2_ros.Buffer()
listener = tf2_ros.TransformListener(tfBuffer)
regex_lq = re.compile("Link Quality=(\d*)/(\d*)")
while not rospy.is_shutdown():
    f = os.popen("export LANG=C; /sbin/iwconfig wlan0")
    for line in f:
        line = line.strip()
        match_lq = regex_lq.match(line)
        if match_lq is not None:
            lq = float(match_lq.group(1)) / float(match_lq.group(2))
            pos = tfBuffer.lookup_transform("map", 'base_link', rospy.Time(0), rospy.Duration(1.0))
            print '{"x":%.2f, "y":%.2f, "link":%.2f},' % (pos.transform.translation.x, pos.transform.translation.y, lq)
            sleep(0.5)
The python script does the following
- Retrieve the current position with ros/tf
- Read the signal strength of the connected access point with a regular expression from iwconfig (value: Link Quality)
- Append position (x,y) and Link Quality to a JSON array, example:
[
{"x":0.32, "y":-0.15, "link":0.69},
{"x":0.34, "y":-0.12, "link":0.73},
{"x":0.38, "y":-0.05, "link":0.74}
]
2. Generate a heatmap with matplotlib contourf
The data is first interpolated from the measurements with 300 steps in each direction from minimum to maximum with linspace and griddata, the heatmap is generated with contourf. The size of 10x10 meter easily covers my whole apartment.
#!/usr/bin/env python
# -*- coding: iso-8859-15 -*-

import json
import matplotlib.pyplot as plt
import numpy as np
from scipy.interpolate import griddata

# settings
size = (10, 10) # meter x meter
contour_steps = 300
resolution= 0.025 # m/px

# ----------

lx = []
ly = []
llink = []
dpi=100.0/(resolution*100)*2.54 # scale 100dpi to our resolution in m/px
with open("wifi_strength.json", "r") as read_file:
    data = json.load(read_file)
    for line in data:
        lx.append(line['x'])
        ly.append(line['y'])
        llink.append(line['link'])

    # for a square image both sizes must be equal
    minimum = min(lx) if min(lx) < min(ly) else min(ly)
    maximum = max(lx) if max(lx) > max(ly) else max(ly)
    if abs(minimum) > abs(maximum):
        maximum = -abs(minimum)
    else:
        minimum = -abs(maximum)

    # figure without margin
    fig=plt.figure(num=None, figsize=size, dpi=dpi)
    ax=fig.add_axes((0,0,1,1))
    ax.set_axis_off()
    ax.set_xlim(-size[0]/2, size[0]/2)
    ax.set_ylim(-size[1]/2, size[1]/2)

    # map generation
    xi = np.linspace(minimum, maximum, contour_steps);
    yi = np.linspace(minimum, maximum, contour_steps);
    zi = griddata((lx, ly), llink, (xi[None,:], yi[:,None]), method='linear')
    ax.contourf(xi, yi, zi, cmap="RdYlGn", vmin=0, vmax=1)

    plt.savefig('heatmap.png', transparent=True)
One of the trickiest parts of the generation with matplotlib was to remove the margins from the figure...
3. Display everything in the browser with OpenLayers
The required libraries are read from a CDN (again: Quick & Dirty). The size, resolution and origin od the floor plan are read from the corresponding yaml file:
<!doctype html>
<html lang="en">
    <head>
        <meta name="viewport" content="initial-scale=1.0, user-scalable=no, width=device-width">
        <meta http-equiv="Cache-Control" content="no-cache, no-store, must-revalidate"/>
        <meta http-equiv="Pragma" content="no-cache"/>
        <meta http-equiv="Expires" content="0"/>
        <link rel="stylesheet" href="https://stackpath.bootstrapcdn.com/bootstrap/4.1.3/css/bootstrap.min.css" integrity="sha384-MCw98/SFnGE8fJT3GXwEOngsV7Zt27NXFoaoApmYm81iuXoPkFOJwJ8ERdknLPMO" crossorigin="anonymous">
        <link rel="stylesheet" href="https://cdn.rawgit.com/openlayers/openlayers.github.io/master/en/v5.2.0/css/ol.css" type="text/css">
        <link rel="stylesheet" href="https://cdn.jsdelivr.net/npm/ol-layerswitcher@3.1.0/src/ol-layerswitcher.css" type="text/css">
        <style>
        .map {
            height: 100%;
            width: 100%;
        }
        .marker {
            width: 10px;
            height: 10px;
            border: 0px solid #ffffff;
            border-radius: 5px;
            opacity: 0.5;
        }
        </style>
        <script src="https://code.jquery.com/jquery-3.3.1.min.js" integrity="sha256-FgpCb/KJQlLNfOu91ta32o/NMZxltwRo8QtmkMRdAu8=" crossorigin="anonymous"></script>
        <script src="https://cdnjs.cloudflare.com/ajax/libs/popper.js/1.14.3/umd/popper.min.js" integrity="sha384-ZMP7rVo3mIykV+2+9J3UJ46jBk0WLaUAdn689aCwoqbBJiSnjAK/l8WvCWPIPm49" crossorigin="anonymous"></script>
        <script src="https://stackpath.bootstrapcdn.com/bootstrap/4.1.3/js/bootstrap.min.js" integrity="sha384-ChfqqxuZUCnJSK3+MXmPNIyE6ZbWh2IMqE241rYiqJxyMiZ6OW/JmZQ5stwEULTy" crossorigin="anonymous"></script>
        <script src="https://cdn.rawgit.com/openlayers/openlayers.github.io/master/en/v5.2.0/build/ol.js" crossorigin="anonymous"></script>
        <script src="https://cdn.jsdelivr.net/npm/ol-layerswitcher@3.1.0/dist/ol-layerswitcher.min.js" crossorigin="anonymous"></script>
        <title>Wifi Heatmap</title>
    </head>
    <body>
        <div id="map" class="map"></div>
        <script type="text/javascript">
$(function () {
    $('[data-toggle="popover"]').popover()
    $('[data-toggle="tooltip"]').tooltip()
})

// SLAM generated floor plan, values from its .yaml
var imgUrl = 'map.png';
var imgSize = [992, 2080];
var imgResolution = 0.010000;
var imgOrigin = [-5.000000, -5.000000, 0.000000];

function meterToPixel(m) {
    return m/imgResolution;
}

// Map views always need a projection.  Here we just want to map image
// coordinates directly to map coordinates, so we create a projection that uses
// the image extent in pixels.
var origin = [meterToPixel(imgOrigin[0]), meterToPixel(imgOrigin[1])];
var extent = [origin[0], origin[1], imgSize[0]-Math.abs(origin[0]), imgSize[1]-Math.abs(origin[1])];
var projection = new ol.proj.Projection({
    units: 'pixels',
    extent: extent,
    metersPerUnit: imgResolution
});

$.ajax({
    url: "wifi_strength.json", // the measurements
    dataType: 'json',
    async: false,
    success: function(json) {
        wifi_strength = json;
    }
});

map = new ol.Map({
    interactions: ol.interaction.defaults().extend([
        new ol.interaction.DragRotateAndZoom()
        ]),
    layers: [
        new ol.layer.Image({
            source: new ol.source.ImageStatic({
                url: imgUrl,
                imageExtent: extent
            })
        }),
        new ol.layer.Image({
                        title: 'Heatmap',
            source: new ol.source.ImageStatic({
                url: "heatmap.png",
                imageExtent: [-508, -508, 508, 508]
            }),
            opacity: 0.4
        }),
    ],
    target: 'map',
    view: new ol.View({
        projection: projection,
        center: [0, 200],
        rotation: -123 * Math.PI / 180, // horizontal alignment of the floor plan
        zoom: 3,
        maxZoom: 8
    })
});
map.addControl(new ol.control.LayerSwitcher());

// Javascript color scale from 0% to 100%, rendering it from red to yellow to green
// https://gist.github.com/mlocati/7210513
function perc2color(perc) {
    var r, g, b = 0;
    if(perc < 50) {
        r = 255;
        g = Math.round(5.1 * perc);
    }
    else {
        g = 255;
        r = Math.round(510 - 5.10 * perc);
    }
    var h = r * 0x10000 + g * 0x100 + b * 0x1;
    return '#' + ('000000' + h.toString(16)).slice(-6);
}

function addMarker(map, pos, data) {
    var color = perc2color(data * 100);
    element = document.createElement("div");
    element.setAttribute("class", "marker");
    element.setAttribute("data-toggle", "tooltip");
    element.setAttribute("data-placement", "top");
    element.setAttribute("title", data);
    element.setAttribute("style", "background-color: "+color+";");
    var marker = new ol.Overlay({
        position: [meterToPixel(pos[0]), meterToPixel(pos[1])],
        positioning: 'center-center',
        element: element,
          });
    map.addOverlay(marker);
}

wifi_strength.forEach(function(val) {
    addMarker(map, [val.x, val.y], val.link);
});
        </script>
    </body>
</html>
Discussions
Become a Hackaday.io Member
Create an account to leave a comment. Already have an account? Log In.