Bruce Land
(1) Repressilator.
The model is derived from the gene circuit in the paper:
A synthetic oscillatory network of transcriptional regulators
Michael B. Elowitz and Stanislas Leibler
Nature 403, 335-338(20 January 2000)
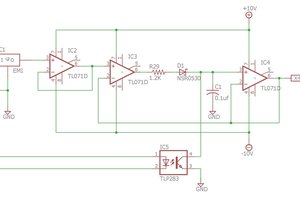
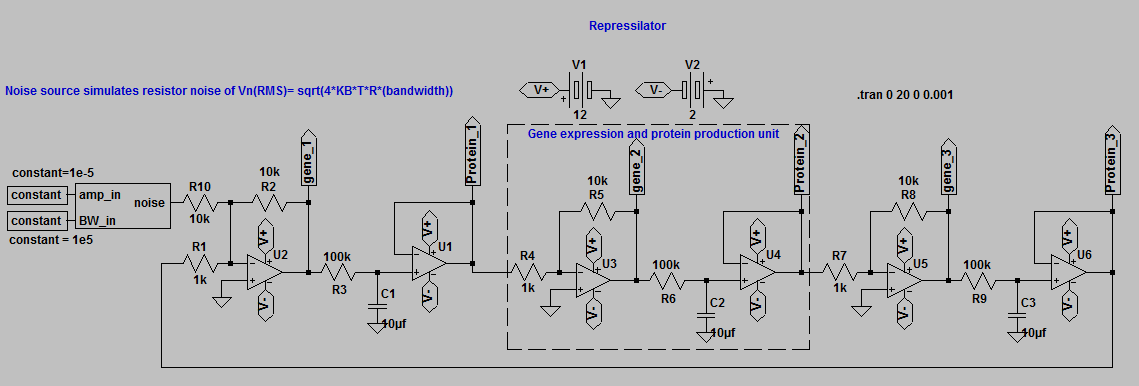
Relationship of opamp to gene function:
The three genes of the repressilator are turned off quickly as protein concentration rises. This can be modeled by an inverting opamp with high gain. The opamp input is a voltage corresponding to protein concentration, the output is the gene activity. An LED on this opamp output shows gene activity.
The protein concentration from an active gene accumulates slowly like the charge (and therefore voltage) on a RC leaky integrator. The capacitor voltage is buffered by a unity gain amplifier and becomes the input to the next gene.
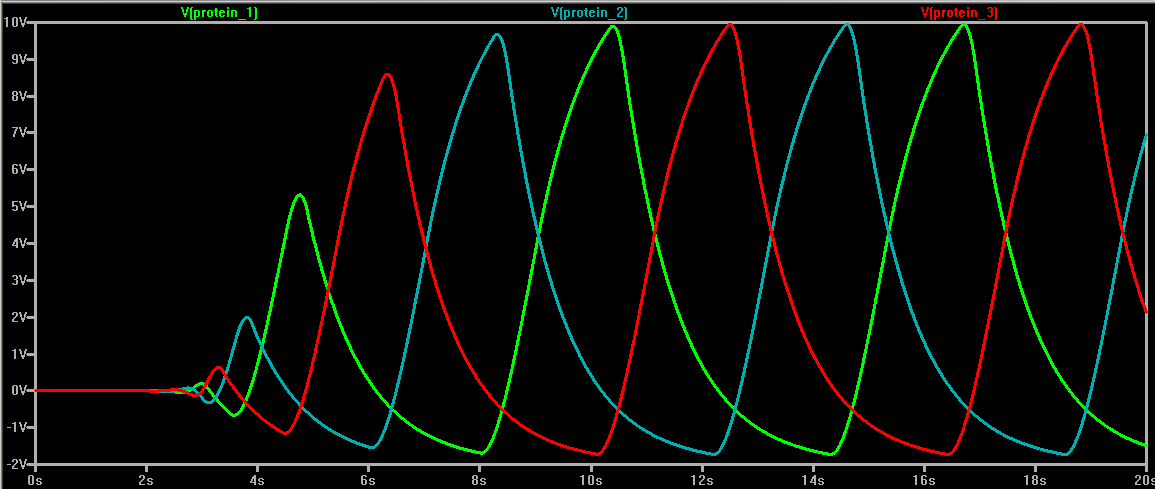
Simulated output from the repressilator circuit.
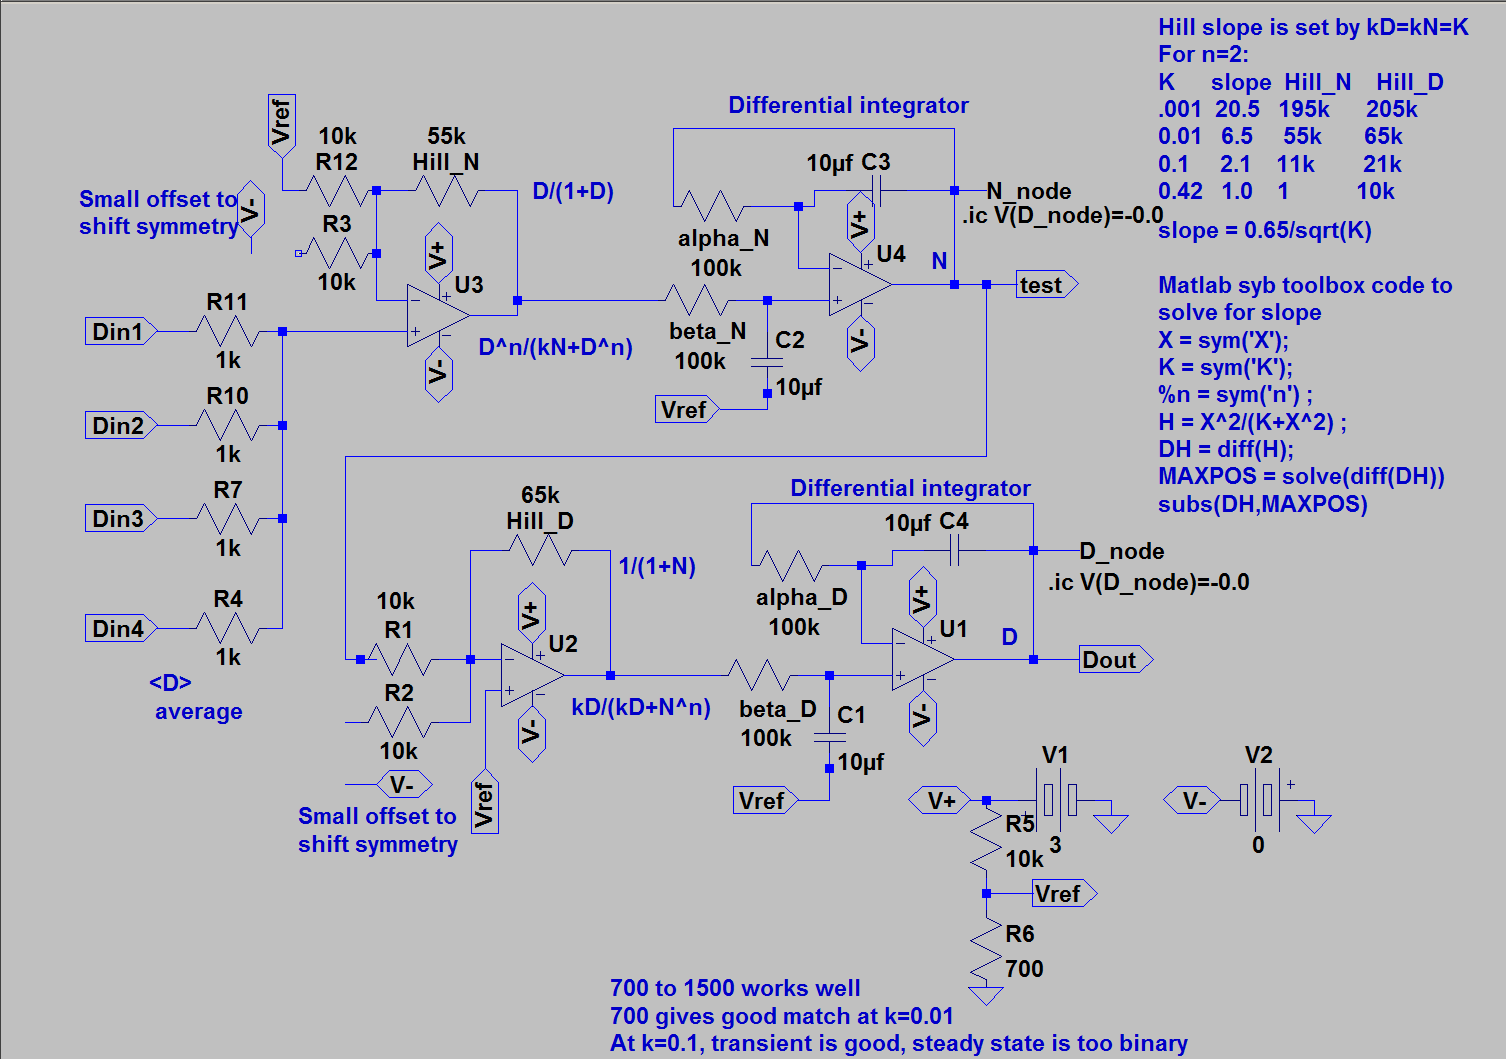
(2) Delta-Notch lateral inhibition system
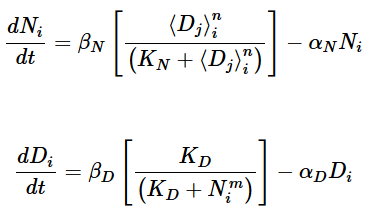
This circuit represents the biological signalling in one cell, corresponding the equations below.
The equations are taken from Conf Proc IEEE Eng Med Biol Soc. 2014 Aug; 2014: 86–89.
A Bio-Inspired Spatial Patterning Circuit by Kai-Yuan Chen,
Danial J. Joe, James B. Shealy, Bruce R. Land, and Xiling Shen
The nonlinear Hill term (ratio of powers of concentration) is modeled by the setting the gain of the opamp according to the table in the upper-right corner of the circuit diagram to determine K,m,n in the equation. the saturating output of the opamp is explicitly used to get the sigmoid shape of the term.
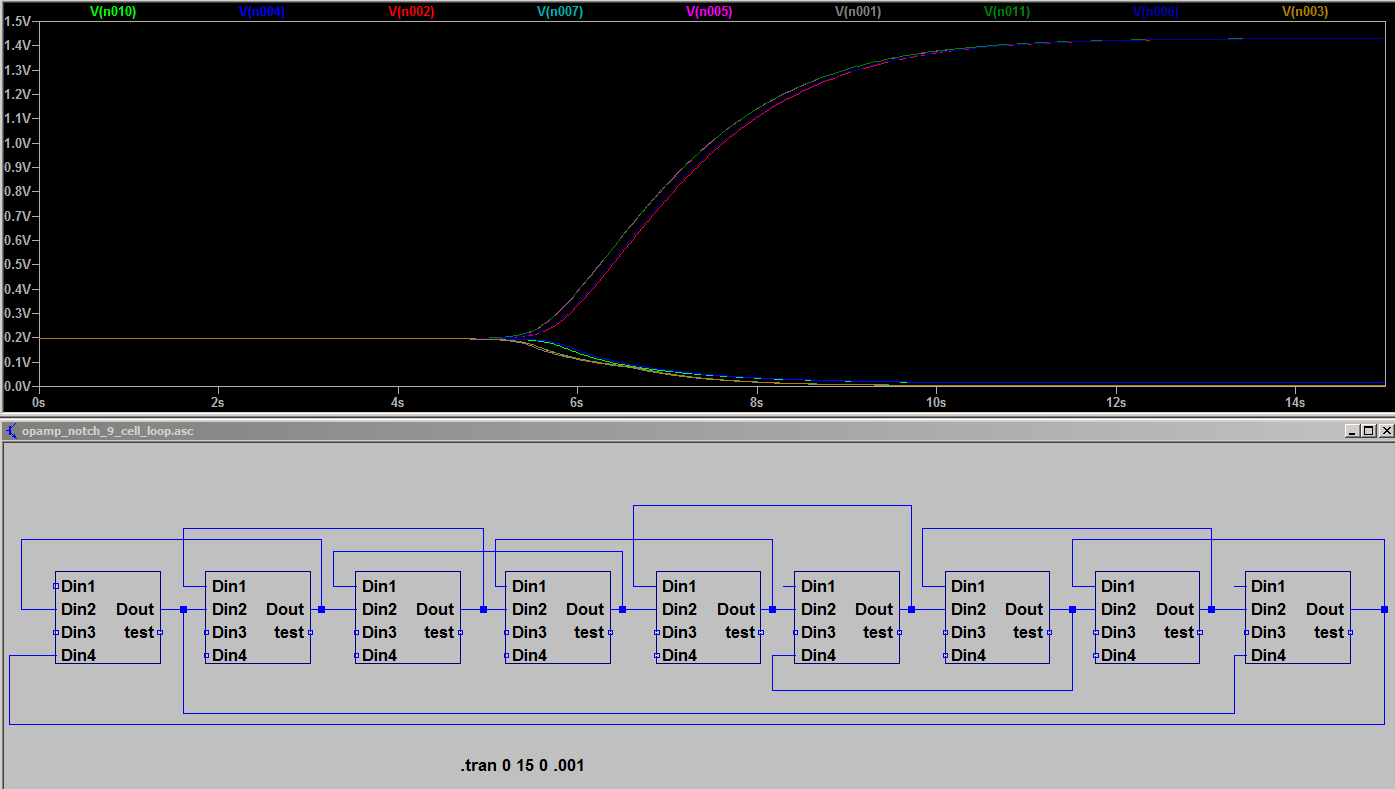
To use this model of one cell, you need to link together several cells according to their geometry. Several near neighbors Dout signal can be routed into the averager inputs of this cell model.
The example below shows a model of 9 simulated cells linked in a ring. The concentrations at Dout for each cell quickly bifurcate into spatially alternating high/low values.
 CheeenNPP
 Discrete Electronics Guy
 Burkhard Kainka