 JBL test for pH, NO3 and NO2
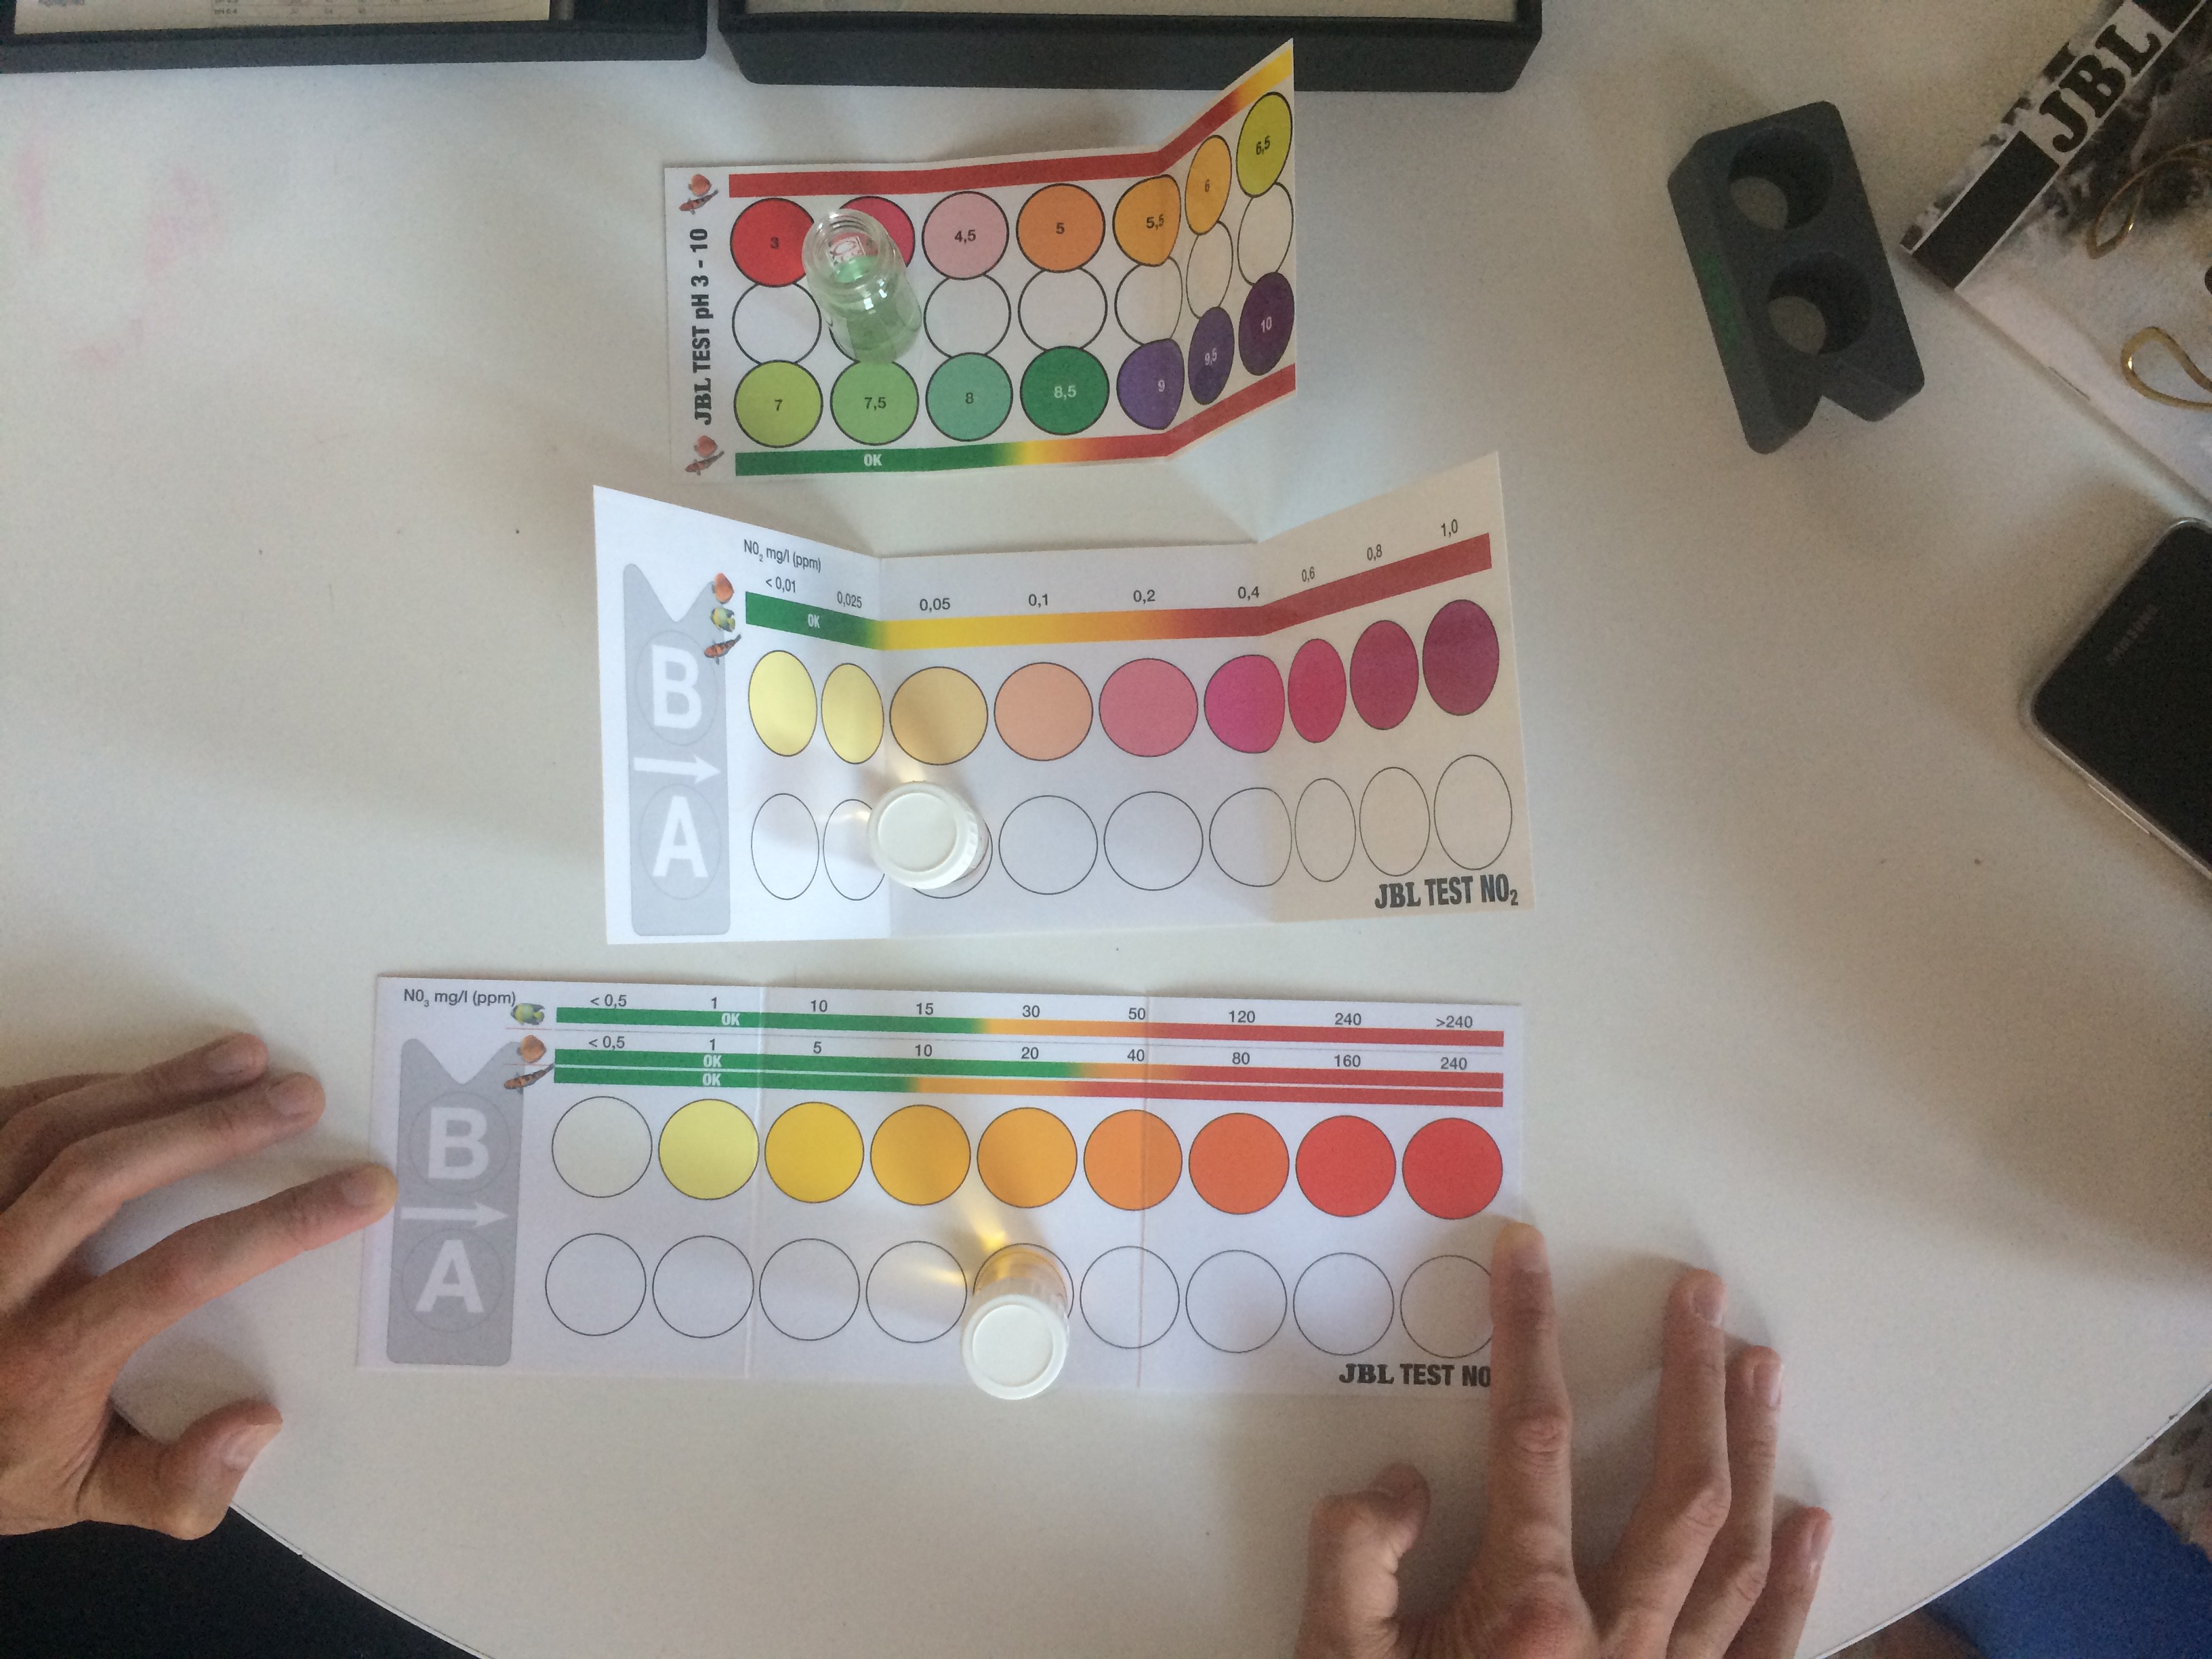
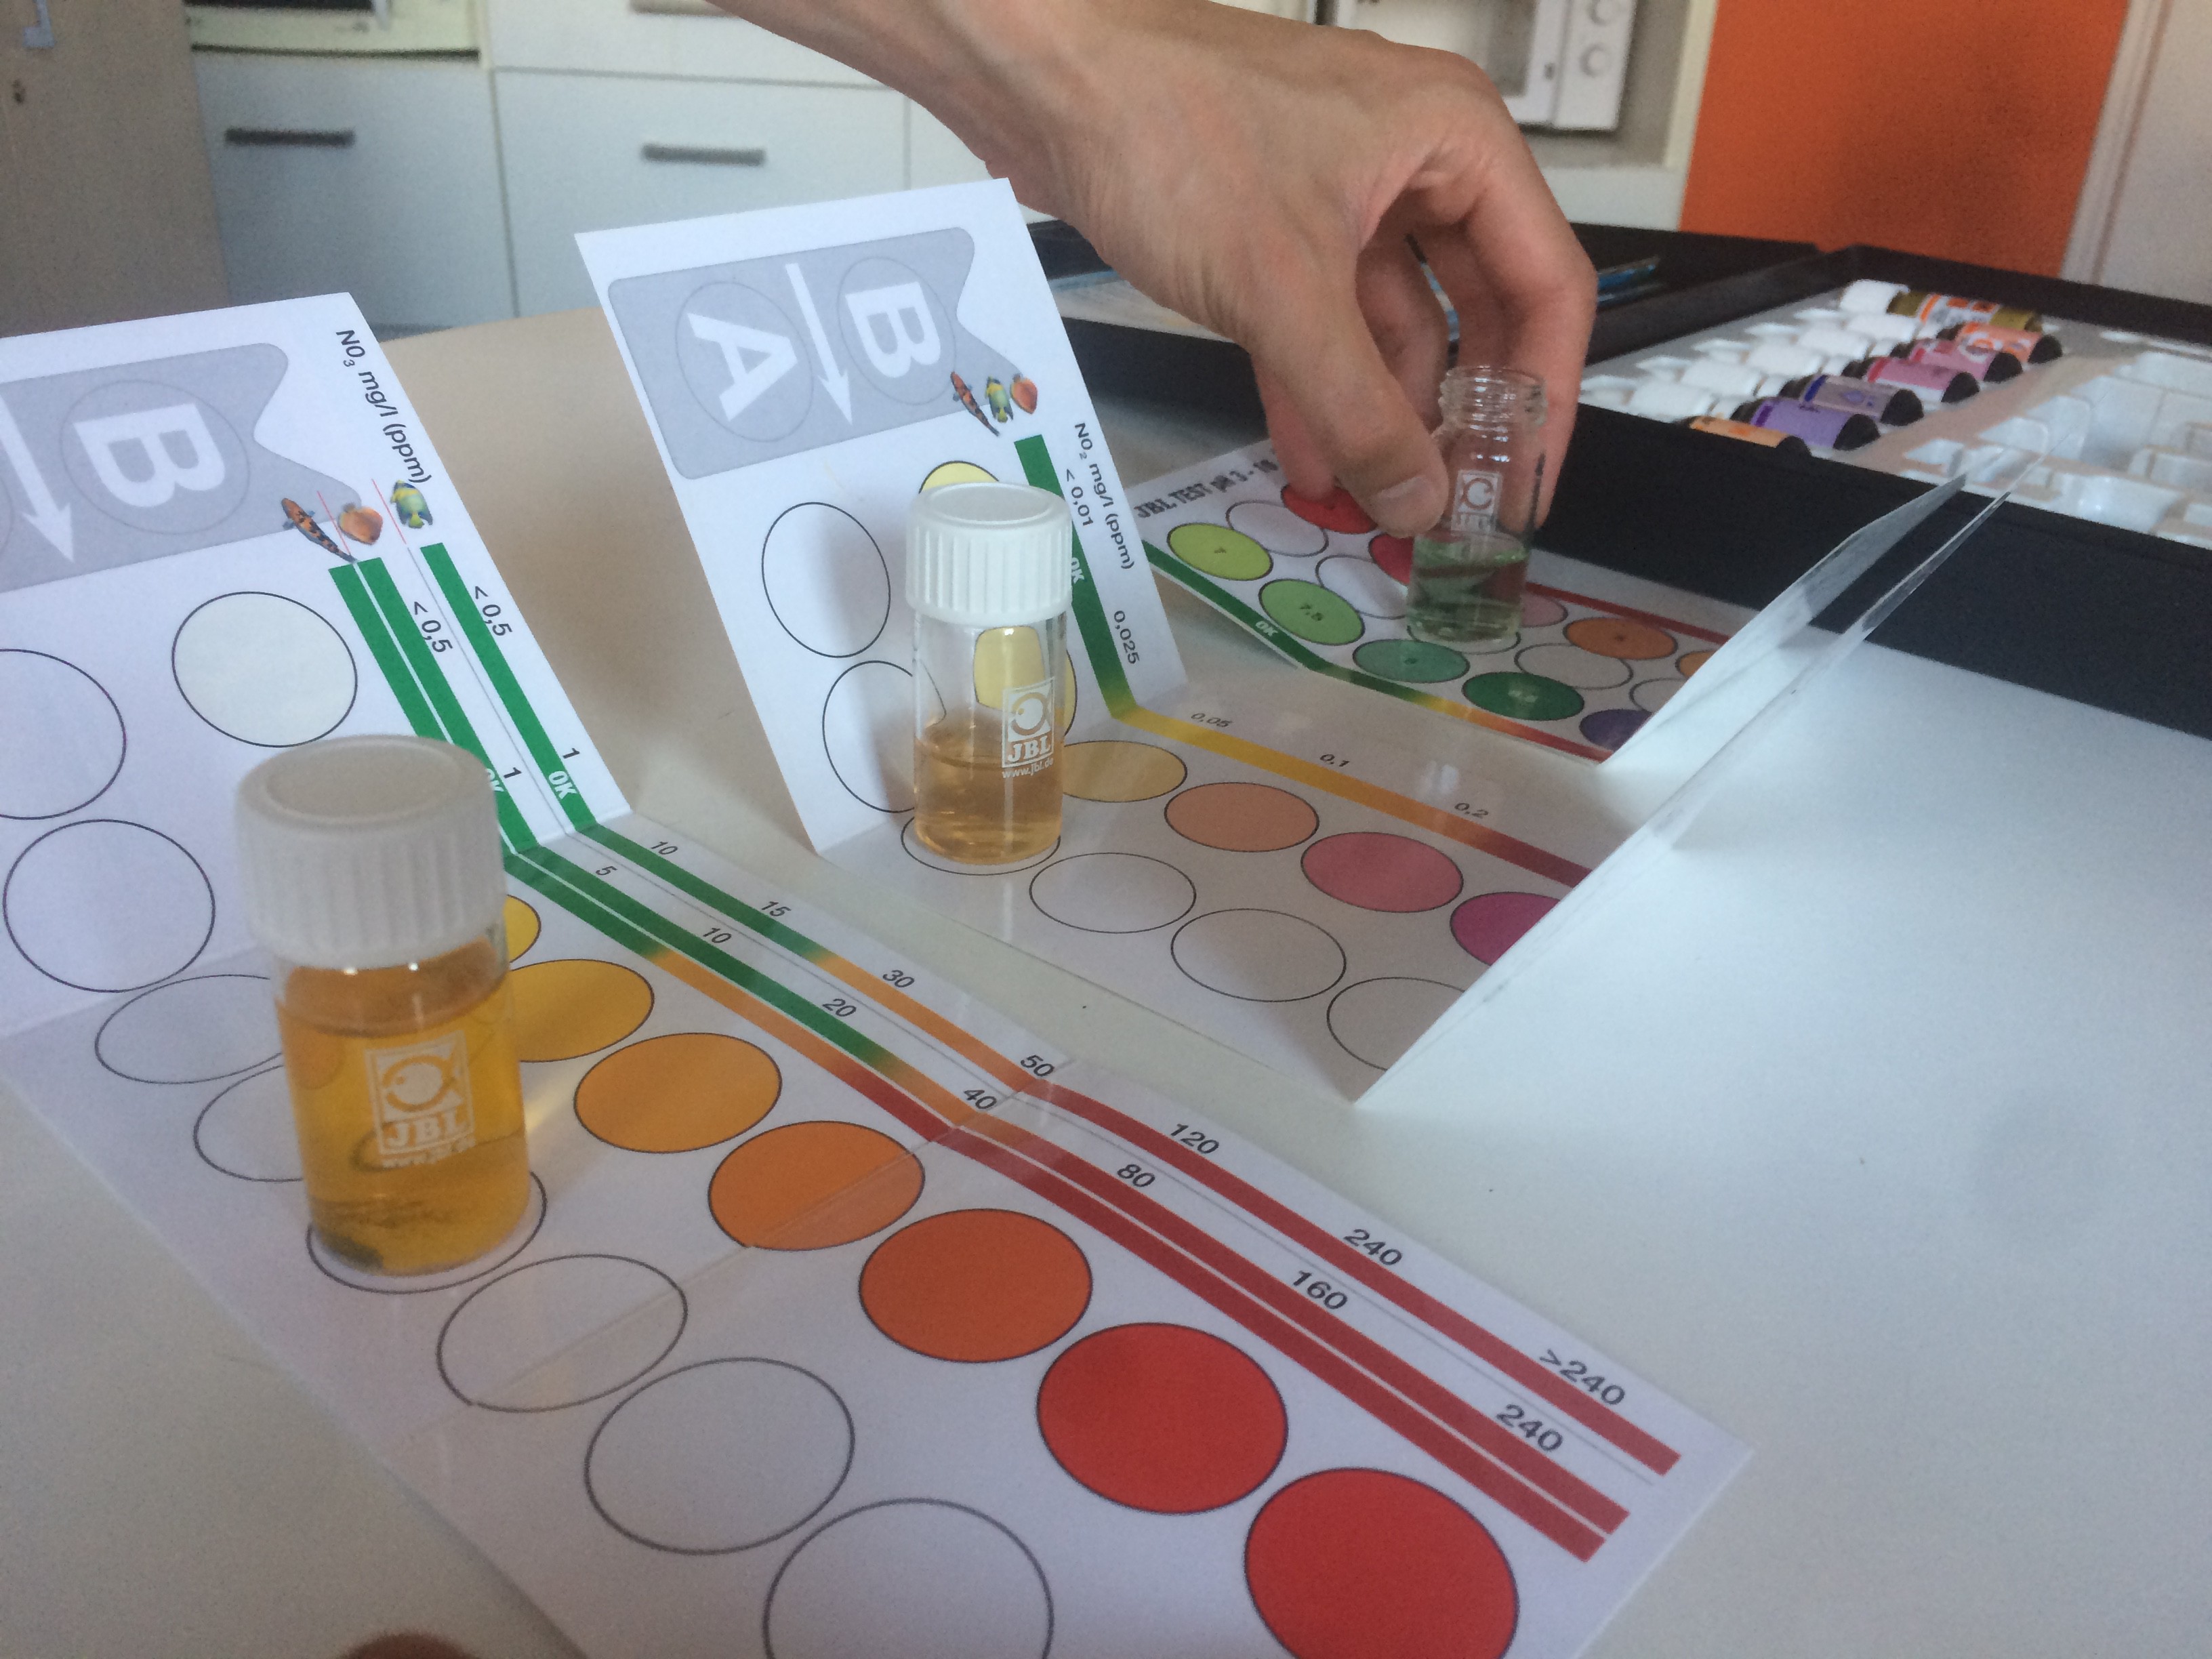
According to our research, there are no accessible and simple devices that can measure water quality and identify the pollution level in water accurately. After testing pH, NO2 and NO3 with the chemical test from JBL (which can be easily purchased on Amazon) we found out that it's possible to identify the presence of these substances, but the level of concentration is only determined by the water color and its correspondence to the colors on the given JBL value scale. In this way, from a chemical point of view it is very hard to determine the precise concentration of specific substances in the water.
Having this limitation in mind, in the next step we brainstormed on creative ways of visualizing air and water pollution data.
We visited the farm in Normandy and did a water test workshop with the children.
Some of the ideas that arose through the brainstorming were: visualizing data through visual mapping, creating kinetic origamis moving in real-time according to the measured pollution index, and lastly, an air and water pollution indicating device aimed for the public space in Paris (i.e. bus stops, metro entrances, public squares).
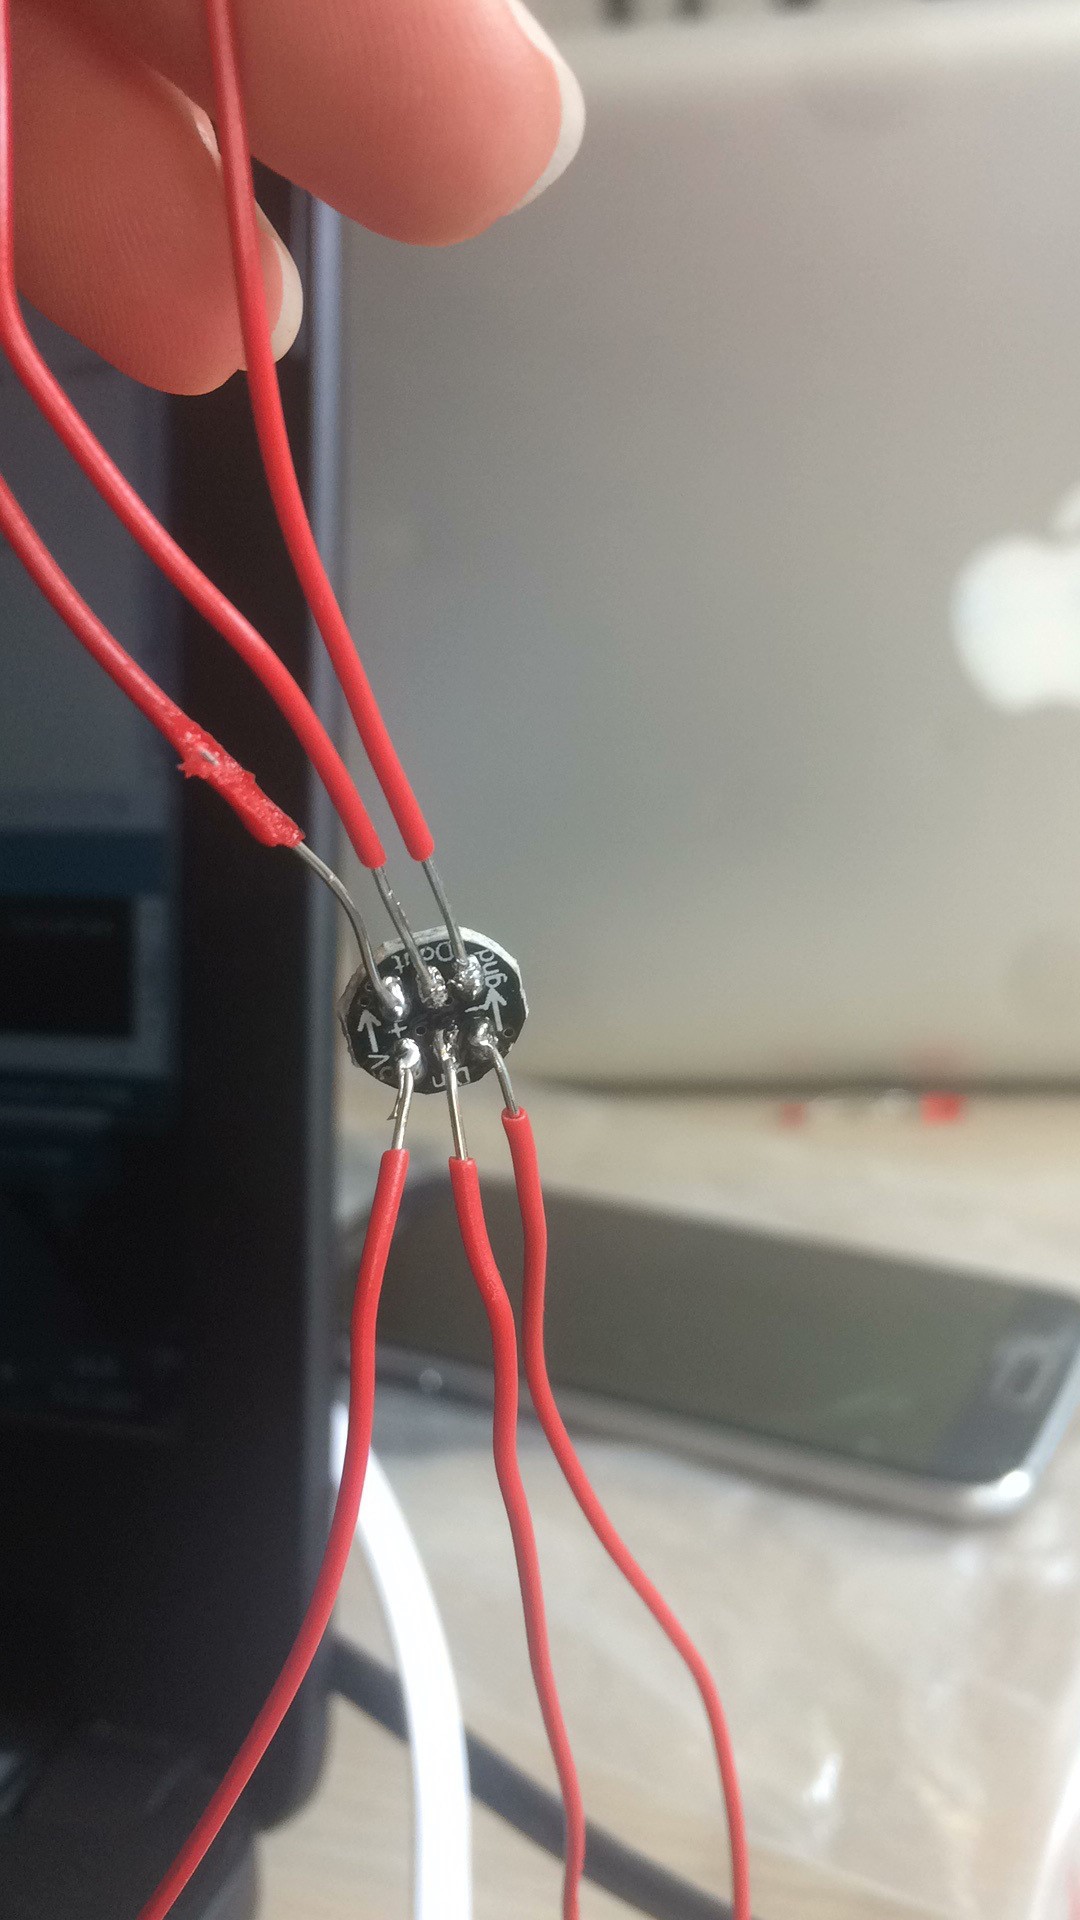
We imagined this device having Neopixel RGB LEDs, that would be programmed with an Arduino and change colors according to the data on air and water pollution.
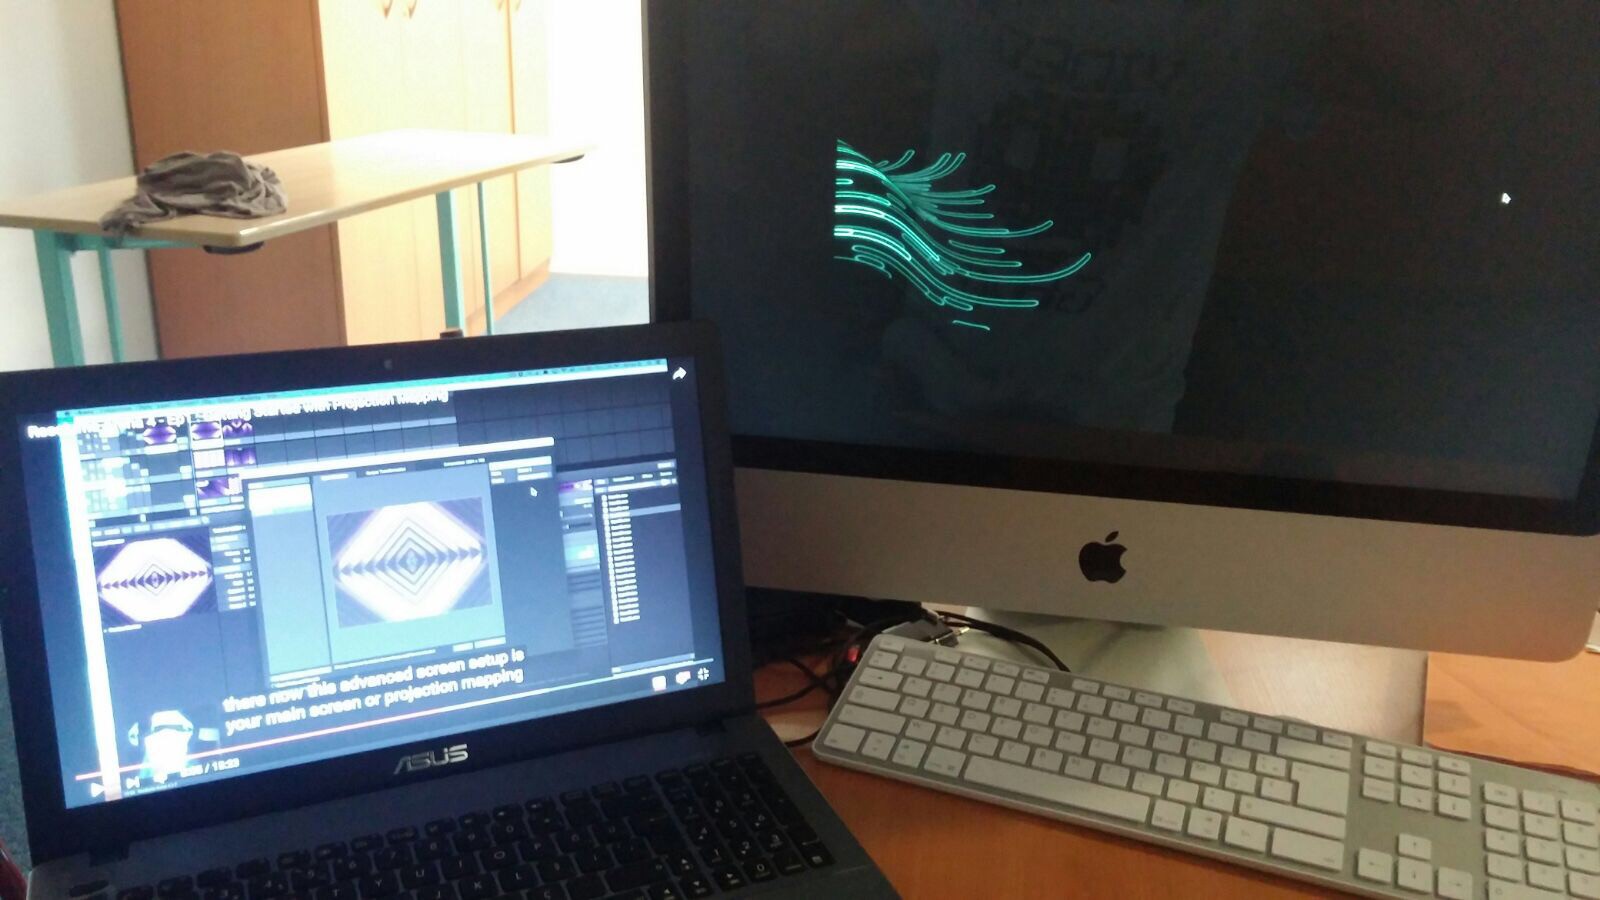
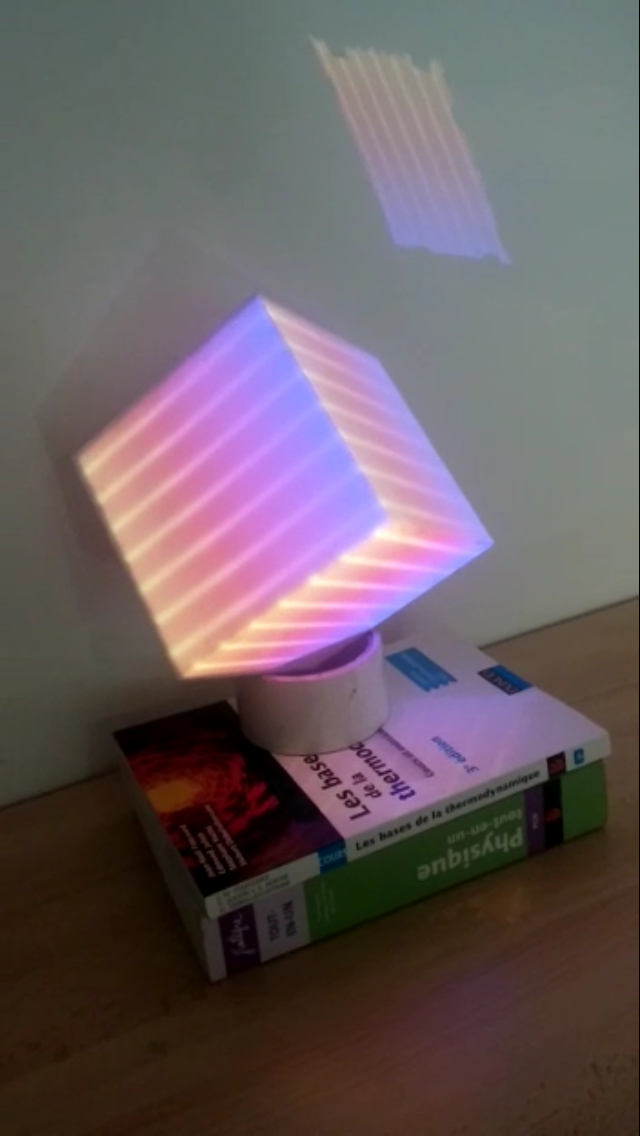
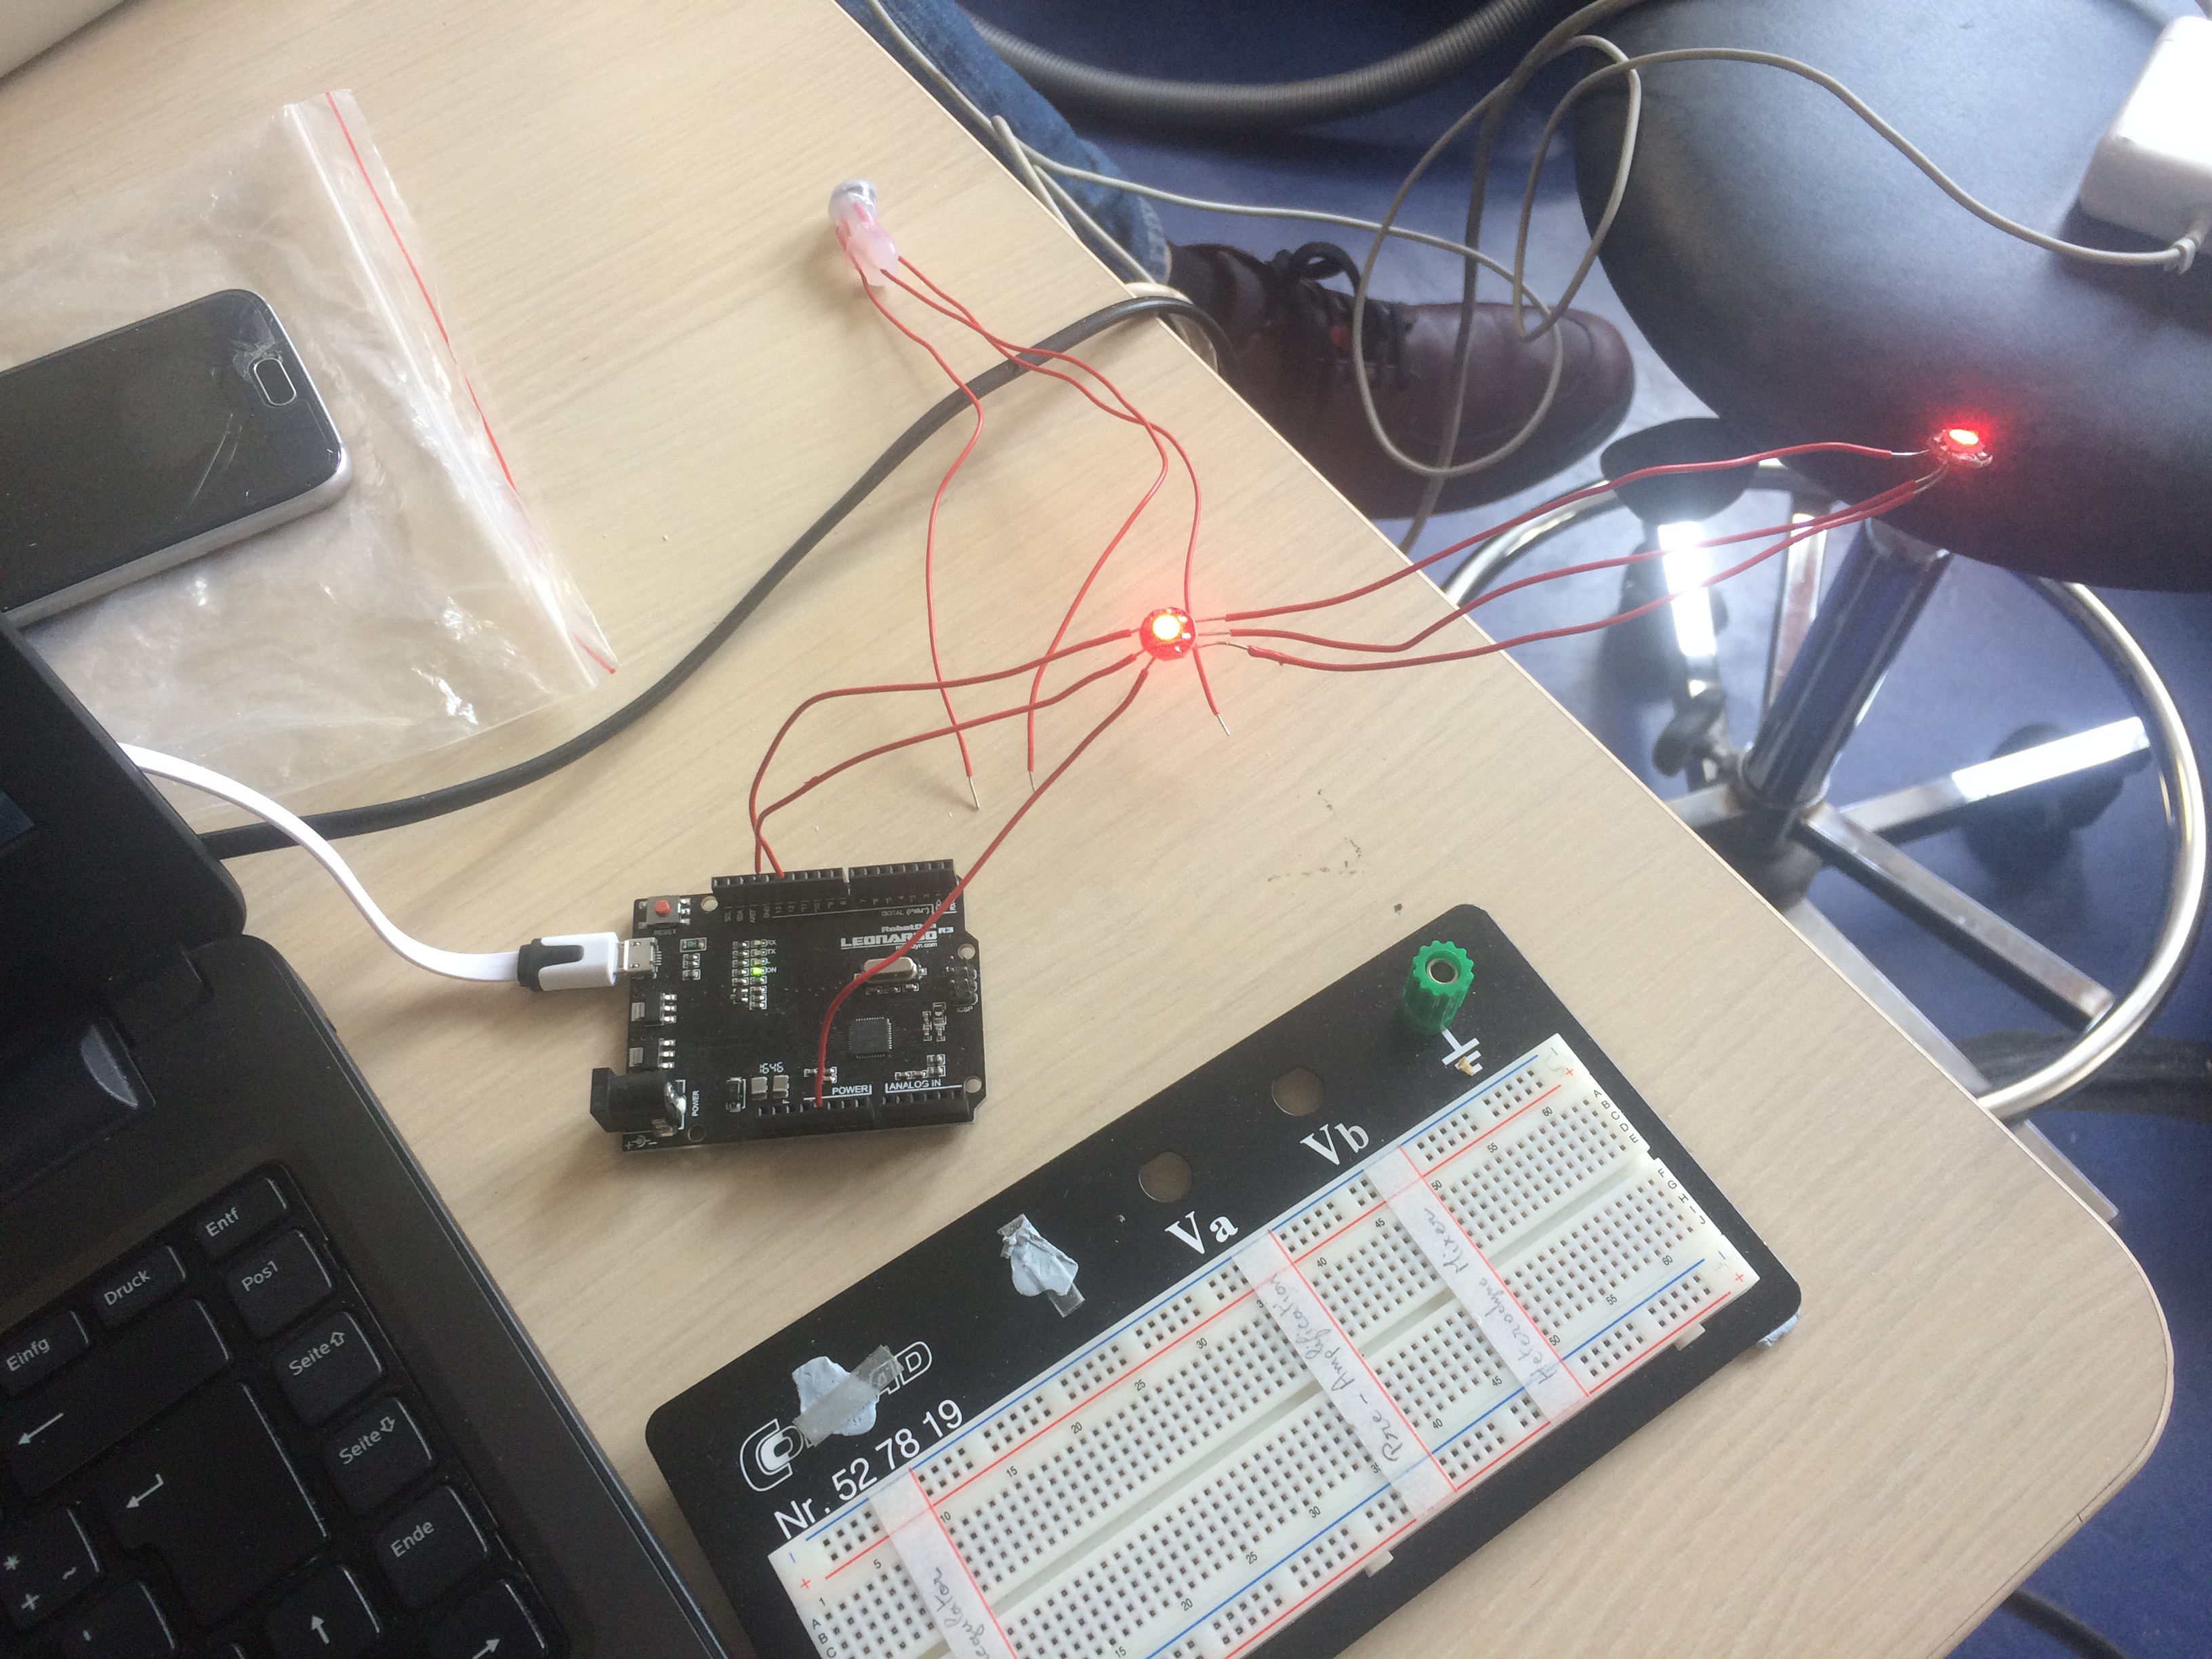
First visual mapping prototype (just testing how the technical part of it)

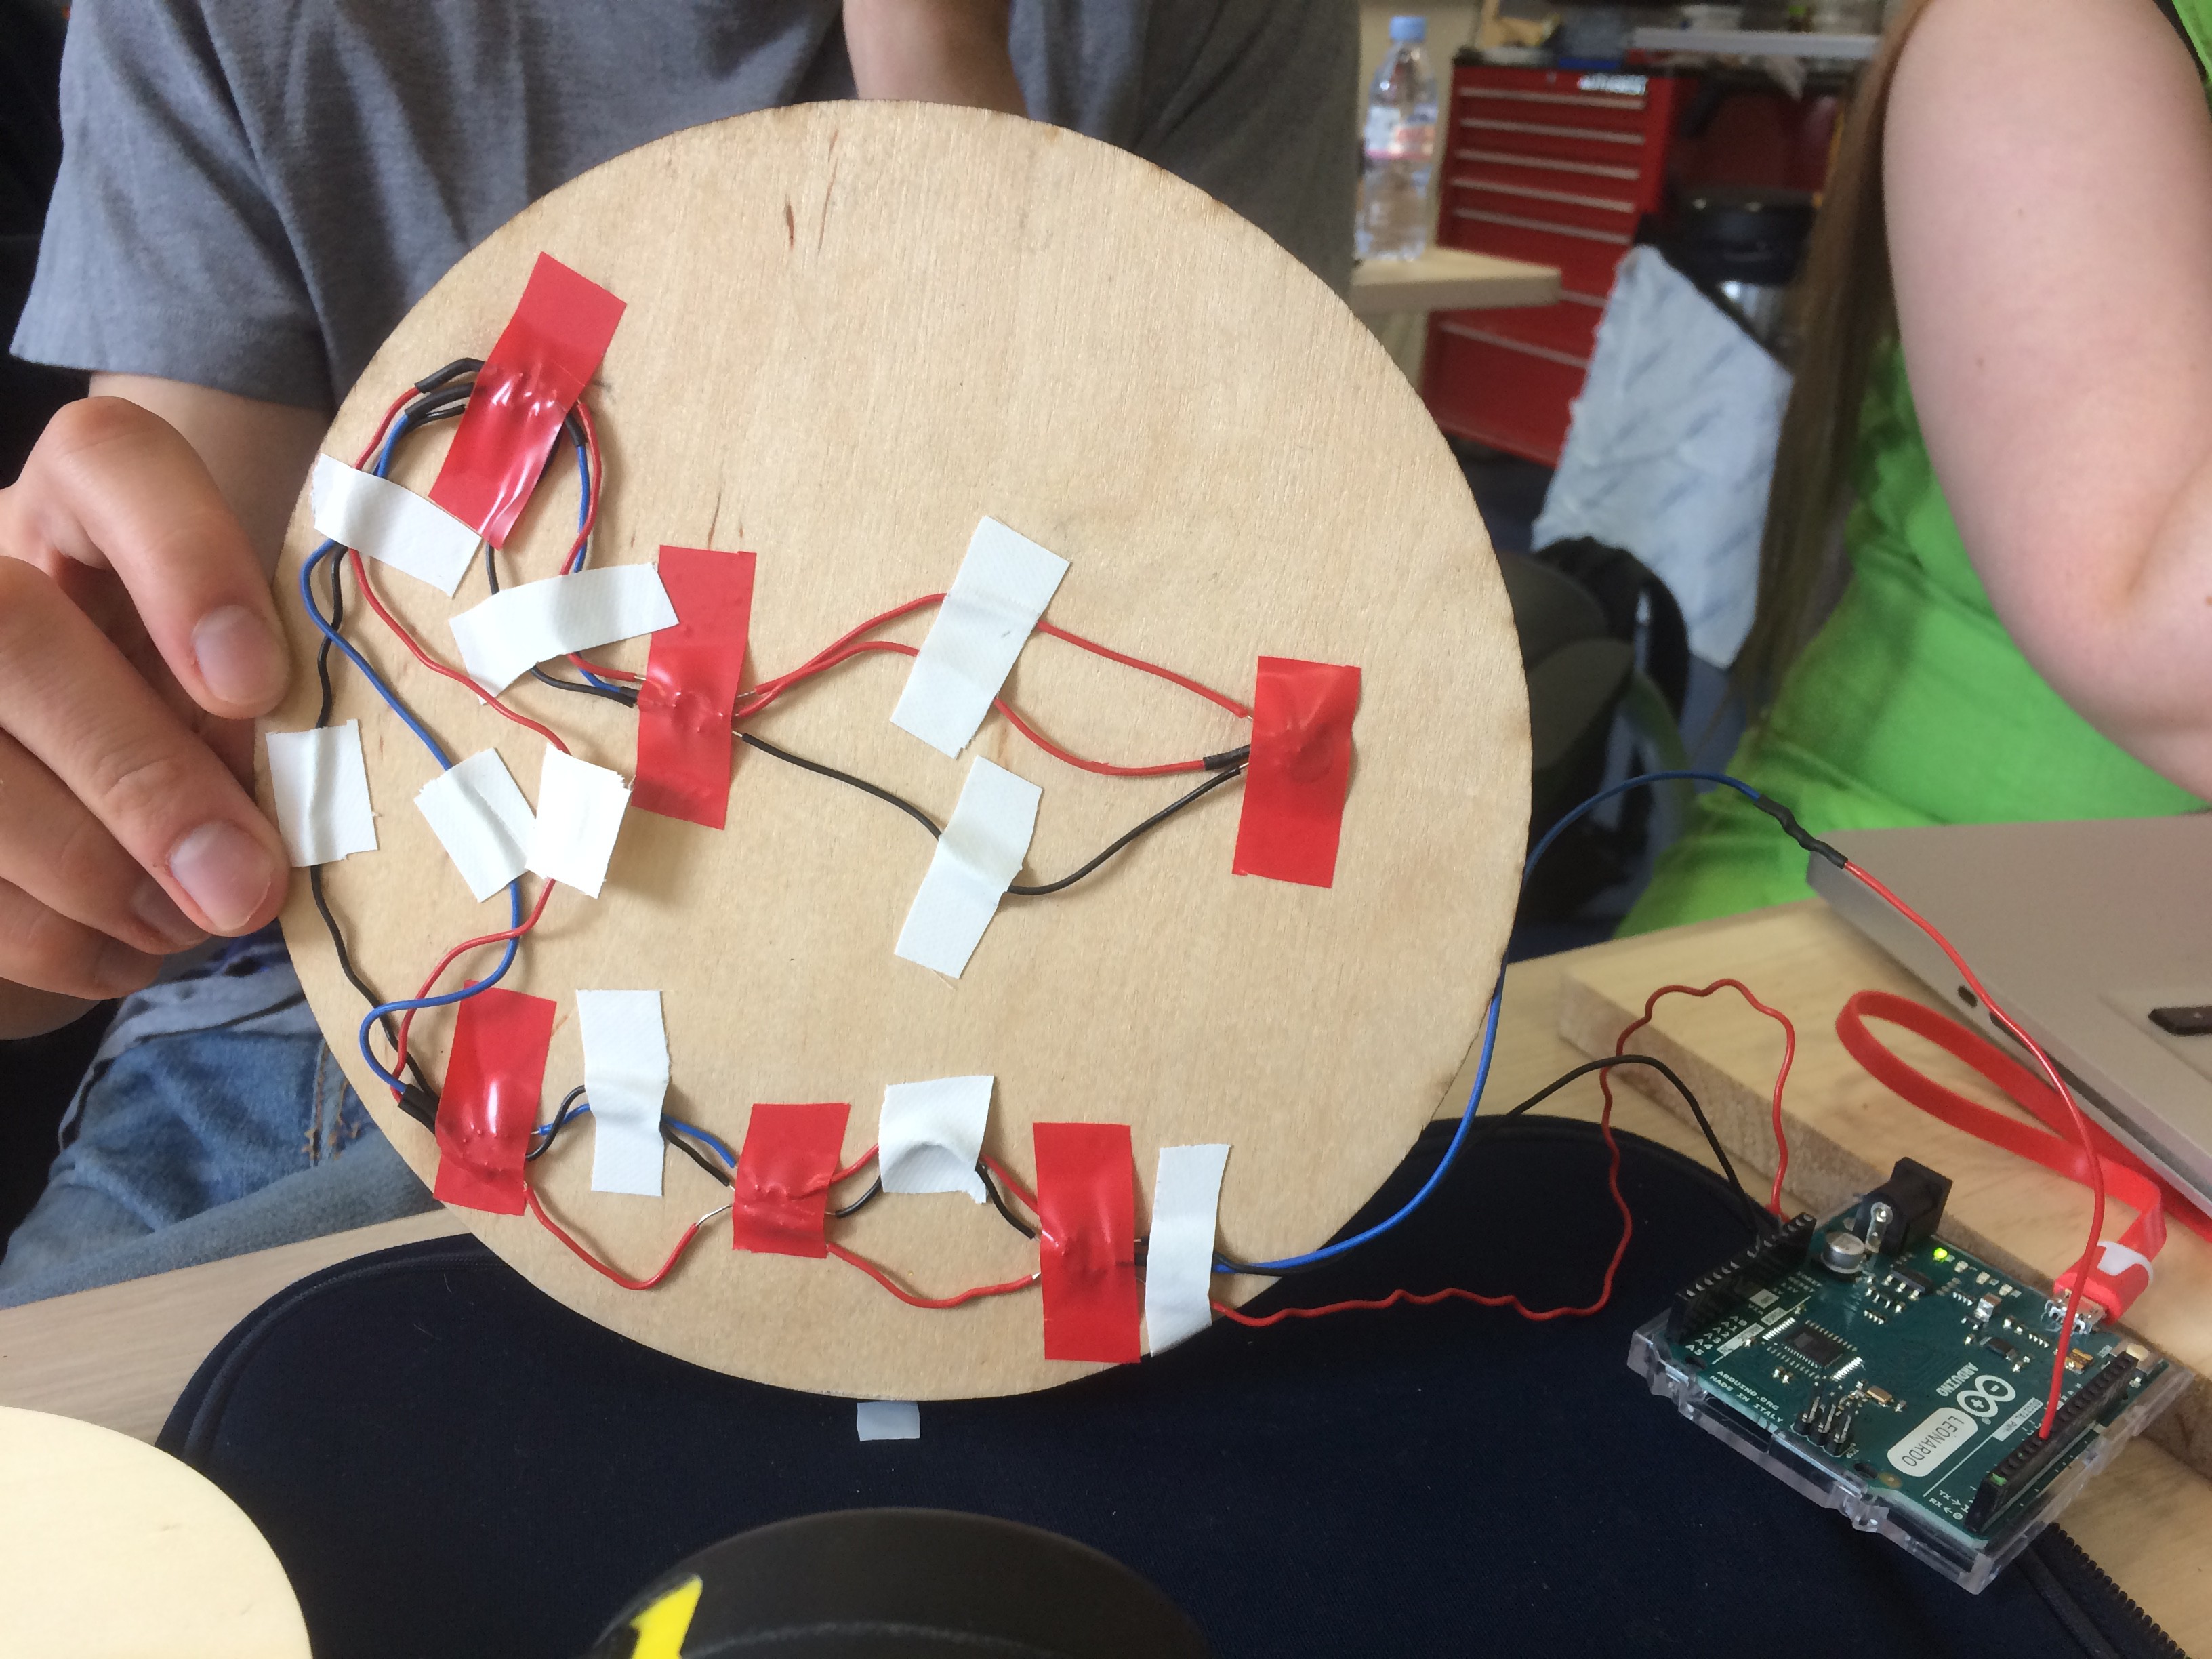
First prototype for the idea of a kinetic origami moving in real-time according to the measured pollution index.
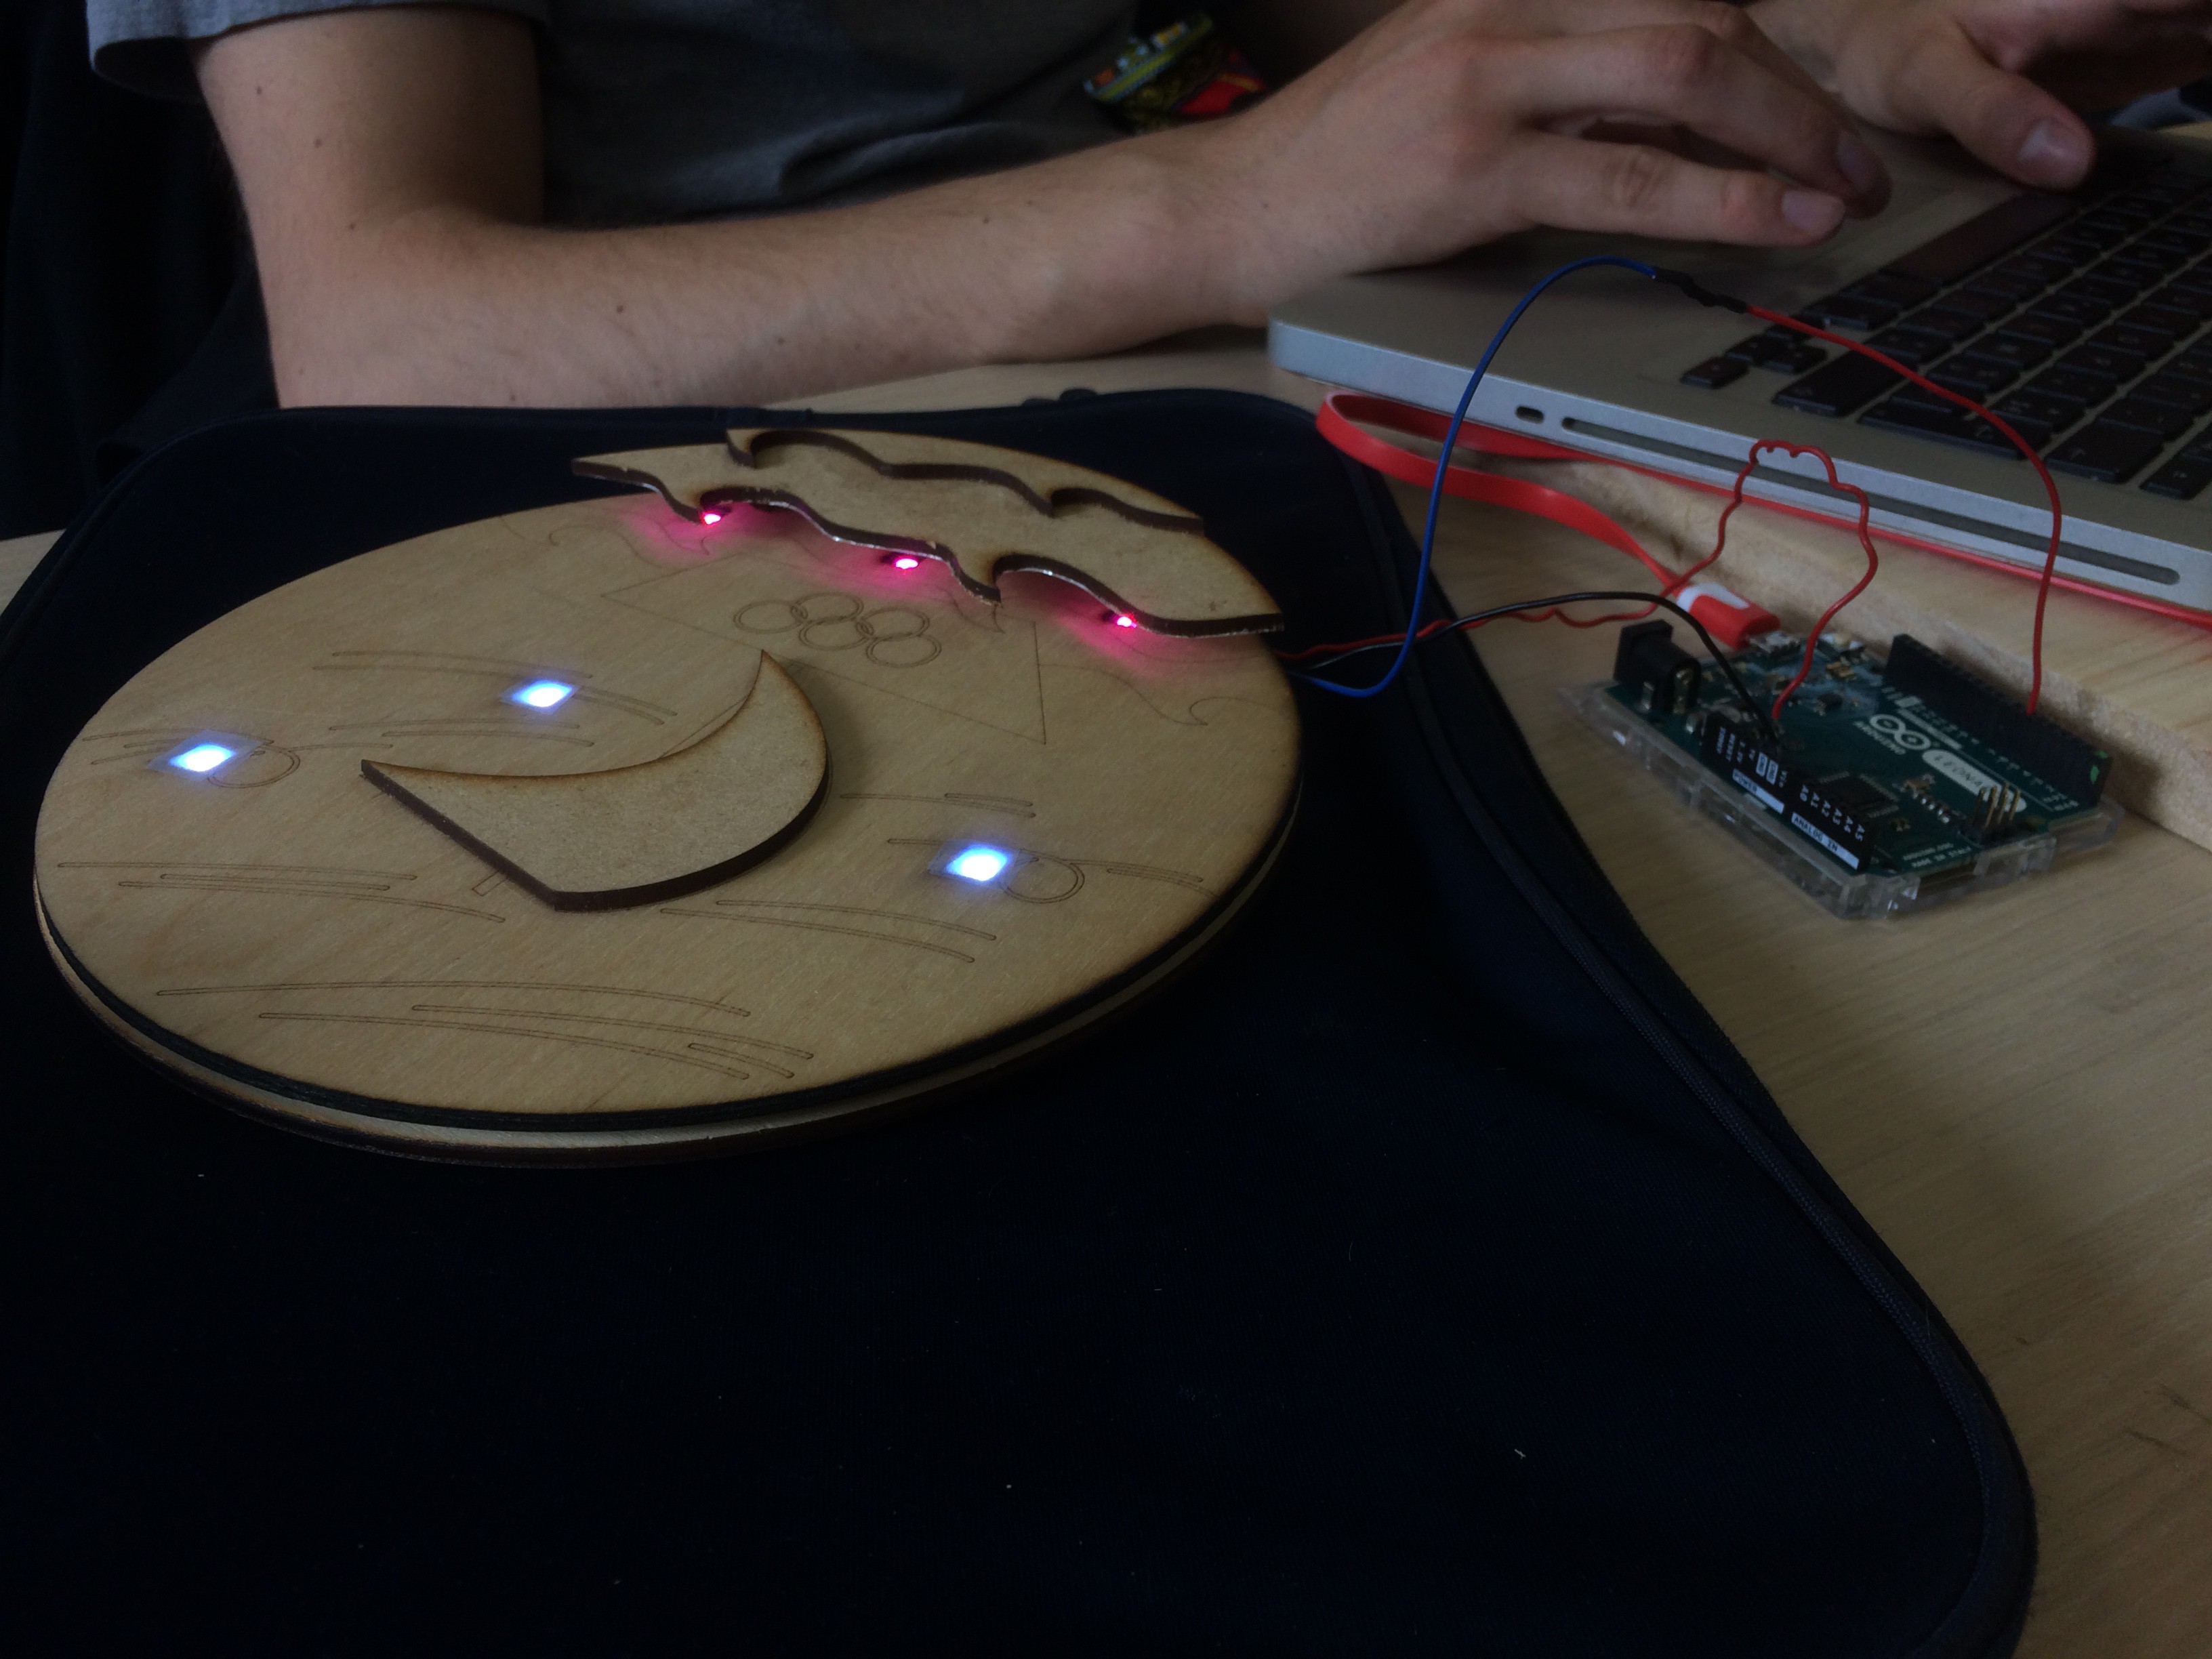
And lastly the prototype we chose to build up on for the rest of the project time :

This object was designed with Blender, materialized in the form of a wood plate with different layers and shaped in with a laser cut machine. It displays a navigating boat on its surface, making a reference to the emblem of the City of Paris.
The emblem of the City of Paris is a representation of the motto "Fluctuat nec mergitur" , meaning "Tossed by the waves but never sinks". By using this reference our message is that the fight against the air pollution in Paris should be seen like this boat, that despite the destabilizing waves, never sinks or stops heading forward.
As an outcome of these steps of our project we decided to focus more on air pollution, because we found the corresponding data to be easier to be accessed and measured.
To one of the upper 'wave' layer we added an Aluminium foil to create an interesting effect of color dispersion.
In the following step we built a NeoPixel Digital RGB LED Strip circuit, connected it to an Arduino board (which is connected to the laptop via a USB cable) and programmed it to light up the desired color combination at the desired time intervalls.
As the team member who was executing this step was a total beginner in Arduino with the help of YouTube video tutorials she managed to add the Neopixel Library to the Arduino software and test the Neopixel LED with the already existing samples, named as 'Examples' in the Arduino Library section. In that way you already have a pre-fabricated code, that you can just run on your Arduino board and make the Neopixel units light up.
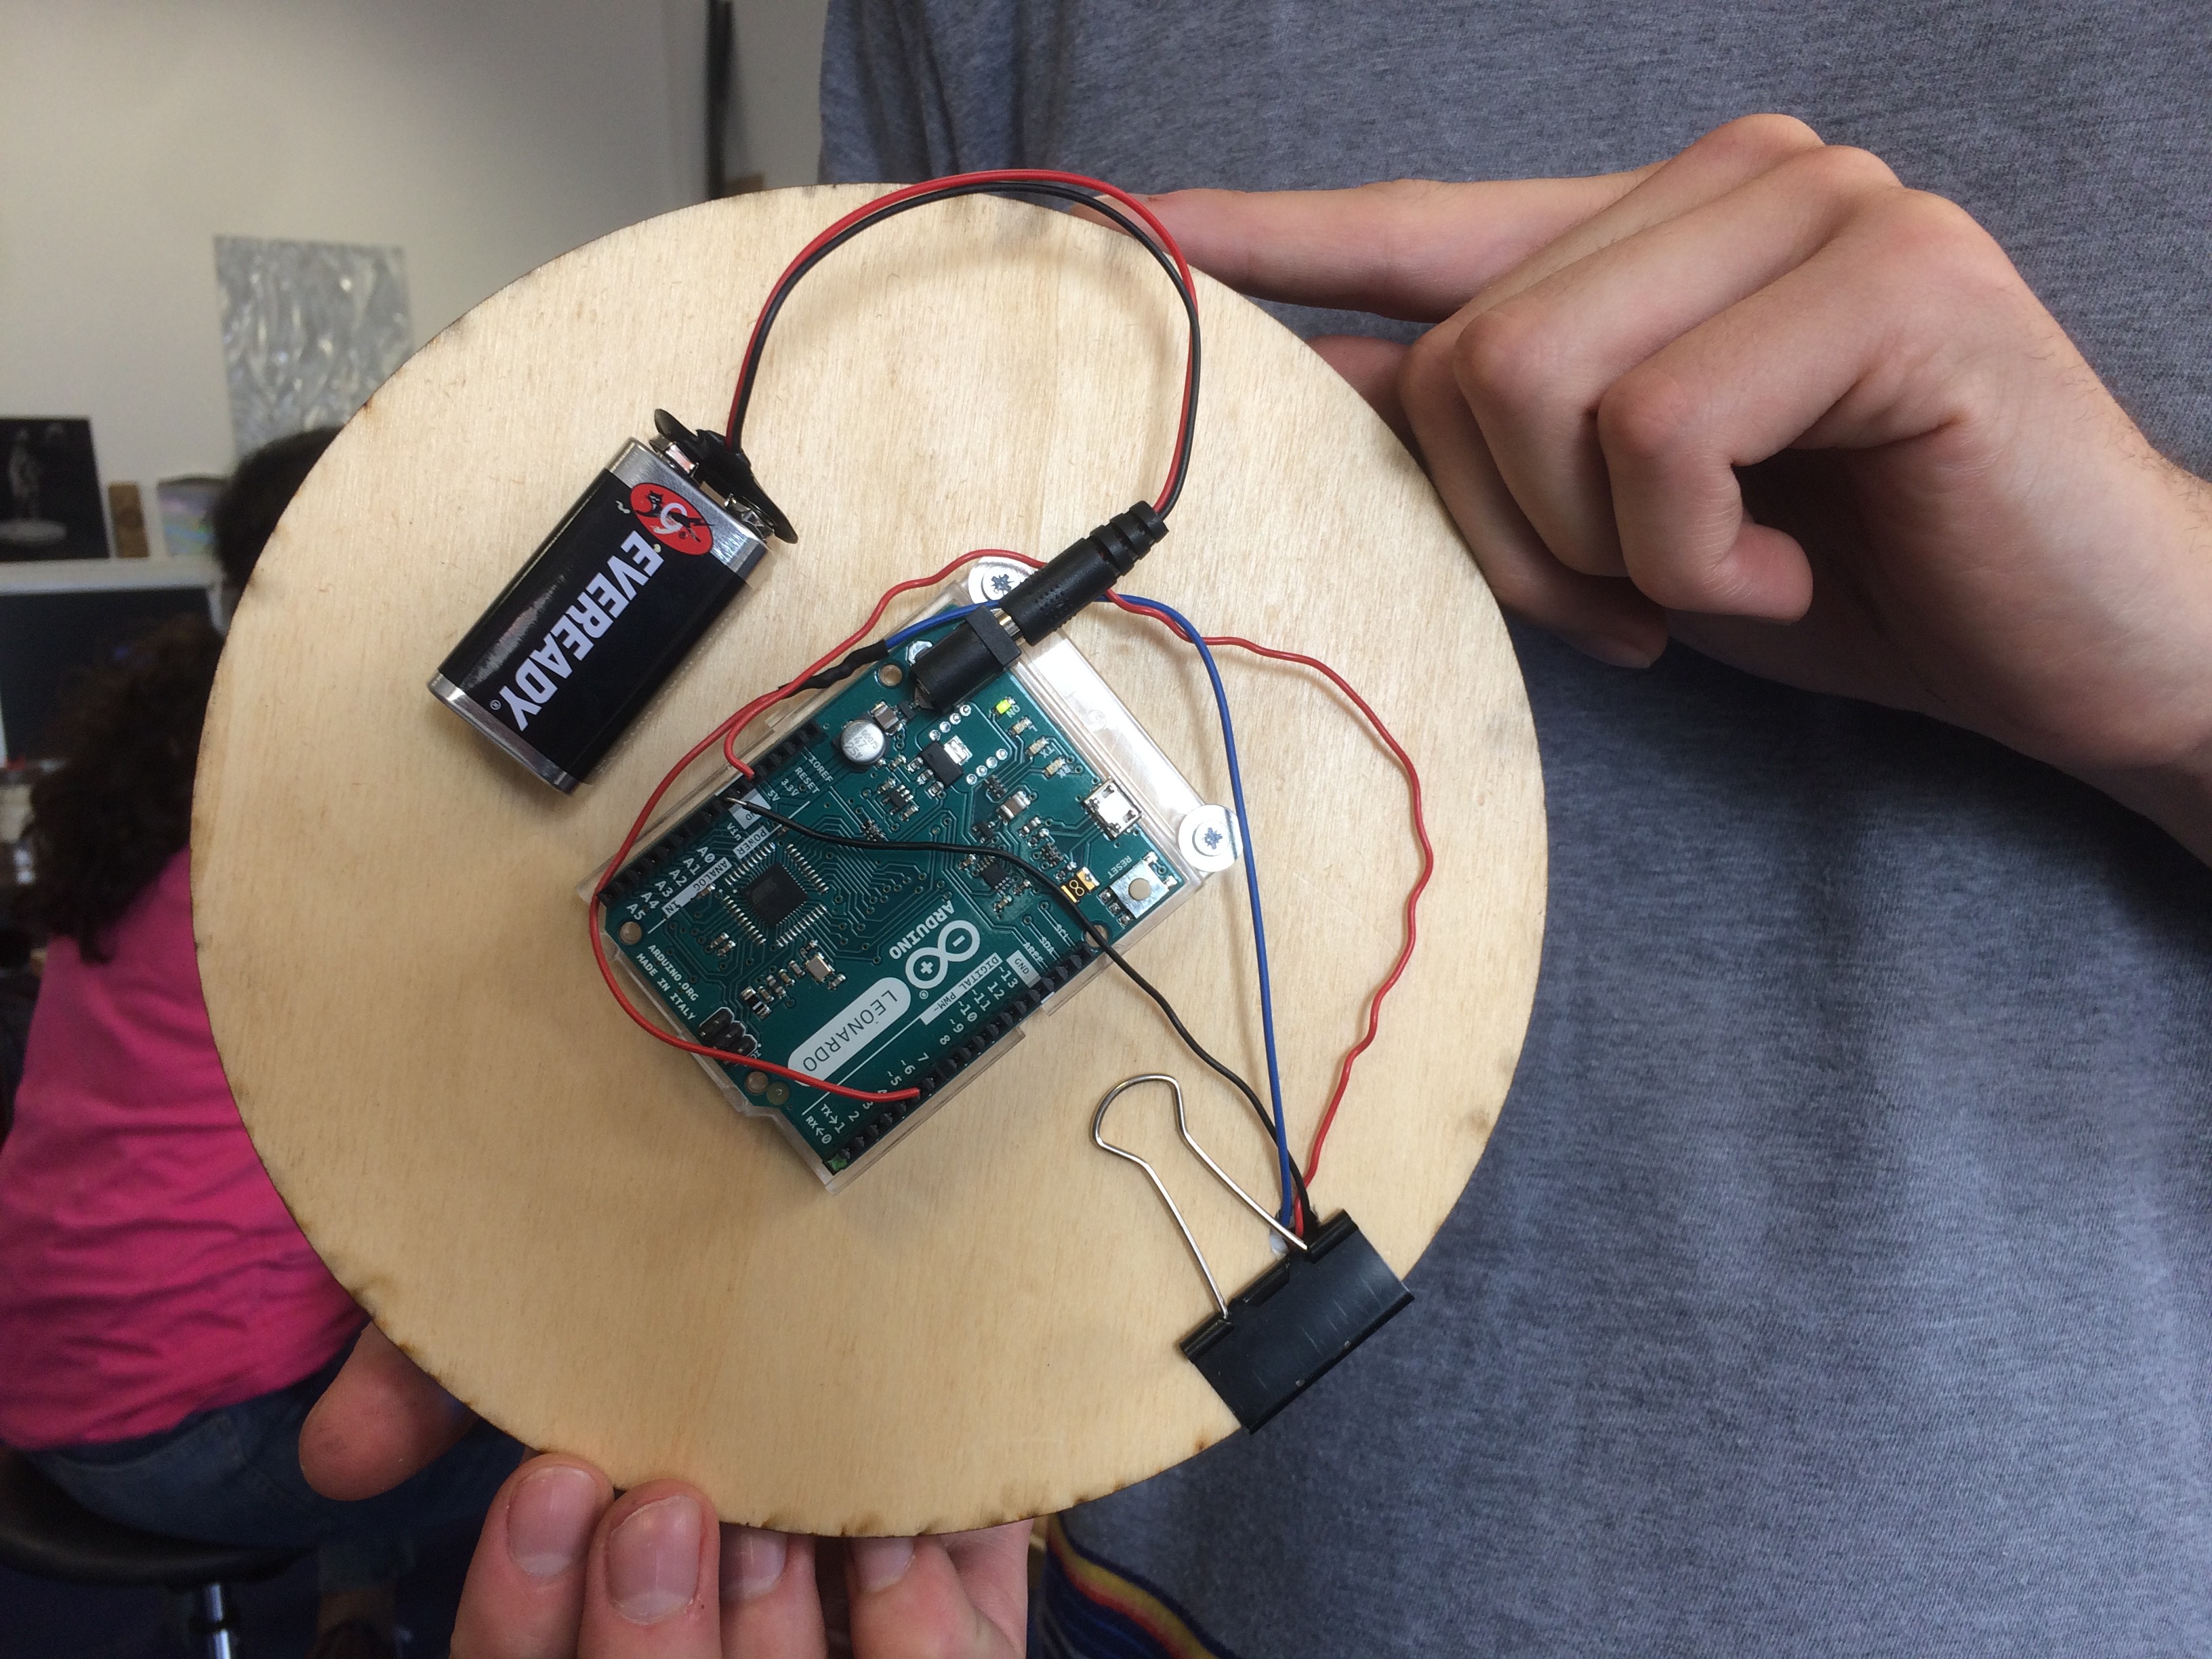
After that we installed the RGB circuit into the four holes of the wood plate and controlled it through the Arduino software. Moreover, we added a 9V Battery to the circuit, so that it could become a portable device.
Discussions
Become a Hackaday.io Member
Create an account to leave a comment. Already have an account? Log In.