 Jacob David C Cunningham
This has been running for almost 4 years lol... the position has changed a couple of times and that's primarily a problem with regard to the season/capturing the highest arc/intensity of the sun on the graphs. I used to have some really nice ones.
It's still up, collecting data, sometimes there are down times like power loss.
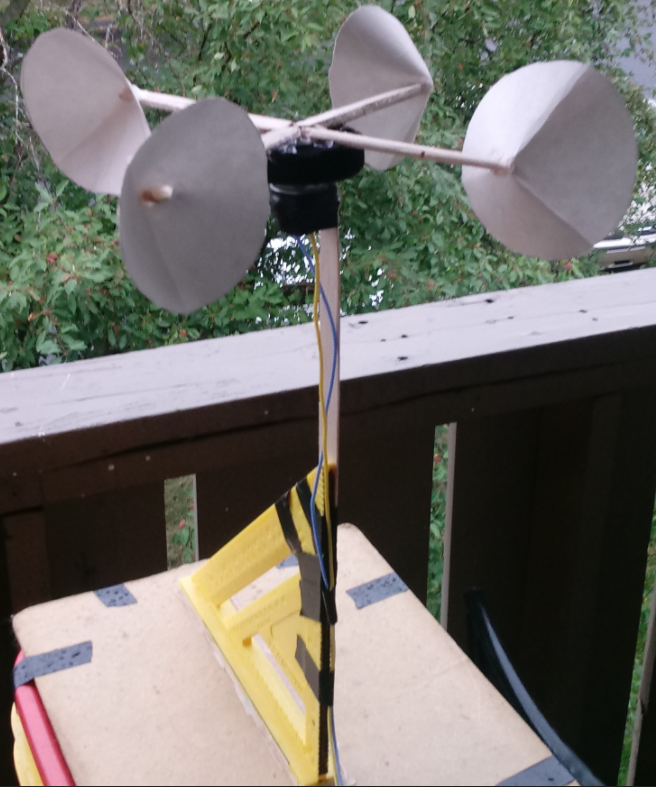
Also I built an anemometer a while back... this collects even more data. The one above is every 10 minutes everyday/when sun is up.
The anemometer does batch collections of minutely of every second... and it tracks it locally on a text file in case it fails to upload... yeah there's more than 10 million rows of data now, just millwatts power generated per day lol.
https://github.com/jdc-cunningham/turbine-raspi
This uses plastic spoons now because the above made out of paper plates did fail eventually/get moldy from the rain.
Also the hot-glued ruler above did not last long. I had to mount the DC motor to a flexing-flag-pole thing and then attach it to a chair.
Discussions
Become a Hackaday.io Member
Create an account to leave a comment. Already have an account? Log In.