 jaromir.sukuba
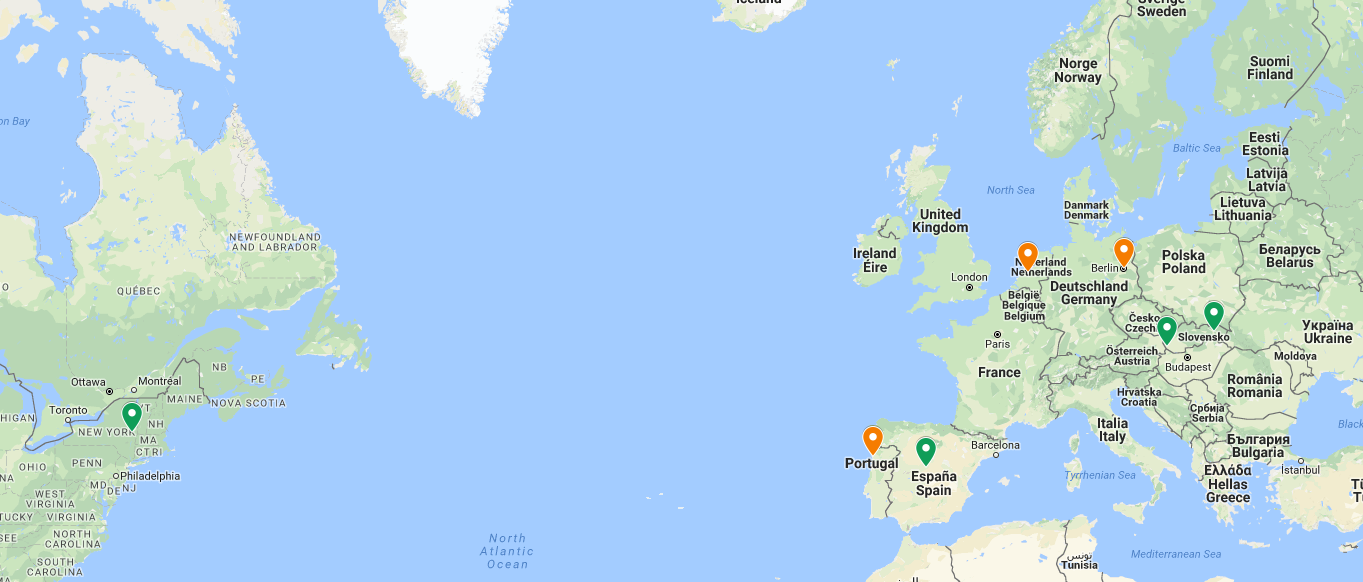
By now I have measurement data from four places - two from Slovakia, one from Spain and one from US; those are the green ones. The orange points are from places where loggers finished their job, but I still haven't them at home.
The loggers doesn't have internal RTC, just timer set to 6 minutes to wake up and perform light measurement, so I had to note the time when the loggers were started before packing, in order to assign timestamps to measurements. Typical record from logger looks like this
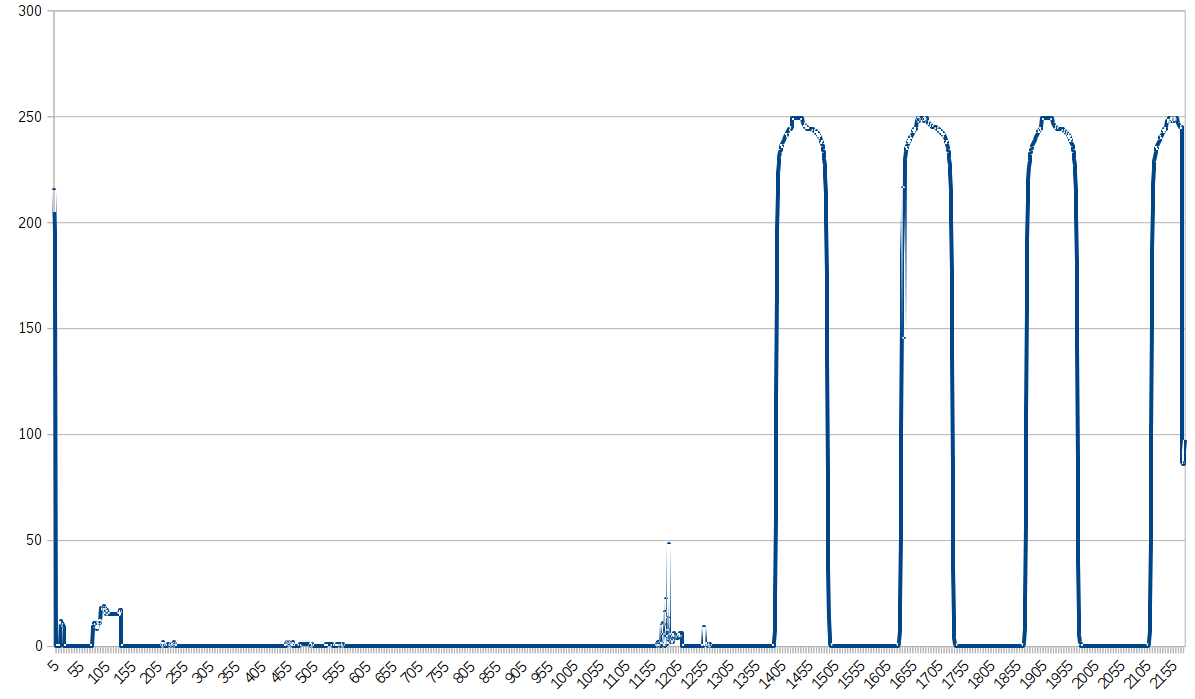
This is raw ADC count from LDR channel. The peak at the beginning is light at my desktop in Bratislava when I packed it, the minor light levels measured around points 100, 230 470 and 560 is light leaking into paper envelope during transport, finally around point 1200 the package was open and manipulated; at point 1400 there is first sunrise in Galapagar, Spain. After adding timestamps I blended all available data into single graph, looking like this
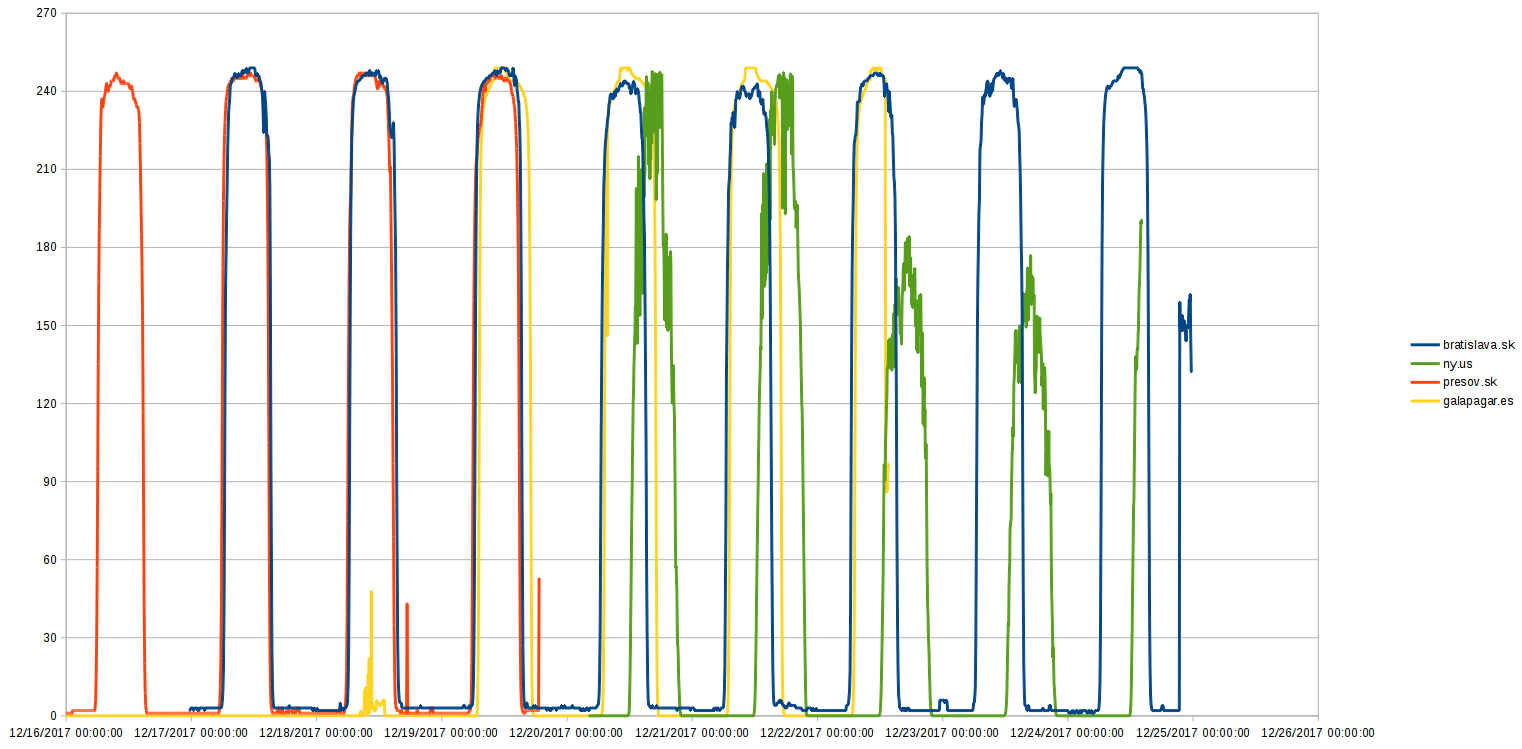
This is starting to look interestin. Firstly, the data look reasonable; the loggers were not extensively tested and all it could return with could be all zeroes or some other rubbish. This was not the case, so I could go on. I zoomed at 19th-20th of December:
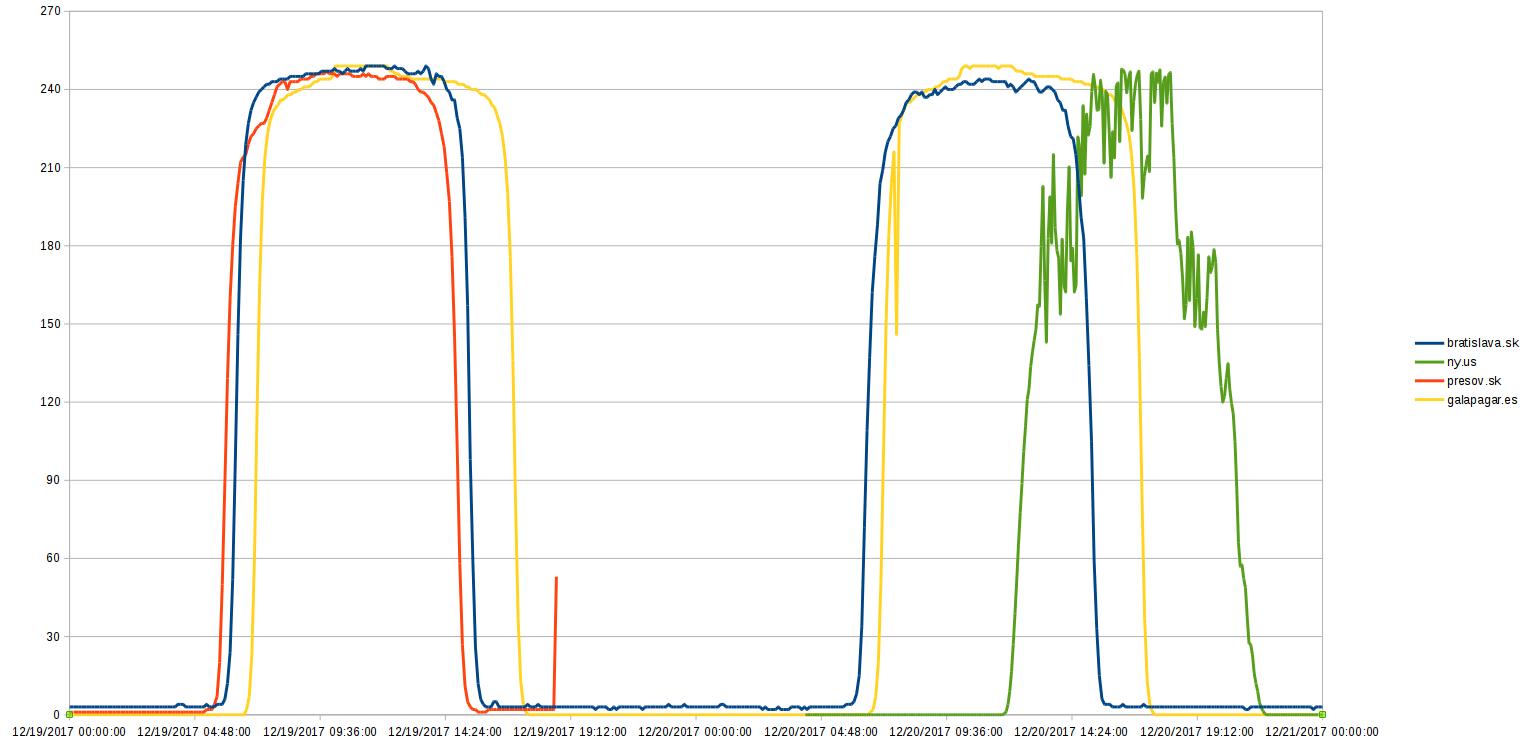
Comparing to blue line (my hometown), I can make following observations:
1, The sun in Presov, Slovakia (red line) rises earlier and the day is a bit shorter. As it's located slightly northern and approximately 320km eastern, it's quite expected.
2, Galapagar, Spain (yellow line ) has later sunrise and longer daylight. Again, that is not surprising, being ~1500km on west and ~900km southern compared to Bratislava.
3, Clifton park in NY, US: daylight something between Spain and Slovakia, local noon shifted rather right (later), being roughly another 5200km more on west than Galapagar.
So far, so good. Reality is checked, loggers seem to do the job correctly, Earth doesn't seem to be flat. Now I need to dissect the data some more, in order to obtain sunrise and sunset time. This is how single day looks like, blue line is raw value from ADC channel where LDR is connected (right axis), red line is resistance in kiloOhms (left axis, logarithmic scale):
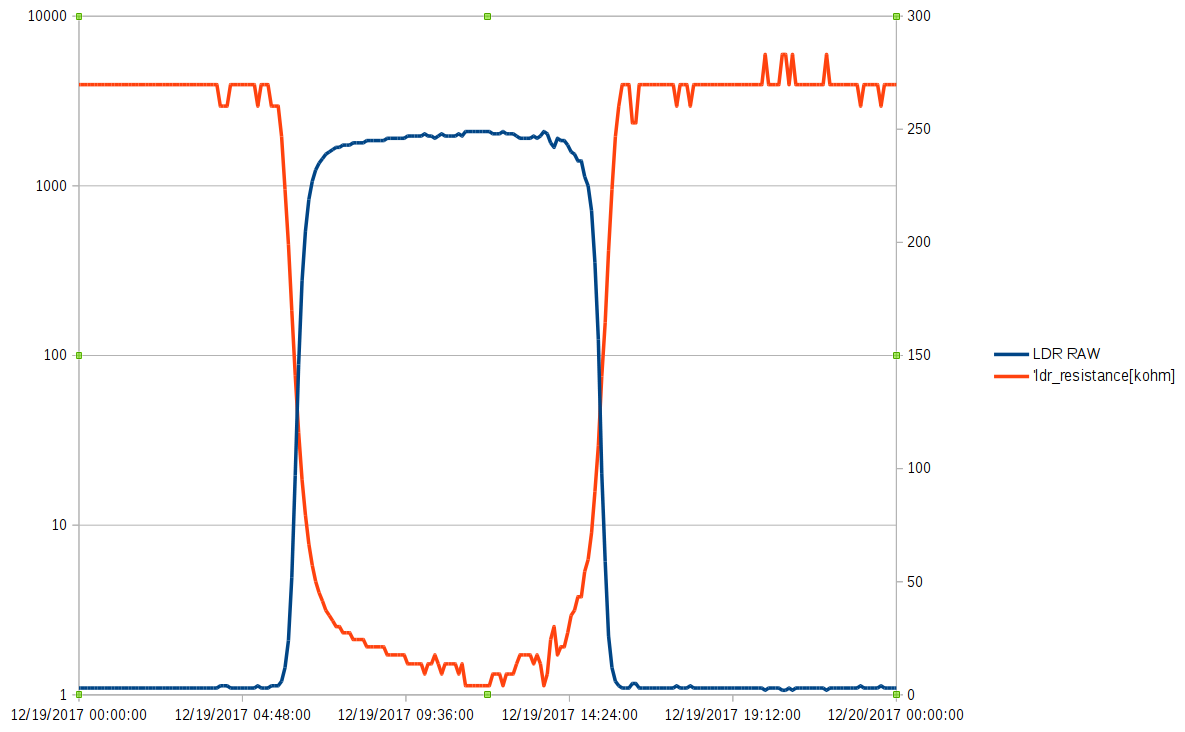
Interesting enough, illumination of LDR in lux is inversely proportional to log of its resistance, meaning the graph of illumination in logarithmic values would look very similar to the blue graph (raw ADC value), just with different scale. For now I won't bother with converting ADC values to resistance of LDR and then illumination, I assume I can use ADC values directly with good accuracy for the purpose of dusk/dawn identification. Because those events are easily identified as change in illumination due to particular place on Earth moving from/to its own shadow, it looks logical to me to search for major changes in illumination, that is performing numerical derivation.
Though this may be nice exercise for machine learning and artificial neural networks, keep in mind I have to choose algorithms that are easy to perform on low-frequency clocked microcontroller.
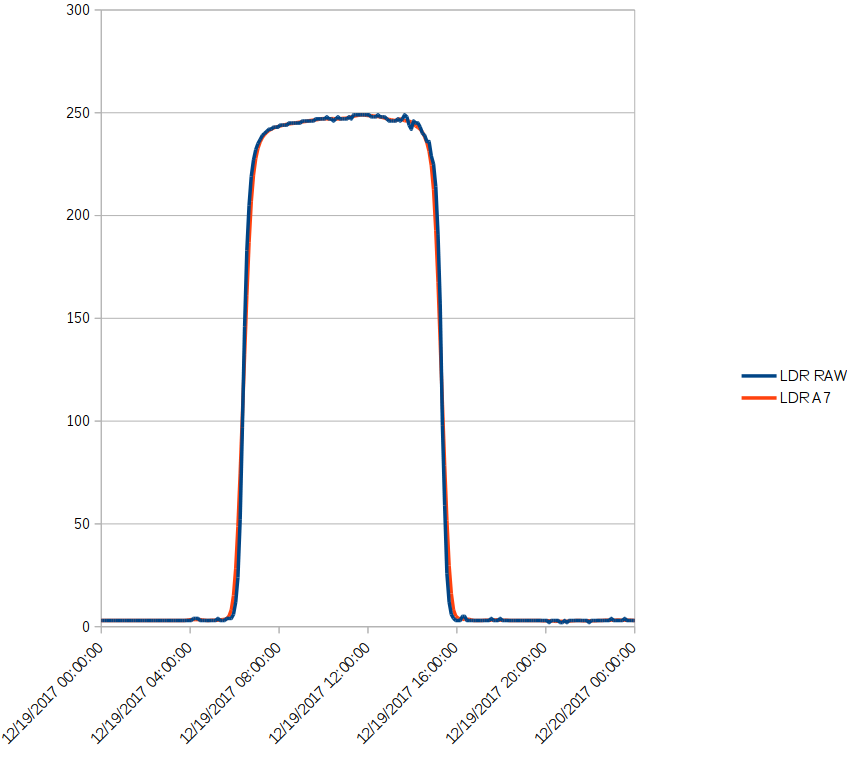
At first I applied one of simplest FIR filters on input data - running average filter, with 7 samples around midpoint. The difference doesn't look very convincing at first
Differences starts to appear as soon as differentiation is applied:
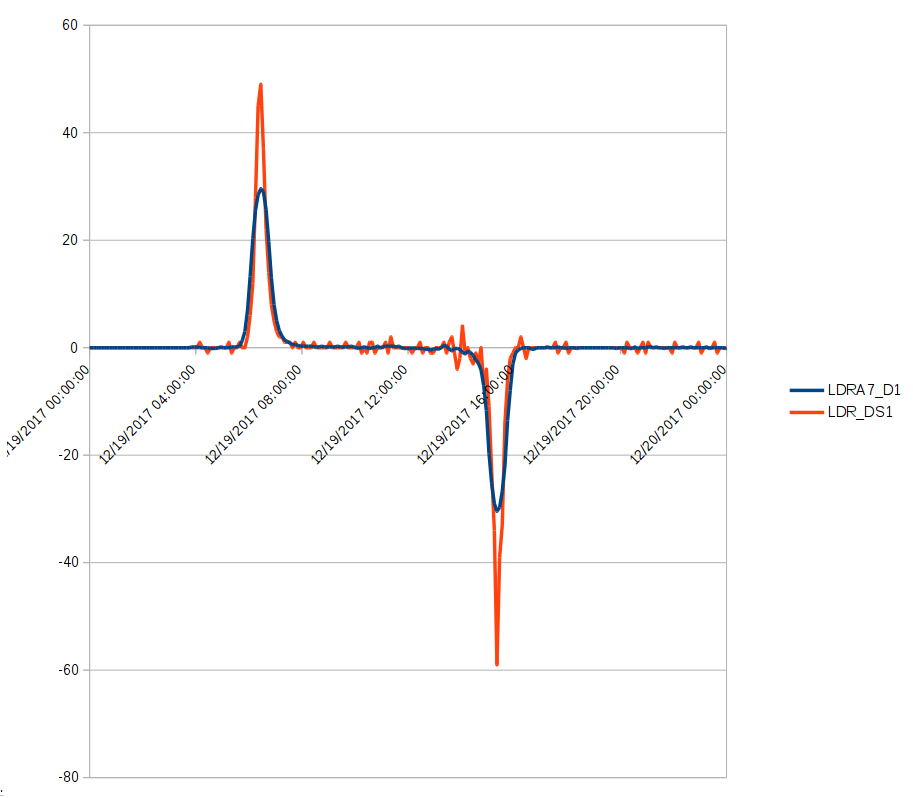
The blue graph is from filtered data, providing much more stable identification of illumination changes. Previous data combined into single graph:
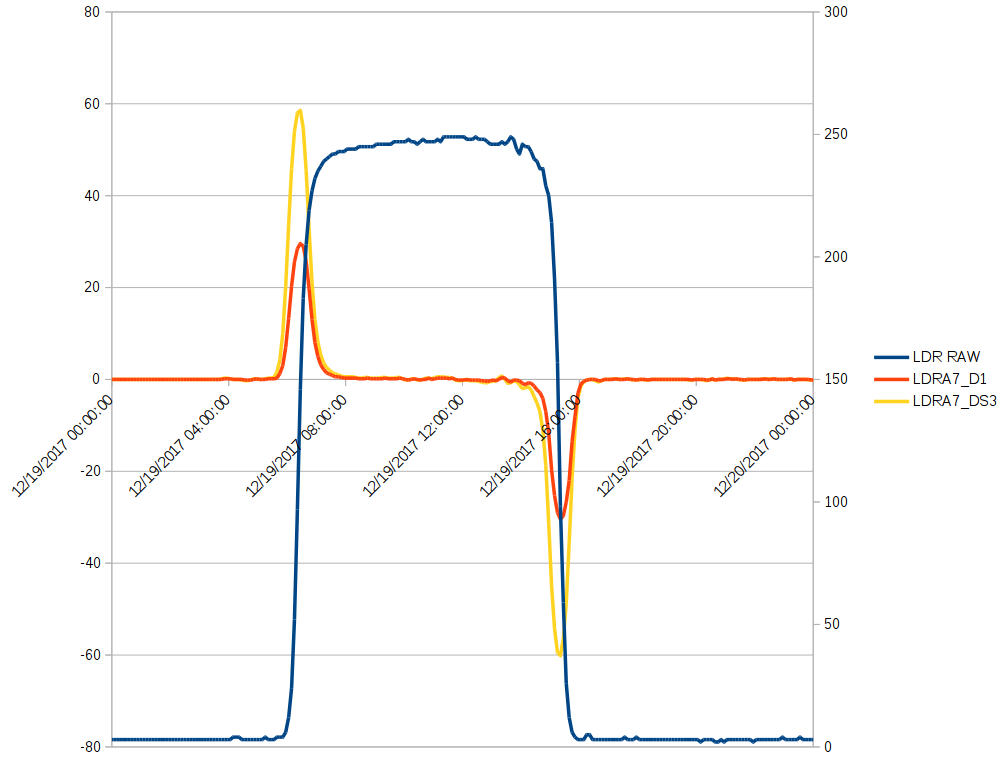
Blue line is raw ADC count (right axis), red line is difference from previous sample (left axis). I also added "wide" difference, where N-th result is difference between N+1th and N-1th member of input data. I was curious whether this will make any impact on sunrise/sunset resolving accuracy.
Then I "manually" identified all peaks from input data, calculated average of local noon and daylight from three days (for simple and "wide" difference) and compared it with expected sunrise/sunset data from here:
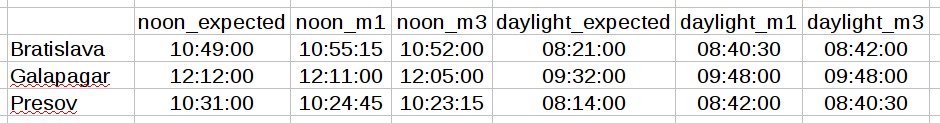
It looks like calculation of local noon is not very far from reality, though daylight time looks to be somehow longer than expected, like +20 minutes, perhaps asking for slight algorithm tweaking. It also reveals that there is not much of difference between simple and "wide" differential.
So, first results are very reasonable. I'll wait for return of more loggers and perform the same thing on their data.
I might also consider "threshold method", where sunrise/sunset would be identified as passing threshold value of light level, perhaps given as percentage between average nighttime and daytime light levels. Looks simpler, though may be more sensitive to artificial light.
Discussions
Become a Hackaday.io Member
Create an account to leave a comment. Already have an account? Log In.
Looks like a good start.
I wonder if you are better off trying to find a different point than exact "sunrise". I think sunrise is the point when the upper limb of the Sun just hits the horizon. The sky is already fairly bright by that point; I watched the sky in real time a few mornings while monitoring the logging, and was surprised by how high the values got before the actual moment of sunrise (like 1/4 full-scale ADC). This could account for your extended daylight time - you are detecting the beginning/ending of some twilight time.
Maybe you can use the beginning/end of one of the twilight times instead of the exact sunrise/sunset: you can predict their times just as easily. See the wikpedia article about the various twilight definitions:
https://en.wikipedia.org/wiki/Twilight
Are you sure? yes | no
Sunrise should be the point where Sun hits the horizon - and it should mean also fastest change in amount of sunlight, ie. highest derivation of ADC count (disregarding the actual ADC count), that's why I focused on it. Problem with definitions of twilight is that it's based on Sun elevation above (under) horizon. While being reasonable definition for "proper" measurement; is somehow unsuitable for mine, one-point measurement. I don't have clear relation between Sun elevation and light level (ADC count).
Anyway, I'll try also the threshold-level method, I'm curious of it's outcome.
Right now I have one logger with two LDRs, one of them is covered by blue filter. I hope to give me better distinction between light during twilight and actual sunrise/sunset, but that's just experiment.
Another problem with current measurements is that it's quite coarse. Final LLG is supposed to have 1 minute measurement period.
Are you sure? yes | no
I guess my point is that if you determine that your derivative detector reliably detects when the sun is X degrees below the horizon (for whatever reason), you can calculate the position based on that, instead of having it detect the exact moment of sunrise.
I like the color detector idea.
Are you sure? yes | no
@Ted Yapo I think I understand now. Thank you for your insightful comments.
Also, I realized the current algorithm doesn't detect the moment when Sun hits the horizon anyway, rather time of its center crossing the horizon. I can tune my "sunset"/"sunrise" detection algorithm for whatever solar zenith angle is easy to detect and compare it to predicted values for that particular angle.
Are you sure? yes | no
You may have found this already, but it looks relevant, and has some references you might also find:
ftp://ftp.soest.hawaii.edu/PFRP/tag-data/pdf/Hill.pdf
Are you sure? yes | no
@Ted Yapo
Thank you, I already know this paper. I have a few other ones being my bedtime reading - I uploaded it here
https://cdn.hackaday.io/files/285501221483200/papers.zip
Are you sure? yes | no