Having highly limiting restrictions is a fun way to practice problem solving and creativity. In the case of the 32x32 pixel matrix I wanted to have lots of information on the display, but were challenged by the resolution. Despite this limitation it was possible to achieve very interesting things.
I programmed the animations using JavaScript and tried out different designs in a browser.
This project being an Internet-of-Things device I wanted to fetch interesting and relevant information off the internet and local sensors and display them.
Super tiny font
I searched for a small font to display human-readable letters to convey information. I found the TomThumb font which squeezed latin characters in a 5x3 area, if you think about it it's pretty amazing how our brain can distinguish them at such low resolution (context helps a lot though):
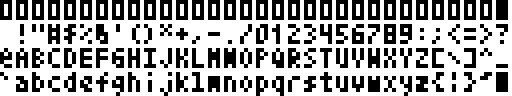
I had to adapt some letters, as not all of them perfectly fitted the 5x3 area (g, j, p, q, y). This amazing font allowed 32/4=8 characters per line and 32/6=5 lines of text:
Animations
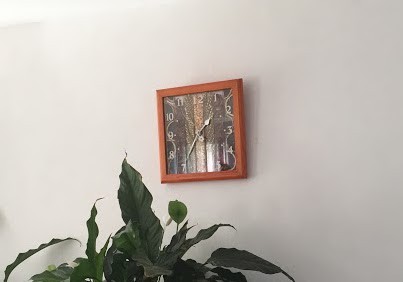
The first thing that I wanted to display was time. My ultimate goal was to replace my dad's wall clock:
Here are the animations I came up with:
Analog clock
This one was pretty easy, simply evaluate the angle from the hours, minutes and seconds and draw lines from the center to the edges. I liked the way the hands extend up to the very edges of the matrix. One can tell which hand is which by the intensity of the hands.

I also tried to use red, green and blue colours to distinguish the hands, but it was atrocious.
Digital clock
The digital clock only took the topmost line, so I added some more information on the next 4 lines: date, inside temperature, inside humidity and outside temperature which I got from openweathermap and update every 10 minutes.
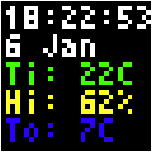
The temperature colour is blue under 10C, cyan between 10-20C, green between 20-25C, yellow between 25-30C and red above 30C. The humidity is green between 40-60%, yellow between 20-40% and 60-80% and red otherwise.
Binary clock
This one was for the sake of the exercise, completely useless for its function as it's not easily human-readable. The numbers are defined by 6 bits, so maximum value of 2^6-1=63. The most significant bit was on the left side, first line is hours, then minutes and then seconds.
This example shows a time of 16+2:16+8+4+1:32+16+4+1: 18:29:53.
Reading the time and getting your head around the powers of two usually meant that by the time you understood the time it had already changed.
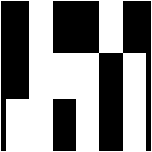
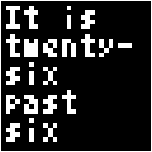
English word clock
Since there was enough space I wanted a clock that spells out the time in plain English. This is called a "word clock", there are many similar projects on Hackaday.io. Very human-friendly.
日本の時間
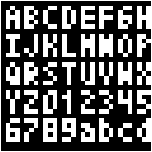
I'm very fond of Japanese, I wanted to make a "Japanese word clock" display where the time would be spelled in Japanese characters. Amazingly there was a full Japanese alphabet (Hiragana, Katakana and Kanji) that fit a 7x7 area per symbol called Misaki font (Geocities is still alive?). It has even been ported to Arduino so it was just a matter of reformatting it for JavaScript.
I tried to use only Katakana to tell the time, but there wasn't enough space as there was a hard limit of 4 characters per line and 4 lines with this font (16 symbols total). Also using only Katakana characters didn't look very nice.
Using Kanji fixed that and I must say I like it a lot:

今は午後六時二十六分です means "it is now 6:26 in the afternoon", although I doubt my dad can read it.
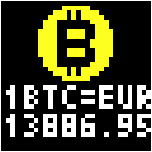
Bitcoin ticker
This animation was just a "why not" idea: a Bitcoin ticker that updates itself every minute. The data is taken from Blockchain ticker.
Train timetable
I used an open API to fetch the time for the next trains in departure from the local train station:
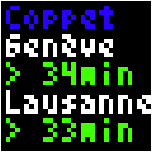
If the next train is more than 20 minutes away the text is green, between 20 and 15 minutes it becomes yellow and less than 15 minutes it becomes red to indicate that catching it won't be easy as it takes about 20 minutes to walk to the station. Under 10 minutes it will show the next departure.
Power usage display
Previously I made a project that reads the live household power usage off the house power meter. The project was up and running, so I made an animation to display the data:
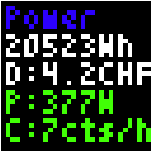
It shows the daily power usage in Wh, total day cost, live usage in W and live cost per hour. It gives a good overview and make one more aware of it. The instant power usage numbers become yellow and red depending on thresholds.
Discussions
Become a Hackaday.io Member
Create an account to leave a comment. Already have an account? Log In.