 Orlando Hoilett
Combined a basic current to voltage converter circuit for the photoplethysmograph and my MMA7361 acceleromteter and took some data of my plethysmogram and the movements of my arm. I got some data, but do not know how to process them as yet.
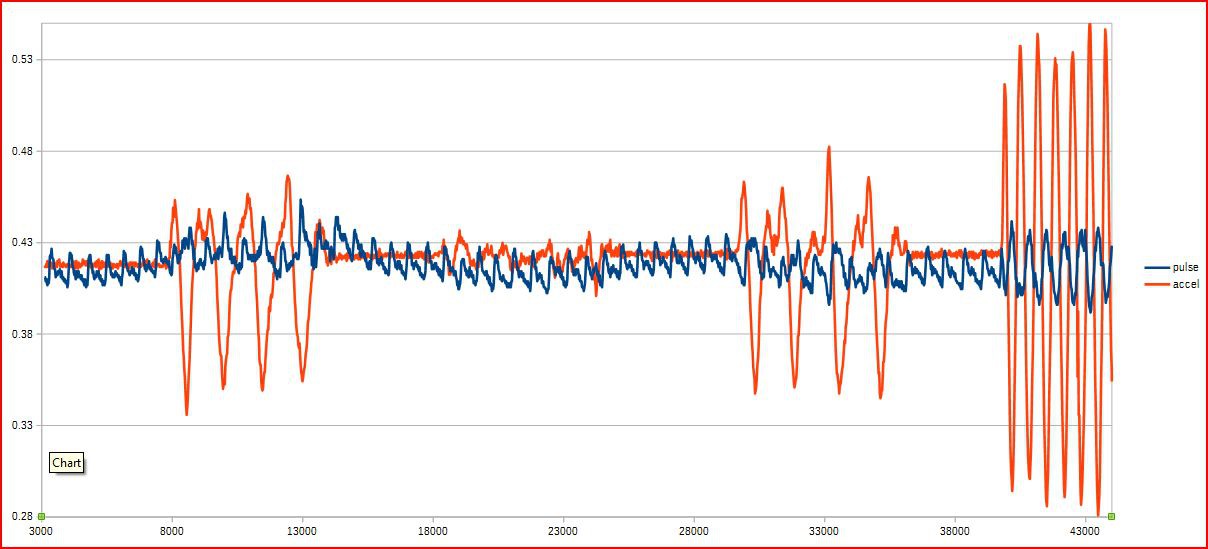
The orange signal is acceleration data (in the z-direction) and the blue signal is the pulse signal. There are a few distinct "zones." The first is me being still, then moving my hand up and down, then being still, then moving my arm left and right, then being still, then moving my hand up and down, then being still, then moving my hand up and down more quickly. The x-axis is time in milliseconds and the y-axis is signal amplitude.
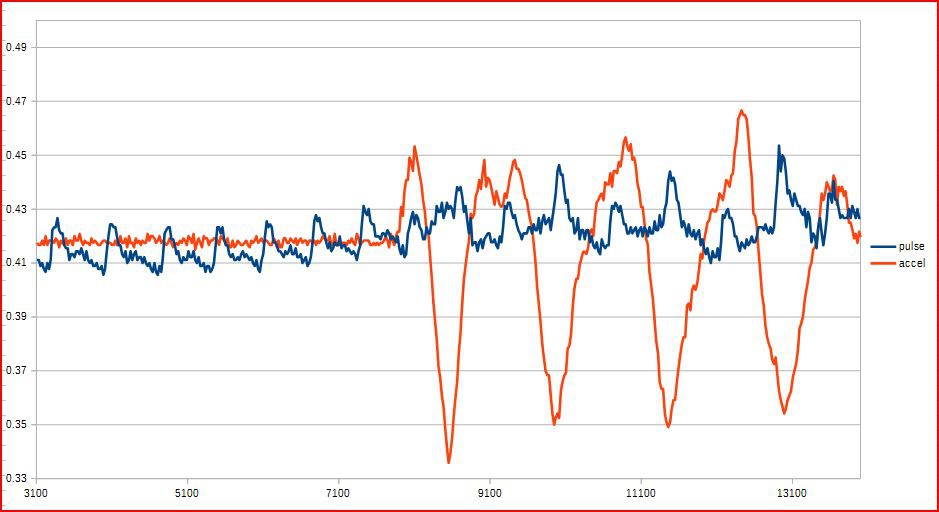
The second picture is zoomed onto one section.
Discussions
Become a Hackaday.io Member
Create an account to leave a comment. Already have an account? Log In.